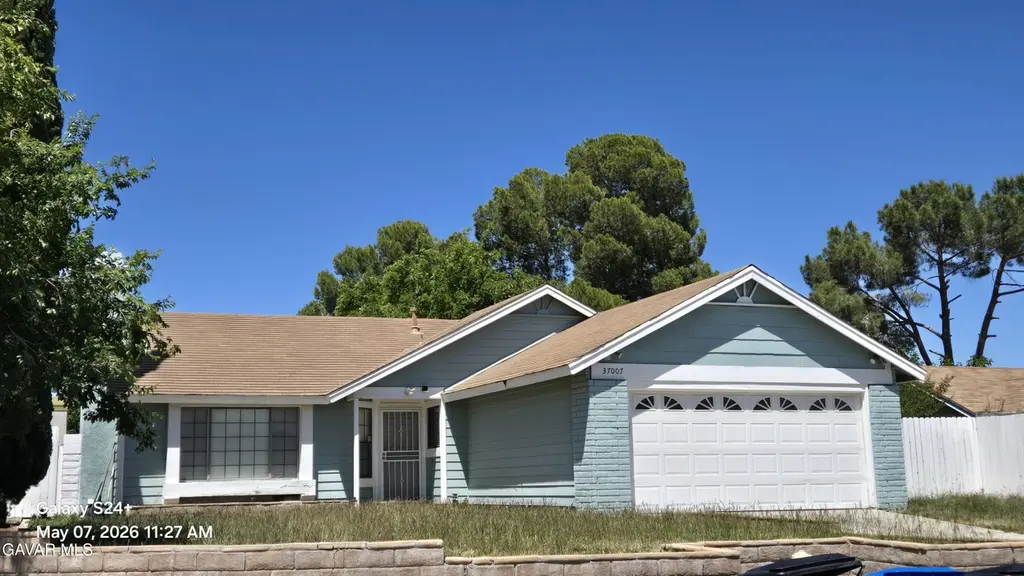
37007 Vía Del Rio · Palmdale, CA
Flood risk 1/10 · Minimal
- FEMA flood zone
- X (unshaded)
- Chance of flooding over 30 yrs
- 0.0%
- Est. flood insurance / yr
- $507 – $1,088
Fire risk 8/10 · Major
- Est. fire insurance / yr
- $659 – $1,223
Heat risk 6/10 · Moderate
- Hot days now (above 98°F)
- 5 days/yr
- Hot days in 30 yrs
- 12 days/yr
Wind risk 1/10 · Minimal
- Chance of severe wind over 30 yrs
- —
Air-quality risk 10/10 · Severe
- Unhealthy air days now
- 25 days/yr
- Unhealthy air days in 30 yrs
- 29 days/yr
Risk factors via First Street. Map © Google.
Why this score? — see what drove the D+ grade
The composite is a weighted blend of 9 inputs, each scored 0–100. Each bar is that input's sub-score; the figure is the points it added to the 100-point composite (weight × sub-score).
- ARV discount +15.0/15.0
- Cash flow +12.7/30.0
- DSCR +3.8/10.0
- 1% rule +3.1/10.0
- Rent growth +2.9/5.0
- Livability +2.8/5.0
- Schools +2.5/10.0
- Condition / age +2.5/5.0
- Appreciation +0.0/10.0
$349,999
🖨 Deal sheet (PDF) 📄 Offer letter ✓ Due diligence
Listing remarks MLS
Just the house you are looking for if you need a lot of room at a little price. This home features 3 bedrooms AND 3 baths. Seperate living and family room. Great corner lot. This home doesn't show like your typical REO. It's clean and the yards are manicured. Take advantage of this great buy before it's too late.
Key facts
- Indoor laundry
- Corner lot
- 7,005 sq ft lot
Tags
Property features AI
Finance
- Other: Negotiable home protection plan; Zoning: PDRPD15u
- HOA & community: No HOA
Exterior
- Parking: Attached 2-car garage
- Utilities: Net metered electricity; Public water; Sewer connected; Natural gas available; No solar
- Home design: Single-story ranch/traditional style; Faces unspecified
- Construction: Stucco and wood construction; Shingle roof; Concrete slab foundation; Built on one level
- Exterior features: Front lawn; Block and wood fencing; Corner lot; Public streets
Interior
- Flooring: Carpet; Tile
- Bathrooms: Three full bathrooms
- Heating & cooling: Central heating (gas); Central air
- Interior features: Dining area in the kitchen; Family room with fireplace
- Laundry & utility: In-unit laundry area
Neighborhood map
What this means for you Summary
Snapshot
- This is a 2-bed/3.0-bath single-family listed at $350k.
Deal economics
- At list price, monthly cash flow is $-37 ($-448/yr) — negative.
- To cash-flow at today's rent, offer at most $343k (1.9% below list).
- To meet the 1% rule (rent ≥ 1% of price), the offer needs to be $284k (18.8% below list).
- Recommended offer: $284k (18.8% below list) — sets the bar for 1% rule.
- Cap rate 6.2% vs local median 4.5% in Palmdale — top-decile yield for the area; either an underpriced asset or a hidden risk that comps aren't pricing in. Stress-test before assuming the spread holds.
Location & tenants
- Location reads 55/100 on livability (#861 in CA) — a working-class tenant base; expect higher turnover. Strengths: housing A+; Watch: crime F, amenities F, cost of living F.
- Palmdale Elementary (suburban): math 20% / reading 31% proficiency, ranked #1,147 of 1,400 in CA (top 82%) — low school quality limits family demand, transient renter base, plan for 1-2y turnover; 69% free/reduced lunch — lower-income household profile, screen leases tightly.
- Zoned schools: Palmdale Learning Plaza (783 students, 80% FRL); Desert Willow Fine Arts Sci And Tech Magnet Acad (974 students, 88% FRL); Palmdale High (2,443 students, 74% FRL).
- Market conditions: Rents rising (+1.8%/yr); 410 active listings in the ZIP; 5 comparable units currently listed for rent nearby; rentals leasing fast (median 0d on market — plan ~1-2 weeks tenant-placement turnaround); 19,697 units permitted in Los Angeles County in 2024 (9,426 in 5+ unit buildings).
- At $2,841/mo this rent would consume 55% of the median local household income ($62k/yr) (locally 4384% of renters already pay >50% of income on rent) — very limited rent-growth headroom before tenants either downsize or default.
Forward outlook
- Local home prices are declining (-3.0%/yr); year-one equity from $2k of loan paydown is wiped out by about $10k of value loss. Plan a longer hold.
- Los Angeles County population projected at +9% by 2050 — modest demand growth; plan on rents tracking national, not racing it.
Negotiation context
- Only 5 days on market — expect competitive offers; lowballing is unlikely to land.
- 4 sale attempts since 24y ago with the ask held roughly flat each time — persistent listings suggest the price (not the market) is what's stuck; bring a comps-based counter.
- Current owner paid $148k; list at $350k implies a 136% gain — meaningful room to come down on a strong offer.
Risks & watch-outs
- Climate carrying-cost: severe wildfire risk; extreme-heat days projected 5→12/yr by 2055 (HVAC capex compounding) — expect insurance premiums to compound above CPI over the hold.
Questions for the listing agent
- What do current leases actually rent for vs. the listed asking? Can we see a recent rent roll and the last 12 months of T-12 income?
- Is there a deadline driving the sale (1031 exchange, divorce, estate, relocation)? That informs how much negotiation room exists.
- Schools are F-rated, which usually means shorter tenancies and higher turnover. Who's the typical renter profile here, and what's been the actual vacancy rate?
- Crime grade is F in this area — have there been break-ins, vandalism, or insurance claims at this property in the last 3 years? What carrier currently insures it and at what premium?
- The area grade is low — what's the realistic commute time and amenity access for the typical tenant pool here? Any planned neighborhood developments (good or bad) we should know about?
- What's the average days-on-market for RENTAL listings here right now (not sales)? A rising rental-DOM trend means longer vacancies and softer asking-rent achievability than the comps imply.
- What's the recent tenant-quality profile in this submarket — average credit score on applications, eviction rate, late-payment / NSF rate, and stable-employment percentage? A property-management company in the area should have these aggregated.
- How much new for-sale + rental construction is in the pipeline within 1–3 miles? Heavy new supply typically softens prices + rents 12–24 months out; constrained supply supports both.
Investment metrics
- 1% rule
- 0.81% ✗
- Cap rate
- 6.16%
- Cash-on-cash
- -0.46%
- DSCR
- 0.98
- GRM
- 10.3
CMA / ARV
- ARV (on-the-fly)
- $516,496
- Comps found
- 12
Show comp detail 12 sales within ~0.75 mi
| Address | Dist | Beds/Ba | Sqft | Sold | Price | $/sf | Match |
|---|---|---|---|---|---|---|---|
| 37007 Vía Del Rio | 0.00mi | 3/3.0 (+1) | 1,699 (0%) | 1mo | $346,000 | $204 | 94 |
| 36804 Apache Plume Dr | 0.58mi | 3/3.0 (+1) | 1,805 (+6%) | 1mo | $450,000 | $249 | 57 |
| 3510 Southview Ct | 0.32mi | 3/2.0 (+1) | 1,564 (-8%) | 11mo | $505,000 | $323 | 54 |
| 2733 Coria Pl | 0.42mi | 3/2.0 (+1) | 1,506 (-11%) | 1mo | $479,990 | $319 | 52 |
| 36718 Petra Dr | 0.47mi | 3/2.0 (+1) | 1,506 (-11%) | 2mo | $448,000 | $297 | 49 |
| 36647 Apache Plume Dr | 0.70mi | 3/3.0 (+1) | 1,765 (+4%) | 9mo | $496,000 | $281 | 48 |
| 3531 Southview Ct | 0.37mi | 3/2.0 (+1) | 1,451 (-15%) | 3mo | $490,000 | $338 | 47 |
| 2553 Desert Oak Dr | 0.63mi | 3/3.0 (+1) | 1,805 (+6%) | 10mo | $520,000 | $288 | 47 |
| 2624 Summer Lilac Dr | 0.69mi | 3/3.0 (+1) | 1,805 (+6%) | 11mo | $519,990 | $288 | 43 |
| 36956 Desert Willow Dr | 0.74mi | 3/3.0 (+1) | 1,805 (+6%) | 9mo | $555,000 | $307 | 43 |
| 36521 Silverado Dr | 0.71mi | 3/2.0 (+1) | 1,554 (-8%) | 5mo | $500,000 | $322 | 40 |
| 36536 Jenna Ln | 0.65mi | 3/2.5 (+1) | 1,876 (+10%) | 11mo | $570,000 | $304 | 36 |
Match score weights: distance 35% · size 25% · config 20% · recency 20%. Top-matched comps best support the ARV.
Projected returns pro-forma
-3.0% appreciation · 1.76% rent growth · sell at horizon
- IRR
- -18.4%
- Equity multiple
- 0.36×
- Total profit
- $-62,636
- Equity at exit
- $52,186
- IRR
- -13.2%
- Equity multiple
- 0.27×
- Total profit
- $-71,788
- Equity at exit
- $30,262
Cash invested: $98,000 (down + closing). Projections, not guarantees.
Landlord ↔ Tenant lean methodology
- Overall (STATE)
- 18 Strongly Tenant-Friendly
- State California
- 18 Strongly Tenant-Friendly · D+13
- County
- — inherits STATE
- City
- — inherits STATE
ZIP-level market 93550
- Home prices YoY
- -29.4%
- Rents YoY
- 1.8%
- Active inventory
- 410
- Price-to-rent
- 10.3×
Monthly cashflow live
- Estimated rent
- $2,841 high interval (Pro) →
- Mortgage (P&I)
- −$1,835
- Tax from tax record
- −$301 /mo · $3,607/yr
- Insurance
- −$146
- HOA
- −$0
- Vacancy / Maint / Mgmt
- −$597
- Net cashflow
- $-37
Break-even live
Sensitivity live
| Price | -10% $161 | -5% $62 | +0% $-37 | +5% $-136 | +10% $-235 |
|---|---|---|---|---|---|
| Rent | -10% $-262 | -5% $-150 | +0% $-37 | +5% $75 | +10% $187 |
| Rate | -1.0pp $139 | -0.5pp $52 | base $-37 | +0.5pp $-128 | +1.0pp $-220 |
UW: 25.0% down · 7.5% · 30yr · 1.5% tax · 5.0% vac · 8.0% maint · 8.0% mgmt
Financing live
Cash to close
- Down payment
- $87,500
- Closing costs
- $10,500
- Reserves months
- —
- Total cash needed
- —
Loan-product check · same deal, 3 products live
Conventional
25% down · 7.5% · 30yr
- Down + closing
- —
- Monthly P&I
- —
- Monthly cashflow
- —
- DSCR
- —
- Eligible?
- —
Personal DTI + credit; lowest rate.
DSCR
20% down · 8.5% · 30yr
- Down + closing
- —
- Monthly P&I
- —
- Monthly cashflow
- —
- DSCR
- —
- Eligible?
- —
No personal income docs; deal must DSCR.
Hard money
10% down · 12.0% · 12mo
- Down + closing
- —
- Monthly P&I
- —
- Monthly cashflow
- —
- DSCR
- —
- Eligible?
- —
Short-term bridge; refi at stabilization.
Rent comps 5 comps
| Address | Beds | Baths | Sqft | Rent | $/sqft | DOM | Units | Dist |
|---|---|---|---|---|---|---|---|---|
| 36741 30th St E Palmdale, CA | 3.0 | 2.0 | 1600 | $2,995 | $1.87 | 0d | 1 | 0.34mi |
| 37347 Waterman Ave Palmdale, CA | 3.0 | 2.0 | 1383 | $3,350 | $2.42 | 0d | 1 | 0.62mi |
| 36521 Windtree Cir Palmdale, CA | 3.0 | 2.0 | 1371 | $3,000 | $2.19 | 24d | 1 | 0.97mi |
| 36453 Clearwood Ct Palmdale, CA | 3.0 | 2.5 | 1651 | $2,850 | $1.73 | 0d | 1 | 0.98mi |
| 37333 Scranton Ct Palmdale, CA | 3.0 | 2.0 | 1756 | $2,850 | $1.62 | 26d | 1 | 1.09mi |
Listing history 10 events
-
2026-05-14status Pending
-
2026-05-08$349,999 Active
-
2008-07-08soldstatus $148,100 314-char remark
Show marketing remark (314 chars)
Just the house you are looking for if you need a lot of room at a little price. This home features 3 bedrooms AND 3 baths. Seperate living and family room. Great corner lot. This home doesn't show like your typical REO. It's clean and the yards are manicured. Take advantage of this great buy before it's too late.
-
2008-04-29$144,900 314-char remark
Show marketing remark (314 chars)
Just the house you are looking for if you need a lot of room at a little price. This home features 3 bedrooms AND 3 baths. Seperate living and family room. Great corner lot. This home doesn't show like your typical REO. It's clean and the yards are manicured. Take advantage of this great buy before it's too late.
-
2004-05-11soldstatus $217,500 196-char remark
Show marketing remark (196 chars)
Spacious 1,699 sq. ft. home. Built in 1986. 3 br, 3 ba. plus bonus room. Nice and clean, in very good contitions, fire place, block fence. Walking distance to elementary school. Motivated sellers.
-
2004-05-11soldstatus $217,500
Show marketing remark (196 chars)
Spacious 1,699 sq. ft. home. Built in 1986. 3 br, 3 ba. plus bonus room. Nice and clean, in very good contitions, fire place, block fence. Walking distance to elementary school. Motivated sellers.
-
2004-02-23$217,950 196-char remark
Show marketing remark (196 chars)
Spacious 1,699 sq. ft. home. Built in 1986. 3 br, 3 ba. plus bonus room. Nice and clean, in very good contitions, fire place, block fence. Walking distance to elementary school. Motivated sellers.
-
2002-12-06soldstatus $142,000
-
2002-12-06soldstatus $142,000
-
2002-08-02$145,000
ⓘ Source: listings_history table (triggers on properties + properties_extension) + one-shot
backfill from property_details.listing_events for pre-trigger history.
Tax reassessment forecast CA · Resets to sale price
- Current annual tax
- $3,607 · $301/mo
- Projected year-2 tax
- $3,607 · $301/mo
- Expected delta
- $0/yr ($0/mo · 0.0%)
ⓘ Screening estimate from a state-policy table — verify with the county assessor before closing.
Climate risk First Street
- Flood 1/10 Low FEMA zone X (unshaded) · 0% chance over 30 yrs
- Wildfire 8/10 Severe
- Heat 6/10 Major 5 d/yr ≥98°F today · 12 d/yr by 30 yrs out
- Wind 1/10 Low
- Air quality 10/10 Extreme 25 unhealthy d/yr today · 29 by 30 yrs out
Nearby sold comps map
Loading sold comps map…
Walkable amenities ~0.75 mi
Loading nearby amenities…
Taxation est. · year 1
- Rental income
- $34,093
- − Mortgage interest
- −$19,605
- − Property taxes
- −$3,607
- − Insurance
- −$1,750
- − Repairs & maintenance
- −$2,727
- − Management
- −$2,727
- − Depreciation
- −$10,182
- Taxable loss
- −$6,505
- Est. tax savings @ 24.0%
- +$1,561
- After-tax cash flow
- $1,113/yr
For passive investors: Depreciation is non-cash, so a rental often shows a tax loss while cash-flowing — sheltering income. Rental losses are passive: they offset passive income freely, and up to $25,000/yr can offset ordinary (W-2) income if you actively participate and your MAGI is under $100k (phasing out to $0 by $150k); unused losses carry forward. On sale, claimed depreciation is recaptured at up to 25%, and gains may owe capital-gains tax (a 1031 exchange can defer both). Figures are a year-1 estimate at your 24.0% rate — not tax advice; consult a CPA.
Schools (NCES district)
- District
- Palmdale Elementary
- NCES district ID
- 0629580
- Math proficiency
- 20% ▲ 1.00%
- Reading proficiency
- 31% ▲ 1.00%
- Median HH income
- $48,652
- Composite
- 25.34/100
- National rank
- #12888
- State rank
- #1147 of 1400 in CA
Livability — Palmdale
- Score
- 55/100
- State rank
- #861
- US rank
- #23501
Category grades
Schools grade is shown separately in the Schools card above.
Census & demographics
- Census place
- Palmdale, CA
- County
- Los Angeles County · 9,444,647 people
- City population
- 177,644
- Metro
- Los Angeles-Long Beach-Anaheim, CA
- Population (ZIP)
- 80,645
- Household income
- $62,078
- Rent vs Own
- Severe rent burden
- 4384.0
Population outlook (Los Angeles County) Hauer SSP2
- Today (2025)
- 10,940,515 people
- By 2030
- 11,256,481 · +2.9%
- By 2040
- 11,729,929 · +7.2%
- By 2050
- 11,948,407 · +9.2%
- By 2075
- 11,818,114 · +8.0%
- By 2100
- 10,842,928 · -0.9%
Race, ethnicity, and origin ACS 2023
- Neighborhood character
- Predominantly Hispanic (69%)
- Race & ethnicity
- Hispanic / Latino 69% Two or more races 15% Black 14% White 12% Asian 3% Native American 2%
- Hispanic origin (detail)
- Mexican 52%
- Foreign-born
- 26% · Canada
- Languages at home
- 42% English-only · Spanish 55% Tagalog/Filipino 1% Other Asian/Pacific 1%
Political lean MEDSL · Los Angeles
- 2024 margin
- Solid D (+32.9) · D 64.8% · R 31.9% · Other 3.3%
- 2008→2024 swing
- -7.4pp toward R · 2008: 40.4pp · 2024: 32.9pp
- All cycles
- 2024: D+32.9 2020: D+44.2 2016: D+48.0 2012: D+40.0 2008: D+40.4
Not yet ingested
- Civics
- —
Market trends
- HPI YoY
- ▼ -183.38%
- Current HPI
- 440.8844
- Rent YoY
- ▲ 1.76%
- Metro
- Los Angeles-Long Beach-Anaheim, CA
- State GDP YoY
- ▲ 3.21%
- F500 in state
- 116
Industry mix (Fortune 500 HQ in CA)
| Industry | F500 HQs | Revenue |
|---|---|---|
| Technology | 27 | $1,492B |
|
||
| Financial Services | 3 | $174B |
|
||
| Retail | 3 | $44B |
|
||
| Insurance | 3 | $26B |
|
||
| Media / Entertainment | 2 | $115B |
|
||
| Pharmaceuticals / Biotech | 2 | $62B |
|
||
Price history
+141.4% since first listed10 events — show timeline
- 2026-05-14 Pending — AVMLS
- 2026-05-08 Listed $349,999 AVMLS
- 2008-07-08 Sold (MLS) $148,100 AVMLS
- 2008-04-29 Listed $144,900 AVMLS
- 2004-05-11 Sold (Public Records) $217,500 Public Records
- 2004-05-11 Sold (MLS) $217,500 AVMLS
- 2004-02-23 Listed $217,950 AVMLS
- 2002-12-06 Sold (Public Records) $142,000 Public Records
- 2002-12-06 Sold (MLS) $142,000 AVMLS
- 2002-08-02 Listed $145,000 AVMLS
Property tax history
+0.7%/yrLatest (2025): $3,607 · +7.4% YoY. Source: county tax records.
Cash-flow waterfall
monthlySold comps — $/sqft
last 12 mo · ≤1 miLoading sold comps…