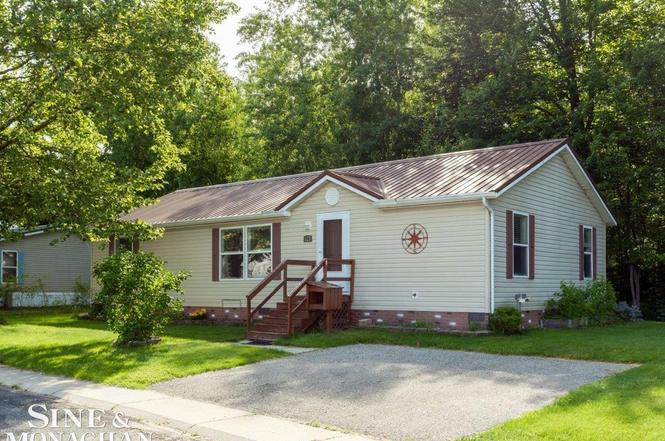
127 Hidden Springs St · Fort Gratiot, MI
Flood risk No data
- FEMA flood zone
- —
- Chance of flooding over 30 yrs
- —
- Est. flood insurance / yr
- —
Fire risk No data
- Est. fire insurance / yr
- —
Heat risk No data
- Hot days now (above threshold)
- —
- Hot days in 30 yrs
- —
Wind risk No data
- Chance of severe wind over 30 yrs
- —
Air-quality risk No data
- Unhealthy air days now
- —
- Unhealthy air days in 30 yrs
- —
Risk factors via First Street. Map © Google.
Why this score? — see what drove the B- grade
The composite is a weighted blend of 9 inputs, each scored 0–100. Each bar is that input's sub-score; the figure is the points it added to the 100-point composite (weight × sub-score).
- Cash flow +30.0/30.0
- DSCR +10.0/10.0
- 1% rule +9.2/10.0
- ARV discount +7.5/15.0
- Rent growth +2.5/5.0
- Schools +2.5/10.0
- Livability +2.5/5.0
- Condition / age +2.5/5.0
- Appreciation +0.0/10.0
$82,000
🖨 Deal sheet 📄 Offer letter ✓ Due diligence
Listing remarks MLS
Enjoy comfortable living in this well-maintained 3-bedroom, 2-bath home featuring numerous updates and a desirable location within the community. Recent improvements include a newer metal roof, furnace, and hot water heater, providing added peace of mind. The kitchen was updated in 2023 and offers a fresh, functional space for everyday living and entertaining. Situated toward the back of the park, this home enjoys a more private setting and backs to a wooded area, creating a scenic natural backdrop. The thoughtful floor plan provides comfortable living spaces, while the updated features make this home move-in ready. Conveniently located near shopping, dining, schools, and major commuting routes, this property offers an excellent combination of comfort, convenience, and value. Schedule your showing today and see all this updated home has to offer.
Key facts
- Updated kitchen
- Private setting
- Newer metal roof
Tags
Property features AI
Finance
- HOA & community: Brandymore Pines association (monthly fee of $455); Association includes trash removal; Community sidewalks
Exterior
- Utilities: Public water; Public sanitary sewer; Natural gas
- Home design: Single-story manufactured home (manufactured after 1976); Built in 2002
- Construction: Vinyl siding exterior; Piers foundation
- Exterior features: Vinyl siding; Road frontage; Pets allowed (contact for restrictions)
Interior
- Kitchen: Kitchen on the entry level (approx. 14 x 12); Dishwasher; Microwave; Range/Oven; Refrigerator
- Bedrooms: Three bedrooms on the entry level (roughly 13 x 13, 9 x 10, and ~13)
- Bathrooms: Two full bathrooms on the entry level
- Heating & cooling: Forced air heating; Natural gas fuel
- Interior features: Open living area with 24 x 17 living room
- Laundry & utility: Washer and Dryer; Laundry room on the entry level (approx. 13 x 5)
Neighborhood map
What this means for you Summary
Snapshot
- This is a 3-bed/2.0-bath other listed at $82k.
Deal economics
- At list price, monthly cash flow is $354 ($4k/yr) — positive.
- The deal already cash-flows at list — no discount required.
- Meets the 1% rule at list price ($1k rent vs $82k).
Location & tenants
- Location reads: area grade B — affects rentability + tenant quality, not the cash-flow math above.
- Port Huron Area School District (suburban): math 23% / reading 37% proficiency, ranked #368 of 540 in MI (top 68%) — families likely to look elsewhere, expect single-tenant / working-renter base with shorter leases.
- Market conditions: 101 active listings in the ZIP; 232 units permitted in St. Clair County in 2024 (0 in 5+ unit buildings).
Forward outlook
- Local home prices are declining (-3.0%/yr); year-one equity from $567 of loan paydown is wiped out by about $2k of value loss. Plan a longer hold.
- St. Clair County population projected at -20% by 2050 — secular population decline; favor cash flow + early exit over multi-decade hold.
- At projected returns (-3.0% appreciation + 3.0% rent growth), your $23k cash investment doubles in ~7 years — after that, you're playing with house money.
Negotiation context
- Only 3 days on market — expect competitive offers; lowballing is unlikely to land.
- 6 sale attempts since 3y ago with the ask held roughly flat each time — persistent listings suggest the price (not the market) is what's stuck; bring a comps-based counter.
Questions for the listing agent
- Is there a deadline driving the sale (1031 exchange, divorce, estate, relocation)? That informs how much negotiation room exists.
- What's the average days-on-market for RENTAL listings here right now (not sales)? A rising rental-DOM trend means longer vacancies and softer asking-rent achievability than the comps imply.
- What's the recent tenant-quality profile in this submarket — average credit score on applications, eviction rate, late-payment / NSF rate, and stable-employment percentage? A property-management company in the area should have these aggregated.
- How much new for-sale + rental construction is in the pipeline within 1–3 miles? Heavy new supply typically softens prices + rents 12–24 months out; constrained supply supports both.
Investment metrics
- 1% rule
- 1.42% ✓
- Cap rate
- 11.47%
- Cash-on-cash
- 18.49%
- DSCR
- 1.82
- GRM
- 5.9
CMA / ARV
No comps found within radius.
Projected returns pro-forma
-3.0% appreciation · 3.0% rent growth · sell at horizon
- IRR
- 10.2%
- Equity multiple
- 1.40×
- Total profit
- $9,259
- Equity at exit
- $12,226
- IRR
- 19.3%
- Equity multiple
- 2.62×
- Total profit
- $37,143
- Equity at exit
- $7,090
Cash invested: $22,960 (down + closing). Projections, not guarantees.
Landlord ↔ Tenant lean methodology
- Overall (STATE)
- 62 Landlord-Friendly
- State Michigan
- 62 Landlord-Friendly · EVEN
- County
- — inherits STATE
- City
- — inherits STATE
ZIP-level market 48059
- Active inventory
- 101
- Price-to-rent
- 5.9×
Monthly cashflow live
- Estimated rent
- $1,165 medium interval (Pro) →
- Mortgage (P&I)
- −$430
- Tax est. 1.5%
- −$102 /mo · $1,230/yr
- Insurance
- −$34
- HOA
- −$0
- Vacancy / Maint / Mgmt
- −$245
- Net cashflow
- $354
Break-even live
UW: 25.0% down · 7.5% · 30yr · 1.5% tax · 5.0% vac · 8.0% maint · 8.0% mgmt
Financing live
Cash to close
- Down payment
- $20,500
- Closing costs
- $2,460
- Reserves months
- —
- Total cash needed
- —
Loan-product check · same deal, 3 products live
Conventional
25% down · 7.5% · 30yr
- Down + closing
- —
- Monthly P&I
- —
- Monthly cashflow
- —
- DSCR
- —
- Eligible?
- —
Personal DTI + credit; lowest rate.
DSCR
20% down · 8.5% · 30yr
- Down + closing
- —
- Monthly P&I
- —
- Monthly cashflow
- —
- DSCR
- —
- Eligible?
- —
No personal income docs; deal must DSCR.
Hard money
10% down · 12.0% · 12mo
- Down + closing
- —
- Monthly P&I
- —
- Monthly cashflow
- —
- DSCR
- —
- Eligible?
- —
Short-term bridge; refi at stabilization.
Listing history 6 events
-
2026-06-18days on market $82,000 Active 3 DOM
-
2026-06-17days on market $82,000 Active 2 DOM
-
2026-06-16$82,000 Active 1 DOM
-
2026-06-15days on market $82,000 Active 1 DOM
-
2026-06-15remarks 699-char remark
-
2026-06-15$82,000 Active 2 DOM
ⓘ Source: listings_history table (triggers on properties + properties_extension) + one-shot
backfill from property_details.listing_events for pre-trigger history.
Nearby sold comps map
Loading sold comps map…
Walkable amenities ~0.75 mi
Loading nearby amenities…
Taxation est. · year 1
- Rental income
- $13,981
- − Mortgage interest
- −$4,593
- − Property taxes
- −$1,230
- − Insurance
- −$410
- − Repairs & maintenance
- −$1,118
- − Management
- −$1,118
- − Depreciation
- −$2,385
- Taxable income
- $3,125
- Est. tax owed @ 24.0%
- −$750
- After-tax cash flow
- $3,495/yr
For passive investors: Depreciation is non-cash, so a rental often shows a tax loss while cash-flowing — sheltering income. Rental losses are passive: they offset passive income freely, and up to $25,000/yr can offset ordinary (W-2) income if you actively participate and your MAGI is under $100k (phasing out to $0 by $150k); unused losses carry forward. On sale, claimed depreciation is recaptured at up to 25%, and gains may owe capital-gains tax (a 1031 exchange can defer both). Figures are a year-1 estimate at your 24.0% rate — not tax advice; consult a CPA.
Schools (NCES district)
- District
- Port Huron Area School District
- NCES district ID
- 2628830
- Math proficiency
- 23% ▼ -5.00%
- Reading proficiency
- 37% ▼ -2.00%
- Median HH income
- $42,093
- Composite
- 25.4/100
- National rank
- #7462
- State rank
- #368 of 540 in MI
Livability — Fort Gratiot
No livability data for this city. (Only ~50 U.S. cities are tracked.)
Census & demographics
- Population (ZIP)
- 15,371
Population outlook (St. Clair County) Hauer SSP2
- Today (2025)
- 154,587 people
- By 2030
- 150,031 · -2.9%
- By 2040
- 138,177 · -10.6%
- By 2050
- 124,390 · -19.5%
- By 2075
- 95,825 · -38.0%
- By 2100
- 68,672 · -55.6%
Race, ethnicity, and origin ACS 2023
- Neighborhood character
- Predominantly White (90%)
- Race & ethnicity
- White 90% Hispanic / Latino 5% Two or more races 3% Black 1%
- Hispanic origin (detail)
- Mexican 4%
- Common ancestry
- Romanian 11% Lithuanian 5% Slovak 4%
- Foreign-born
- 2% · Canada
- Languages at home
- 98% English-only · Spanish 1%
Political lean MEDSL · St. Clair
- 2024 margin
- Solid R (+34.6) · D 32.0% · R 66.6% · Other 1.4%
- 2008→2024 swing
- -37.3pp toward R · 2008: 2.6pp · 2024: -34.6pp
- All cycles
- 2024: R+34.6 2020: R+30.2 2016: R+31.4 2012: R+7.1 2008: D+2.6
Not yet ingested
- Civics
- —
Market trends
- HPI YoY
- ▼ -133.89%
- Current HPI
- 151.0184
- Rent YoY
- —
- Metro
- —
- State GDP YoY
- ▲ 1.37%
- F500 in state
- 28
Industry mix (Fortune 500 HQ in MI)
| Industry | F500 HQs | Revenue |
|---|---|---|
| Automotive Parts | 3 | $48B |
|
||
| Automotive | 2 | $372B |
|
||
| Chemicals | 1 | $45B |
|
||
| Automotive Retail | 1 | $29B |
|
||
| Healthcare / Medical Devices | 1 | $23B |
|
||
| Automotive Technology | 1 | $20B |
|
||
Price history
+2.6% since first listed13 events — show timeline
- 2026-06-13 Listed $82,000 REALCOMP
- 2026-06-13 Listed $82,000 MiRealSource-MiMLS
- 2024-01-09 Sold (MLS) $85,000 REALCOMP
- 2024-01-09 Sold (MLS) $85,000 MiRealSource-MiMLS
- 2023-12-18 Pending — MiRealSource-MiMLS
- 2023-12-18 Listing Removed — REALCOMP
- 2023-12-18 Listing Removed — MiRealSource-MiMLS
- 2023-11-28 Listed $79,900 MiRealSource-MiMLS
- 2023-11-28 Listed $79,900 MiRealSource-MiMLS
- 2023-11-27 Coming Soon — MiRealSource-MiMLS
- 2023-11-27 Listed $79,900 REALCOMP
- 2023-11-26 Coming Soon $79,900 MiRealSource-MiMLS
- 2023-11-26 Listed $79,900 REALCOMP
Property tax history
+4.9%/yrLatest (2025): $20 · +98.6% YoY. Source: county tax records.
Cash-flow waterfall
monthlySold comps — $/sqft
last 12 mo · ≤1 miLoading sold comps…