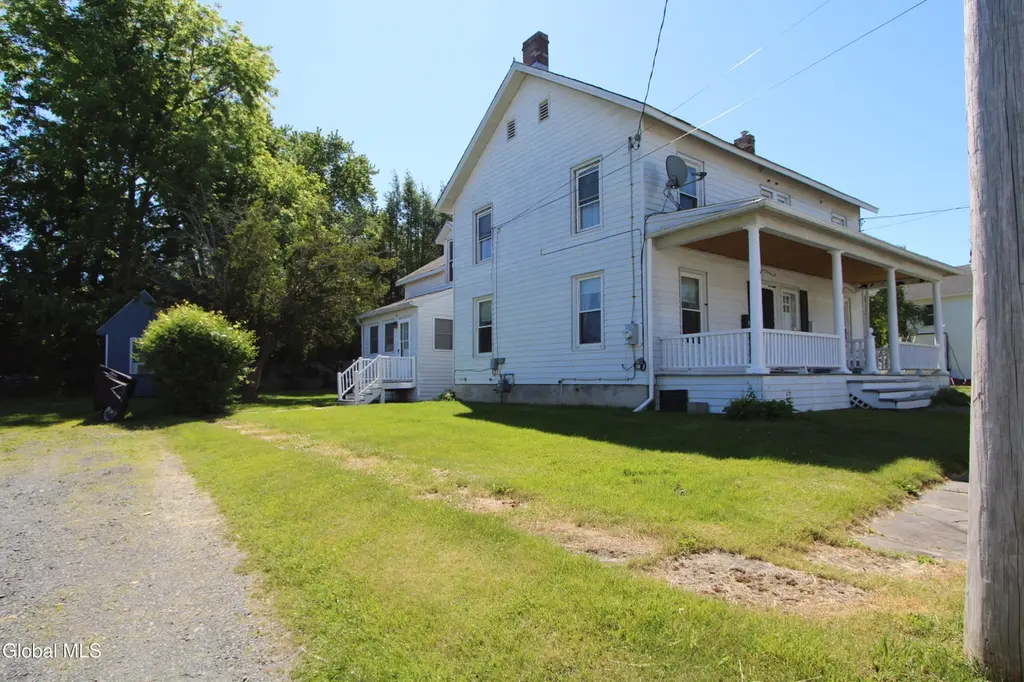
5 Hudson St · Castleton-on-Hudson, NY
Flood risk 1/10 · Minimal
- FEMA flood zone
- X
- Chance of flooding over 30 yrs
- 0.0%
- Est. flood insurance / yr
- $473 – $860
Fire risk 3/10 · Minor
- Est. fire insurance / yr
- $691 – $1,283
Heat risk 4/10 · Minor
- Hot days now (above 97°F)
- 7 days/yr
- Hot days in 30 yrs
- 16 days/yr
Wind risk 3/10 · Minor
- Chance of severe wind over 30 yrs
- 7.0%
Air-quality risk 2/10 · Minimal
- Unhealthy air days now
- 0 days/yr
- Unhealthy air days in 30 yrs
- 1 days/yr
Risk factors via First Street. Map © Google.
Why this score? — see what drove the C- grade
The composite is a weighted blend of 9 inputs, each scored 0–100. Each bar is that input's sub-score; the figure is the points it added to the 100-point composite (weight × sub-score).
- Cash flow +20.7/30.0
- ARV discount +7.5/15.0
- DSCR +6.6/10.0
- 1% rule +5.3/10.0
- Schools +5.3/10.0
- Rent growth +2.5/5.0
- Livability +2.5/5.0
- Condition / age +2.5/5.0
- Appreciation +0.0/10.0
$222,000
🖨 Deal sheet (PDF) 📄 Offer letter ✓ Due diligence
Listing remarks MLS
Right side Townhouse for Sale ONLY. Nice size rooms. Bank says sell! Perfect for 1st time buyer. Enclosed porch, hardwood floors, new appliances. Good Condition
Key facts
- Partially fenced
- Laundry room
- Eat in kitchen
Tags
Property features AI
Exterior
- Parking: Two paved driveway parking spaces
- Security: Smoke detectors; Carbon monoxide detectors
- Utilities: Public water; Public sewer; Circuit breaker electric; Cable available
- Home design: Townhouse; Entry includes porch; Shingle and other roofing
- Construction: Aluminum siding; Brick and stone foundation
- Exterior features: Side porch and front porch; Patio/porch area; Paved driveway and drive-paved exterior; Outdoor lighting; Shed/storage
Interior
- Kitchen: Gas oven; Range; Refrigerator
- Bedrooms: Three bedrooms on the second level
- Flooring: Wood; Hardwood; Linoleum
- Bathrooms: One full bathroom on the second level; One half bathroom on the first level
- Heating & cooling: Forced air heating; Natural gas heating
- Interior features: High speed internet; Storm doors; Double-pane windows
- Laundry & utility: Washer/dryer (washer hookup and electric dryer hookup); Washer hookup in bathroom; Main level laundry access
Neighborhood map
What this means for you Summary
Snapshot
- This is a 3-bed/1.5-bath townhouse listed at $222k.
Deal economics
- At list price, monthly cash flow is $302 ($4k/yr) — positive.
- The deal already cash-flows at list — no discount required.
- Meets the 1% rule at list price ($2k rent vs $222k).
- Recommended offer: $219k (1.5% below list) — sets the bar for market timing.
- Cap rate 7.9% vs local median 3.5% in Castleton-on-Hudson — top-decile yield for the area; either an underpriced asset or a hidden risk that comps aren't pricing in. Stress-test before assuming the spread holds.
Location & tenants
- Location reads: area grade C — affects rentability + tenant quality, not the cash-flow math above.
- Schodack Central School District (rural): math 59% / reading 60% proficiency, ranked #216 of 590 in NY (top 37%) — acceptable for families but not a draw, mixed tenant base, ~2y average lease; only 13% free/reduced lunch — higher-income household profile.
- Market conditions: 60 active listings in the ZIP; 1 comparable units currently listed for rent nearby; 405 units permitted in Rensselaer County in 2024 (224 in 5+ unit buildings).
Forward outlook
- Local home prices are declining (-3.0%/yr); year-one equity from $2k of loan paydown is wiped out by about $7k of value loss. Plan a longer hold.
- Rensselaer County population projected to shrink 6% by 2050 — rents likely to lag national; underwrite the cash flow, not the appreciation.
Negotiation context
- It's been on market 15 days — a 2% lower offer ($219k) is reasonable based on typical stale-listing flexibility.
- 6 sale attempts since 20y ago with the ask held roughly flat each time — persistent listings suggest the price (not the market) is what's stuck; bring a comps-based counter.
- Current owner paid $40k; list at $222k implies a 455% gain — meaningful room to come down on a strong offer.
Risks & watch-outs
- Watch-outs: built in 1875 — expect roof / HVAC / electrical / plumbing capex.
Questions for the listing agent
- Built in 1875 — when were the roof, HVAC, electrical panel, plumbing, and water heater last replaced?
- Is there a deadline driving the sale (1031 exchange, divorce, estate, relocation)? That informs how much negotiation room exists.
- What's the average days-on-market for RENTAL listings here right now (not sales)? A rising rental-DOM trend means longer vacancies and softer asking-rent achievability than the comps imply.
- What's the recent tenant-quality profile in this submarket — average credit score on applications, eviction rate, late-payment / NSF rate, and stable-employment percentage? A property-management company in the area should have these aggregated.
- How much new for-sale + rental construction is in the pipeline within 1–3 miles? Heavy new supply typically softens prices + rents 12–24 months out; constrained supply supports both.
Investment metrics
- 1% rule
- 1.03% ✓
- Cap rate
- 7.93%
- Cash-on-cash
- 5.83%
- DSCR
- 1.26
- GRM
- 8.1
CMA / ARV
No comps found within radius.
Projected returns pro-forma
-3.0% appreciation · 3.0% rent growth · sell at horizon
- IRR
- -7.3%
- Equity multiple
- 0.73×
- Total profit
- $-16,720
- Equity at exit
- $33,101
- IRR
- 2.3%
- Equity multiple
- 1.17×
- Total profit
- $10,289
- Equity at exit
- $19,195
Cash invested: $62,160 (down + closing). Projections, not guarantees.
Landlord ↔ Tenant lean methodology
- Overall (STATE)
- 15 Strongly Tenant-Friendly
- State New York
- 15 Strongly Tenant-Friendly · D+10
- County
- — inherits STATE
- City
- — inherits STATE
ZIP-level market 12033
- Home prices YoY
- -17.4%
- Active inventory
- 60
- Price-to-rent
- 8.1×
Monthly cashflow live
- Estimated rent
- $2,295 medium interval (Pro) →
- Mortgage (P&I)
- −$1,164
- Tax from tax record
- −$254 /mo · $3,053/yr
- Insurance
- −$92
- HOA
- −$0
- Vacancy / Maint / Mgmt
- −$482
- Net cashflow
- $302
Break-even live
Sensitivity live
| Price | -10% $428 | -5% $365 | +0% $302 | +5% $239 | +10% $176 |
|---|---|---|---|---|---|
| Rent | -10% $121 | -5% $211 | +0% $302 | +5% $393 | +10% $483 |
| Rate | -1.0pp $414 | -0.5pp $358 | base $302 | +0.5pp $244 | +1.0pp $186 |
UW: 25.0% down · 7.5% · 30yr · 1.5% tax · 5.0% vac · 8.0% maint · 8.0% mgmt
Financing live
Cash to close
- Down payment
- $55,500
- Closing costs
- $6,660
- Reserves months
- —
- Total cash needed
- —
Loan-product check · same deal, 3 products live
Conventional
25% down · 7.5% · 30yr
- Down + closing
- —
- Monthly P&I
- —
- Monthly cashflow
- —
- DSCR
- —
- Eligible?
- —
Personal DTI + credit; lowest rate.
DSCR
20% down · 8.5% · 30yr
- Down + closing
- —
- Monthly P&I
- —
- Monthly cashflow
- —
- DSCR
- —
- Eligible?
- —
No personal income docs; deal must DSCR.
Hard money
10% down · 12.0% · 12mo
- Down + closing
- —
- Monthly P&I
- —
- Monthly cashflow
- —
- DSCR
- —
- Eligible?
- —
Short-term bridge; refi at stabilization.
Rent comps 1 comps
| Address | Beds | Baths | Sqft | Rent | $/sqft | DOM | Units | Dist |
|---|---|---|---|---|---|---|---|---|
| 34 Campbell Ave Castleton-On-Hudson, NY | 3.0 | 1.0 | 1200 | $2,295 | $1.91 | 15d | 1 | 0.25mi |
Listing history 13 events
-
2026-06-21days on market $222,000 Active 15 DOM
-
2026-06-18days on market $222,000 Active 13 DOM
-
2026-06-17days on market $222,000 Active 12 DOM
-
2026-06-16days on market $222,000 Active 11 DOM
-
2026-06-15days on market $222,000 Active 10 DOM
-
2026-06-13days on market $222,000 Active 8 DOM
-
2026-06-12days on market $222,000 Active 7 DOM
-
2026-06-09days on market $222,000 Active 4 DOM
-
2026-06-09remarks 699-char remark
-
2026-06-08days on market $222,000 Active 3 DOM
-
2026-06-07days on market $222,000 Active 2 DOM
-
2026-06-07remarks 679-char remark
-
2026-06-07$222,000 Active 1 DOM
ⓘ Source: listings_history table (triggers on properties + properties_extension) + one-shot
backfill from property_details.listing_events for pre-trigger history.
Tax reassessment forecast NY · Partial reset (capped growth)
- Current annual tax
- $3,053 · $254/mo
- Projected year-2 tax
- $3,402 · $284/mo
- Expected delta
- +$350/yr (+$29/mo · 11.5%)
ⓘ Screening estimate from a state-policy table — verify with the county assessor before closing.
Climate risk First Street
- Flood 1/10 Low FEMA zone X · 0% chance over 30 yrs
- Wildfire 3/10 Moderate
- Heat 4/10 Moderate 7 d/yr ≥97°F today · 16 d/yr by 30 yrs out
- Wind 3/10 Moderate 7% chance of damaging wind over 30 yrs
- Air quality 2/10 Low 0 unhealthy d/yr today · 1 by 30 yrs out
Nearby sold comps map
Loading sold comps map…
Walkable amenities ~0.75 mi
Loading nearby amenities…
Taxation est. · year 1
- Rental income
- $27,540
- − Mortgage interest
- −$12,435
- − Property taxes
- −$3,053
- − Insurance
- −$1,110
- − Repairs & maintenance
- −$2,203
- − Management
- −$2,203
- − Depreciation
- −$6,458
- Taxable income
- $77
- Est. tax owed @ 24.0%
- −$19
- After-tax cash flow
- $3,605/yr
For passive investors: Depreciation is non-cash, so a rental often shows a tax loss while cash-flowing — sheltering income. Rental losses are passive: they offset passive income freely, and up to $25,000/yr can offset ordinary (W-2) income if you actively participate and your MAGI is under $100k (phasing out to $0 by $150k); unused losses carry forward. On sale, claimed depreciation is recaptured at up to 25%, and gains may owe capital-gains tax (a 1031 exchange can defer both). Figures are a year-1 estimate at your 24.0% rate — not tax advice; consult a CPA.
Schools (NCES district)
- District
- Schodack Central School District
- NCES district ID
- 3626070
- Math proficiency
- 59% ▼ -7.00%
- Reading proficiency
- 60% ▲ 7.00%
- Median HH income
- $73,695
- Composite
- 52.93/100
- National rank
- #1530
- State rank
- #216 of 590 in NY
Livability — Castleton-on-Hudson
No livability data for this city. (Only ~50 U.S. cities are tracked.)
Census & demographics
- Census place
- Castleton-on-Hudson, NY
- Population (ZIP)
- 7,772
Population outlook (Rensselaer County) Hauer SSP2
- Today (2025)
- 162,400 people
- By 2030
- 161,746 · -0.4%
- By 2040
- 158,095 · -2.7%
- By 2050
- 152,966 · -5.8%
- By 2075
- 140,767 · -13.3%
- By 2100
- 124,727 · -23.2%
Race, ethnicity, and origin ACS 2023
- Neighborhood character
- Predominantly White (89%)
- Race & ethnicity
- White 89% Hispanic / Latino 8% Two or more races 5% Black 2%
- Hispanic origin (detail)
- Mexican 2% Puerto Rican 2% Dominican 2%
- Common ancestry
- Iranian 8% Romanian 7% Lithuanian 5%
- Foreign-born
- 3% · Canada
- Languages at home
- 92% English-only · Spanish 7% German/W. Germanic 1%
Political lean MEDSL · Rensselaer
- 2024 margin
- Toss-up / Even · D 50.7% · R 49.3%
- 2008→2024 swing
- -8.0pp toward R · 2008: 9.3pp · 2024: 1.4pp
- All cycles
- 2024: D+1.4 2020: D+5.6 2016: R+2.9 2012: D+11.8 2008: D+9.3
Not yet ingested
- Civics
- —
Market trends
- HPI YoY
- ▼ -64.57%
- Current HPI
- 306.386
- Rent YoY
- —
- Metro
- —
- State GDP YoY
- ▲ 2.60%
- F500 in state
- 92
Industry mix (Fortune 500 HQ in NY)
| Industry | F500 HQs | Revenue |
|---|---|---|
| Financial Services | 10 | $950B |
|
||
| Consumer Goods | 9 | $162B |
|
||
| Insurance | 4 | $225B |
|
||
| Telecommunications | 2 | $144B |
|
||
| Pharmaceuticals | 2 | $112B |
|
||
| Media / Entertainment | 2 | $69B |
|
||
Price history
+129.1% since first listed14 events — show timeline
- 2026-06-05 Listed $222,000 Global MLS
- 2014-04-04 Sold (MLS) $40,000 Global MLS
- 2014-02-18 Listing Removed — Global MLS
- 2013-09-13 Listed $49,900 Global MLS
- 2013-02-05 Listing Removed — Global MLS
- 2012-05-21 Listed $79,000 Global MLS
- 2011-01-01 Listing Removed — Global MLS
- 2010-10-18 Listing Removed — Global MLS
- 2010-10-18 Listed $124,900 Global MLS
- 2010-07-22 Listed $121,000 Global MLS
- 2006-11-17 Sold (Public Records) $90,000 Public Records
- 2006-11-15 Sold (MLS) $85,000 Global MLS
- 2006-10-03 Listing Removed — Global MLS
- 2006-01-23 Listed $96,900 Global MLS
Property tax history
-0.8%/yrLatest (2025): $3,053 · -16.5% YoY. Source: county tax records.
Cash-flow waterfall
monthlySold comps — $/sqft
last 12 mo · ≤1 miLoading sold comps…