11971 Champions Green Way #501 · Gateway, FL
Flood risk 1/10 · Minimal
- FEMA flood zone
- X (unshaded)
- Chance of flooding over 30 yrs
- 0.0%
- Est. flood insurance / yr
- $507 – $1,088
Fire risk 4/10 · Minor
- Est. fire insurance / yr
- $947 – $1,759
Heat risk 10/10 · Severe
- Hot days now (above 107°F)
- 7 days/yr
- Hot days in 30 yrs
- 29 days/yr
Wind risk 10/10 · Severe
- Chance of severe wind over 30 yrs
- 99.0%
Air-quality risk 2/10 · Minimal
- Unhealthy air days now
- 1 days/yr
- Unhealthy air days in 30 yrs
- 1 days/yr
Risk factors via First Street. Map © Google.
Why this score? — see what drove the D- grade
The composite is a weighted blend of 9 inputs, each scored 0–100. Each bar is that input's sub-score; the figure is the points it added to the 100-point composite (weight × sub-score).
- Cash flow +10.3/30.0
- ARV discount +7.5/15.0
- 1% rule +6.1/10.0
- Schools +4.1/10.0
- Livability +3.5/5.0
- DSCR +3.0/10.0
- Rent growth +2.6/5.0
- Condition / age +2.5/5.0
- Appreciation +0.0/10.0
$269,000
🖨 Deal sheet 📄 Offer letter ✓ Due diligence
Listing remarks MLS
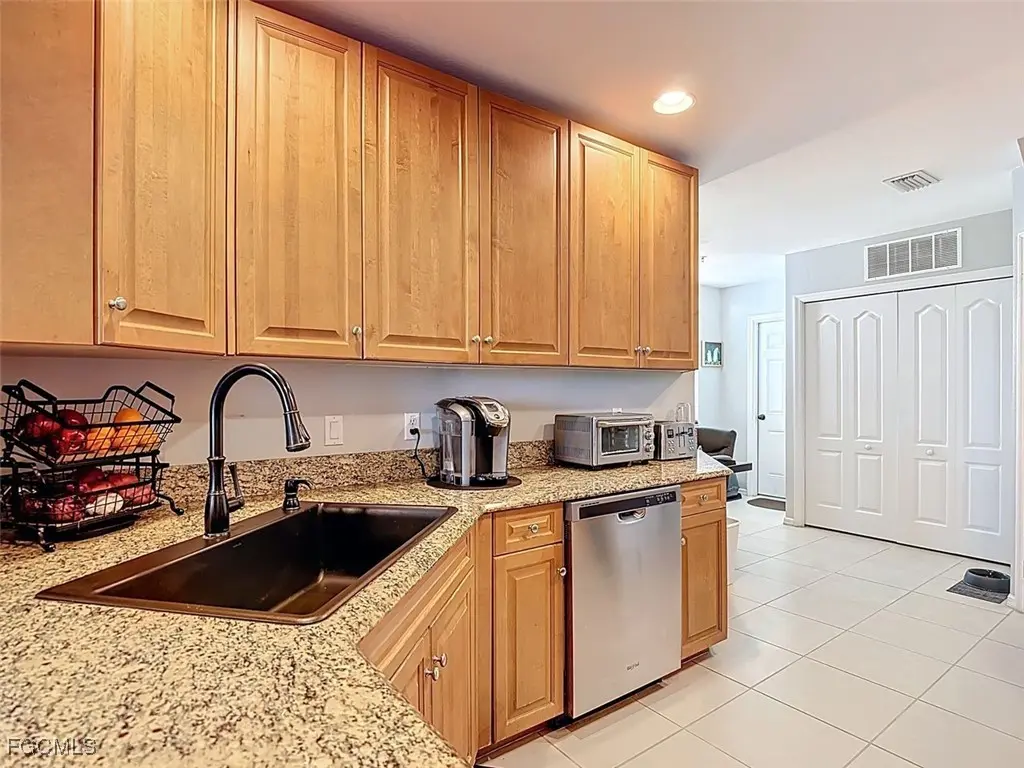
Beautiful Garden Condo on the Golf Course at Gateway Golf & Country Club, a gated community. This Bayhill model with 3BR, 2BA with 1 car garage on the 1st floor -- No stairs.
Key facts
- Laminate flooring
- Upgraded lighting
- First-floor end unit
Tags
Property features AI
Finance
- Financial info: Pets allowed
- HOA & community: Homeowners association (quarterly fee); Association fee includes cable TV, internet, reserve fund, road maintenance, sewer, street lights, security and water; Community amenities: pool, restaurant, sidewalks, tennis courts, management; Community of 8 units; Gated community with street lights
Exterior
- Parking: Assigned parking; Attached garage; Detached garage; Driveway; Paved parking; Two parking spaces (1 covered)
- Security: Gated community with security guard; Security gate; Fire sprinkler system; Smoke detectors; Security included in association
- Utilities: Public water; Public sewer; Cable available
- Home design: Single-story; Entry level: 1; Faces south; Resale property; PUD zoning
- Construction: Built with block, concrete and stucco; Metal roof
- Exterior features: Lanai; Porch; Screened porch; Community pool; Municipal irrigation source; Rectangular lot; North exposure; Public maintained road; Has view
Interior
- Kitchen: Dishwasher; Electric cooktop; Self-cleaning oven; Microwave; Disposal; Pantry; Breakfast bar / eat-in kitchen
- Bedrooms: Bedroom on main level
- Flooring: Laminate; Tile
- Bathrooms: 2 full bathrooms; Dual sinks; Separate shower (shower only)
- Heating & cooling: Central heating (electric); Central air conditioning (electric); Ceiling fan(s)
- Interior features: Furnished; Breakfast bar; Breakfast area; Eat-in kitchen; Living/dining room; Pantry; Dual sinks; Shower only (separate shower); Cable TV available; High-speed internet available; Split bedroom floor plan; Single hung windows; Impact glass windows
- Laundry & utility: Washer included; Inside laundry
Neighborhood map
What this means for you Summary
Snapshot
- This is a 3-bed/2.0-bath condo listed at $269k.
Deal economics
- At list price, monthly cash flow is $-148 ($-2k/yr) — negative.
- To cash-flow at today's rent, offer at most $243k (9.7% below list).
- Meets the 1% rule at list price ($3k rent vs $269k).
- Recommended offer: $243k (9.7% below list) — sets the bar for cash-flow.
- Cap rate 5.6% vs local median 3.5% in Gateway — top-decile yield for the area; either an underpriced asset or a hidden risk that comps aren't pricing in. Stress-test before assuming the spread holds.
Location & tenants
- Location reads 69/100 on livability (#477 in FL) — a middle-class / working-renter tenant base. Strengths: crime A+, employment A+, housing A+; Watch: cost of living C-, amenities F, commute F.
- Lee (suburban): math 47% / reading 50% proficiency, ranked #42 of 73 in FL (top 58%) — families likely to look elsewhere, expect single-tenant / working-renter base with shorter leases.
- Market conditions: Rents flat; 811 active listings in the ZIP; 40 comparable units currently listed for rent nearby; rentals at typical pace (median 24d on market — plan ~3-4 weeks tenant-placement turnaround); high-income renter base; 15,411 units permitted in Lee County in 2024 (4,686 in 5+ unit buildings).
- This rent runs 32% of the median local income ($110k/yr) — at the standard rent-burdened threshold; future hikes will face affordability resistance.
Forward outlook
- Local home prices are declining (-3.0%/yr); year-one equity from $2k of loan paydown is wiped out by about $8k of value loss. Plan a longer hold.
- Lee County population projected at +44% by 2050 — long-run rental-demand tailwind backs the buy-and-hold thesis.
Negotiation context
- It's been on market 22 days — a 2% lower offer ($265k) is reasonable based on typical stale-listing flexibility.
- 6 sale attempts since 7y ago with the ask held roughly flat each time — persistent listings suggest the price (not the market) is what's stuck; bring a comps-based counter.
Risks & watch-outs
- Watch-outs: HOA is 23% of rent.
- Climate carrying-cost: severe wind risk, 99% chance of damaging wind over 30y; extreme-heat days projected 7→29/yr by 2055 (HVAC capex compounding) — expect insurance premiums to compound above CPI over the hold.
Questions for the listing agent
- What do current leases actually rent for vs. the listed asking? Can we see a recent rent roll and the last 12 months of T-12 income?
- What does the HOA fee cover, when was the last increase, and are there any pending special assessments or reserve-fund shortfalls?
- Any open or pending special assessments — roof, HVAC, plumbing, elevator, façade? What's the per-unit balance and payoff schedule, and is the seller paying it off at close or rolling it to the buyer?
- Is there a deadline driving the sale (1031 exchange, divorce, estate, relocation)? That informs how much negotiation room exists.
- Schools are B-rated — typically a magnet for longer-tenancy family renters. What's the average tenant stay here, and is there a school-zone premium baked into asking?
- The area grade is low — what's the realistic commute time and amenity access for the typical tenant pool here? Any planned neighborhood developments (good or bad) we should know about?
- What's the average days-on-market for RENTAL listings here right now (not sales)? A rising rental-DOM trend means longer vacancies and softer asking-rent achievability than the comps imply.
- What's the recent tenant-quality profile in this submarket — average credit score on applications, eviction rate, late-payment / NSF rate, and stable-employment percentage? A property-management company in the area should have these aggregated.
- How much new apartment / multifamily construction is in the pipeline within 1–3 miles? Heavy new supply (>2% of stock underway) typically softens rents 12–24 months out; light construction supports rent growth.
Investment metrics
- 1% rule
- 1.11% ✓
- Cap rate
- 5.63%
- Cash-on-cash
- -2.36%
- DSCR
- 0.90
- GRM
- 7.5
CMA / ARV
No comps found within radius.
Projected returns pro-forma
-3.0% appreciation · 0.37% rent growth · sell at horizon
- IRR
- -24.1%
- Equity multiple
- 0.20×
- Total profit
- $-60,263
- Equity at exit
- $40,109
- IRR
- -34.6%
- Equity multiple
- -0.23×
- Total profit
- $-92,762
- Equity at exit
- $23,258
Cash invested: $75,320 (down + closing). Projections, not guarantees.
Landlord ↔ Tenant lean methodology
- Overall (STATE)
- 87 Strongly Landlord-Friendly
- State Florida
- 87 Strongly Landlord-Friendly · R+3
- County
- — inherits STATE
- City
- — inherits STATE
ZIP-level market 33913
- Home prices YoY
- -10.3%
- Rents YoY
- 0.4%
- Active inventory
- 811
- Price-to-rent
- 7.5×
Monthly cashflow live
- Estimated rent
- $2,983 high interval (Pro) →
- Mortgage (P&I)
- −$1,411
- Tax from tax record
- −$303 /mo · $3,638/yr
- Insurance
- −$112
- HOA
- −$679
- Vacancy / Maint / Mgmt
- −$627
- Net cashflow
- $-148
Break-even live
UW: 25.0% down · 7.5% · 30yr · 1.5% tax · 5.0% vac · 8.0% maint · 8.0% mgmt
Financing live
Cash to close
- Down payment
- $67,250
- Closing costs
- $8,070
- Reserves months
- —
- Total cash needed
- —
Loan-product check · same deal, 3 products live
Conventional
25% down · 7.5% · 30yr
- Down + closing
- —
- Monthly P&I
- —
- Monthly cashflow
- —
- DSCR
- —
- Eligible?
- —
Personal DTI + credit; lowest rate.
DSCR
20% down · 8.5% · 30yr
- Down + closing
- —
- Monthly P&I
- —
- Monthly cashflow
- —
- DSCR
- —
- Eligible?
- —
No personal income docs; deal must DSCR.
Hard money
10% down · 12.0% · 12mo
- Down + closing
- —
- Monthly P&I
- —
- Monthly cashflow
- —
- DSCR
- —
- Eligible?
- —
Short-term bridge; refi at stabilization.
Rent comps 40 comps
| Address | Beds | Baths | Sqft | Rent | $/sqft | DOM | Units | Dist |
|---|---|---|---|---|---|---|---|---|
| 12020 Champions Green Way #112 Fort Myers, FL | 2.0 | 2.0 | 1056 | $2,000 | $1.89 | 11d | 1 | 0.08mi |
| 12030 Champions Green Way #212 Fort Myers, FL | 2.0 | 2.0 | 1056 | $1,800 | $1.70 | 3d | 1 | 0.11mi |
| 11343 Tiverton Trce Fort Myers, FL | 2.0 | 2.0 | 1685 | $4,000 | $2.37 | 3d | 1 | 0.66mi |
| 12141 Summergate Cir #102 Fort Myers, FL | 2.0 | 2.0 | 978 | $1,800 | $1.84 | 11d | 1 | 0.82mi |
| 12131 Summergate Cir #203 Fort Myers, FL | 2.0 | 2.0 | 978 | $3,500 | $3.58 | 23d | 1 | 0.83mi |
| 11701 Avingston Ter Fort Myers, FL | 2.0 | 2.0 | 1553 | $5,500 | $3.54 | 14d | 1 | 0.86mi |
| 10529 Casella Way #102 Fort Myers, FL | 3.0 | 2.0 | 1722 | $4,500 | $2.61 | 23d | 1 | 0.87mi |
| 12171 Summergate Cir #102 Fort Myers, FL | 2.0 | 2.0 | 978 | $1,500 | $1.53 | 23d | 1 | 0.87mi |
| 10820 Palazzo Way #203 Fort Myers, FL | 2.0 | 2.0 | 1235 | $5,400 | $4.37 | 23d | 1 | 0.89mi |
| 12061 Summergate Cir #204 Fort Myers, FL | 2.0 | 2.0 | 956 | $3,000 | $3.14 | 23d | 1 | 0.90mi |
| 11230 Suffield St Fort Myers, FL | 2.0 | 2.0 | 1560 | $8,500 | $5.45 | 23d | 1 | 0.90mi |
| 12090 Summergate Cir #101 Fort Myers, FL | 3.0 | 2.0 | 1231 | $1,825 | $1.48 | 23d | 1 | 0.90mi |
| 10520 Casella Way #101 Fort Myers, FL | 3.0 | 2.0 | 1722 | $7,000 | $4.07 | 23d | 1 | 0.92mi |
| 10791 Palazzo Way #301 Fort Myers, FL | 2.0 | 2.0 | 1390 | $5,300 | $3.81 | 23d | 1 | 0.96mi |
| 12096 Ledgewood Cir Fort Myers, FL | 3.0 | 2.0 | 1798 | $2,850 | $1.59 | 23d | 1 | 1.00mi |
| 11490 Villa Grand #209 Fort Myers, FL | 2.0 | 2.0 | 1107 | $1,500 | $1.36 | 3d | 1 | 1.01mi |
| 11500 Villa Grand #316 Fort Myers, FL | 2.0 | 2.0 | 1107 | $1,650 | $1.49 | 23d | 1 | 1.03mi |
| 11500 Villa Grand #306 Fort Myers, FL | 2.0 | 2.0 | 1107 | $1,900 | $1.72 | 23d | 1 | 1.03mi |
| 10879 Rutherford Rd Fort Myers, FL | 2.0 | 2.0 | 1566 | $3,500 | $2.23 | 23d | 1 | 1.05mi |
| 11900 Grosseto Ct Fort Myers, FL | 2.0 | 2.0 | 1713 | $6,000 | $3.50 | 19d | 1 | 1.06mi |
| 11900 Grosseto Ct Fort Myers, FL | 2.0 | 2.0 | 1713 | $5,500 | $3.21 | 23d | 1 | 1.06mi |
| 10751 Palazzo Way #103 Fort Myers, FL | 2.0 | 2.0 | 1235 | $5,000 | $4.05 | 23d | 1 | 1.07mi |
| 11170 Lakeland Cir Fort Myers, FL | 3.0 | 2.0 | 1571 | $1,975 | $1.26 | 14d | 1 | 1.11mi |
| 11530 Villa Grand Fort Myers, FL | 3.0 | 2.0 | 1336 | $1,750 | $1.31 | 3d | 1 | 1.12mi |
| 11530 Villa Grand #1109 Fort Myers, FL | 2.0 | 2.0 | 1107 | $1,500 | $1.36 | 23d | 1 | 1.12mi |
| 10711 Palazzo Way Unit 203 Fort Myers, FL | 2.0 | 2.0 | 1257 | $5,300 | $4.22 | 21d | 1 | 1.13mi |
| 10711 Palazzo Way Fort Myers, FL | 2.0 | 2.0 | 1257 | $3,900 | $3.10 | 15d | 2 | 1.13mi |
| 11571 Villa Grand #617 Fort Myers, FL | 3.0 | 2.0 | 1336 | $2,200 | $1.65 | 15d | 1 | 1.15mi |
| 11561 Villa Grand #717 Fort Myers, FL | 2.0 | 2.0 | 1107 | $1,550 | $1.40 | 15d | 1 | 1.17mi |
| 10952 Clarendon St Fort Myers, FL | 2.0 | 2.0 | 1582 | $4,000 | $2.53 | 23d | 1 | 1.18mi |
| 10700 Palazzo Way #201 Fort Myers, FL | 2.0 | 2.0 | 1390 | $5,000 | $3.60 | 21d | 1 | 1.18mi |
| 10900 Glenhurst St Fort Myers, FL | 2.0 | 2.0 | 1355 | $2,200 | $1.62 | 2d | 1 | 1.24mi |
| 10535 Carolina Willow Dr Fort Myers, FL | 3.0 | 2.0 | 1290 | $2,300 | $1.78 | 21d | 1 | 1.26mi |
| 10908 Clarendon St Fort Myers, FL | 3.0 | 2.0 | 1433 | $8,000 | $5.58 | 23d | 1 | 1.27mi |
| 10908 Clarendon St Fort Myers, FL | 3.0 | 2.0 | 1433 | $8,000 | $5.58 | 14d | 1 | 1.27mi |
| 12300 Professional Park Dr Fort Myers, FL | 1.0–3.0 | 1.0–2.0 | 1058 | $2,345 | $2.22 | 23d | 25 | 1.30mi |
| 10730 Cetrella Dr Fort Myers, FL | 3.0 | 2.0 | 1558 | $6,900 | $4.43 | 23d | 1 | 1.30mi |
| 10714 Cetrella Dr Fort Myers, FL | 2.0 | 2.0 | 1227 | $5,500 | $4.48 | 23d | 1 | 1.35mi |
| 10702 Cetrella Dr Fort Myers, FL | 2.0 | 2.0 | 1347 | $5,500 | $4.08 | 23d | 1 | 1.40mi |
| 10700 Cetrella Dr Fort Myers, FL | 2.0 | 2.0 | 1227 | $3,500 | $2.85 | 23d | 1 | 1.40mi |
HOA detail condo
- Monthly dues
- $679 · $8,148/yr
- Likely covers
- security
- Assessments
- None detected in remarks — confirm with the listing agent.
Listing history 27 events
-
2026-06-17days on market $269,000 Active 22 DOM
-
2026-06-16days on market $269,000 Active 21 DOM
-
2026-06-15days on market $269,000 Active 20 DOM
-
2026-06-13days on market $269,000 Active 18 DOM
-
2026-06-10days on market $269,000 Active 15 DOM
-
2026-06-09days on market $269,000 Active 14 DOM
-
2026-06-08days on market $269,000 Active 13 DOM
-
2026-06-07days on market $269,000 Active 12 DOM
-
2026-06-03days on market $269,000 Active 8 DOM
-
2026-06-02days on market $269,000 Active 7 DOM
-
2026-06-01days on market $269,000 Active 6 DOM
-
2026-05-31days on market $269,000 Active 5 DOM
-
2026-05-26$269,000 Active
-
2026-02-18historical $2,500
-
2026-01-09$2,500
-
2026-01-09historical $2,500
-
2026-01-08$2,500
-
2021-12-02soldstatus $270,000
-
2021-11-30soldstatus $270,000 Closed 180-char remark
Show marketing remark (180 chars)
Beautiful Garden Condo on the Golf Course at Gateway Golf & Country Club, a gated community. This Bayhill model with 3BR, 2BA with 1 car garage on the 1st floor -- No stairs.
-
2021-10-13status Pending 180-char remark
Show marketing remark (180 chars)
Beautiful Garden Condo on the Golf Course at Gateway Golf & Country Club, a gated community. This Bayhill model with 3BR, 2BA with 1 car garage on the 1st floor -- No stairs.
-
2021-10-12$275,000 Active 180-char remark
Show marketing remark (180 chars)
Beautiful Garden Condo on the Golf Course at Gateway Golf & Country Club, a gated community. This Bayhill model with 3BR, 2BA with 1 car garage on the 1st floor -- No stairs.
-
2021-08-09status Pending
-
2021-08-09historical
-
2021-07-24price $259,900
-
2021-07-08$249,900 Active
-
2019-12-19historical
-
2019-09-11$230,000 Active
ⓘ Source: listings_history table (triggers on properties + properties_extension) + one-shot
backfill from property_details.listing_events for pre-trigger history.
Tax reassessment forecast FL · Resets to sale price
- Current annual tax
- $3,638 · $303/mo
- Projected year-2 tax
- $3,638 · $303/mo
- Expected delta
- $0/yr ($0/mo · 0.0%)
ⓘ Screening estimate from a state-policy table — verify with the county assessor before closing.
Climate risk First Street
- Flood 1/10 Low FEMA zone X (unshaded) · 0% chance over 30 yrs
- Wildfire 4/10 Moderate
- Heat 10/10 Extreme 7 d/yr ≥107°F today · 29 d/yr by 30 yrs out
- Wind 10/10 Extreme 99% chance of damaging wind over 30 yrs
- Air quality 2/10 Low 1 unhealthy d/yr today · 1 by 30 yrs out
Nearby sold comps map
Loading sold comps map…
Walkable amenities ~0.75 mi
Loading nearby amenities…
Taxation est. · year 1
- Rental income
- $35,802
- − Mortgage interest
- −$15,068
- − Property taxes
- −$3,638
- − Insurance
- −$1,345
- − Repairs & maintenance
- −$2,864
- − Management
- −$2,864
- − HOA
- −$8,148
- − Depreciation
- −$7,825
- Taxable loss
- −$5,951
- Est. tax savings @ 24.0%
- +$1,428
- After-tax cash flow
- $-347/yr
For passive investors: Depreciation is non-cash, so a rental often shows a tax loss while cash-flowing — sheltering income. Rental losses are passive: they offset passive income freely, and up to $25,000/yr can offset ordinary (W-2) income if you actively participate and your MAGI is under $100k (phasing out to $0 by $150k); unused losses carry forward. On sale, claimed depreciation is recaptured at up to 25%, and gains may owe capital-gains tax (a 1031 exchange can defer both). Figures are a year-1 estimate at your 24.0% rate — not tax advice; consult a CPA.
Schools (NCES district)
- District
- Lee
- NCES district ID
- 1201080
- Math proficiency
- 47% ▼ -11.00%
- Reading proficiency
- 50% ▼ -4.00%
- Median HH income
- $49,518
- Composite
- 41.49/100
- National rank
- #3458
- State rank
- #42 of 73 in FL
Livability — Gateway
- Score
- 69/100
- State rank
- #477
- US rank
- #8703
Category grades
Schools grade is shown separately in the Schools card above.
Census & demographics
- Census place
- Gateway, FL
- County
- Lee County · 788,662 people
- City population
- 278,598
- Metro
- Cape Coral-Fort Myers, FL
- Population (ZIP)
- 31,538
- Household income
- $110,373
- Rent vs Own
- Severe rent burden
- 276.0
Population outlook (Lee County) Hauer SSP2
- Today (2025)
- 871,946 people
- By 2030
- 955,468 · +9.6%
- By 2040
- 1,113,587 · +27.7%
- By 2050
- 1,256,891 · +44.1%
- By 2075
- 1,560,270 · +78.9%
- By 2100
- 1,726,848 · +98.0%
Race, ethnicity, and origin ACS 2023
- Neighborhood character
- Predominantly White (74%)
- Race & ethnicity
- White 74% Hispanic / Latino 13% Two or more races 11% Black 5% Asian 2%
- Hispanic origin (detail)
- Mexican 3% Puerto Rican 3% Cuban 2%
- Common ancestry
- Romanian 5% Lithuanian 3% Slovak 2%
- Foreign-born
- 14% · Canada, Vietnam, China
- Languages at home
- 84% English-only · Spanish 10% Other Indo-European 2% French/Haitian/Cajun 2%
Political lean MEDSL · Lee
- 2024 margin
- Strong R (+28.4) · D 35.5% · R 63.9%
- 2008→2024 swing
- -18.0pp toward R · 2008: -10.4pp · 2024: -28.4pp
- All cycles
- 2024: R+28.4 2020: R+19.2 2016: R+20.4 2012: R+16.6 2008: R+10.4
Not yet ingested
- Civics
- —
Market trends
- HPI YoY
- ▼ -25.45%
- Current HPI
- 221.7115
- Rent YoY
- ▲ 0.37%
- Metro
- Cape Coral-Fort Myers, FL
- State GDP YoY
- ▲ 3.28%
- F500 in state
- 36
Industry mix (Fortune 500 HQ in FL)
| Industry | F500 HQs | Revenue |
|---|---|---|
| Industrial Technology | 2 | $29B |
|
||
| Insurance | 2 | $17B |
|
||
| Retail | 1 | $60B |
|
||
| Technology Distribution | 1 | $58B |
|
||
| Homebuilding | 1 | $35B |
|
||
| Technology Manufacturing | 1 | $35B |
|
||
Price history
+17.0% since first listed15 events — show timeline
- 2026-05-26 Listed $269,000 FORTMLS
- 2026-02-18 Rental Removed $2,500 FGCMLS
- 2026-01-09 Listed for Rent $2,500 FGCMLS
- 2026-01-09 Rental Removed $2,500 NAPLESMLS
- 2026-01-08 Listed for Rent $2,500 NAPLESMLS
- 2021-12-02 Sold (Public Records) $270,000 Public Records
- 2021-11-30 Sold (MLS) $270,000 FORTMLS
- 2021-10-13 Pending — FORTMLS
- 2021-10-12 Listed $275,000 FORTMLS
- 2021-08-09 Pending — FORTMLS
- 2021-08-09 Listing Removed — FORTMLS
- 2021-07-24 Price Changed $259,900 FORTMLS
- 2021-07-08 Listed $249,900 FORTMLS
- 2019-12-19 Listing Removed — FORTMLS
- 2019-09-11 Listed $230,000 FORTMLS
Property tax history
+4.0%/yrLatest (2025): $3,638 · +5.2% YoY. Source: county tax records.
Cash-flow waterfall
monthlySold comps — $/sqft
last 12 mo · ≤1 miLoading sold comps…