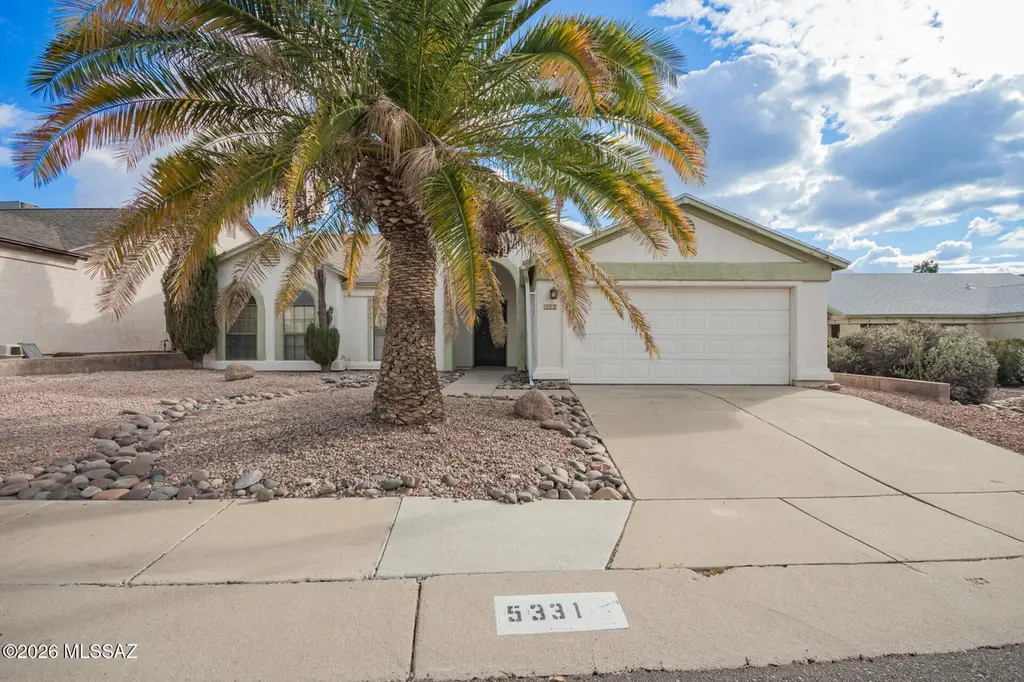
5331 W Eaglestone Loop · Marana, AZ
Flood risk 1/10 · Minimal
- FEMA flood zone
- X (unshaded)
- Chance of flooding over 30 yrs
- 0.0%
- Est. flood insurance / yr
- $507 – $1,088
Fire risk 6/10 · Moderate
- Est. fire insurance / yr
- $610 – $1,132
Heat risk 8/10 · Major
- Hot days now (above 108°F)
- 6 days/yr
- Hot days in 30 yrs
- 15 days/yr
Wind risk 1/10 · Minimal
- Chance of severe wind over 30 yrs
- —
Air-quality risk 1/10 · Minimal
- Unhealthy air days now
- 0 days/yr
- Unhealthy air days in 30 yrs
- 0 days/yr
Risk factors via First Street. Map © Google.
Why this score? — see what drove the D grade
The composite is a weighted blend of 9 inputs, each scored 0–100. Each bar is that input's sub-score; the figure is the points it added to the 100-point composite (weight × sub-score).
- ARV discount +14.4/15.0
- Cash flow +11.3/30.0
- Rent growth +3.5/5.0
- Livability +3.4/5.0
- DSCR +3.3/10.0
- Schools +3.1/10.0
- 1% rule +2.7/10.0
- Condition / age +2.5/5.0
- Appreciation +0.0/10.0
$324,950
🖨 Deal sheet (PDF) 📄 Offer letter ✓ Due diligence
Listing remarks MLS
Home, sweet home! This lovely 4-bedroom home welcomes you with a serene living/dining room with vaulted ceilings, a soothing palette, and wood-look flooring. You'll also find a spacious great room for intimate evenings with loved ones. The well-appointed kitchen comes with granite counters, a striking tile backsplash, ample wood cabinetry, and an island with a breakfast bar. Spend peaceful afternoons in the bright sunroom, perfect for enjoying the warm Arizona weather. Double doors lead to a main bedroom, offering a private bathroom with dual sinks and a jetted tub for ultimate relaxation. You'll also find a spacious bonus room for a versatile space you can customize. Venture out onto the backyard, which includes a covered patio for dining al fresco. Make this gem yours!
Key facts
- Great room
- Wood cabinetry
- Granite counters
Tags
Neighborhood map
What this means for you Summary
Snapshot
- This is a 4-bed/4.0-bath single-family listed at $325k.
Deal economics
- At list price, monthly cash flow is $-119 ($-1k/yr) — negative.
- To cash-flow at today's rent, offer at most $304k (6.5% below list).
- To meet the 1% rule (rent ≥ 1% of price), the offer needs to be $249k (23.3% below list).
- Recommended offer: $249k (23.3% below list) — sets the bar for 1% rule.
- Cap rate 5.9% vs local median 3.3% in Marana — top-decile yield for the area; either an underpriced asset or a hidden risk that comps aren't pricing in. Stress-test before assuming the spread holds.
Location & tenants
- Location reads 67/100 on livability (#67 in AZ) — a middle-class / working-renter tenant base. Strengths: employment A+, housing A+, crime A; Watch: amenities F, commute F, health & safety F.
- Marana Unified District (4404) (suburban): math 31% / reading 37% proficiency, ranked #83 of 249 in AZ (top 33%) — families likely to look elsewhere, expect single-tenant / working-renter base with shorter leases.
- Zoned schools: Degrazia Elementary School (math 27% / reading 42%, grade F, #471 of 1,109 statewide, top 44%, 360 students, 50% FRL); Tortolita Middle School (math 19% / reading 27%, grade F, #116 of 218 statewide, top 54%, 539 students, 45% FRL); Mountain View High School (math 24% / reading 30%, grade F, #141 of 381 statewide, top 38%, 1,831 students, 32% FRL).
- Market conditions: Rents rising fast (+4.2%/yr); 213 active listings in the ZIP; 8 comparable units currently listed for rent nearby; rentals lingering (median 46d on market — plan ~5-8 weeks vacancy on turnover, expect pricing pressure); 50% of comp listings sitting > 30 days — soft ceiling on asking rent; solid renter incomes; 5,268 units permitted in Pima County in 2024 (996 in 5+ unit buildings).
- This rent runs 30% of the median local income ($99k/yr) — at the standard rent-burdened threshold; future hikes will face affordability resistance.
Forward outlook
- Local home prices are declining (-3.0%/yr); year-one equity from $2k of loan paydown is wiped out by about $10k of value loss. Plan a longer hold.
- Pima County population projected at +8% by 2050 — modest demand growth; plan on rents tracking national, not racing it.
Negotiation context
- It's been on market 147 days — a 12% lower offer ($286k) is reasonable based on typical stale-listing flexibility.
- 6 sale attempts since 23y ago; this cycle's ask has dropped $70k (18%) from the opening price — seller is motivated, your offer sets the floor, not the list.
Risks & watch-outs
- Climate carrying-cost: major wildfire risk; extreme-heat days projected 6→15/yr by 2055 (HVAC capex compounding) — expect insurance premiums to compound above CPI over the hold.
Questions for the listing agent
- What do current leases actually rent for vs. the listed asking? Can we see a recent rent roll and the last 12 months of T-12 income?
- It's been on market 147 days. Have you received any prior offers? Is the seller open to a 23% concession, seller financing, or rate buy-down credit?
- Why hasn't it sold? Are there any deal-killer items the seller is aware of (foundation, flood, title, zoning, code violations)?
- Is there a deadline driving the sale (1031 exchange, divorce, estate, relocation)? That informs how much negotiation room exists.
- Schools are D-rated, which usually means shorter tenancies and higher turnover. Who's the typical renter profile here, and what's been the actual vacancy rate?
- The area grade is low — what's the realistic commute time and amenity access for the typical tenant pool here? Any planned neighborhood developments (good or bad) we should know about?
- What's the average days-on-market for RENTAL listings here right now (not sales)? A rising rental-DOM trend means longer vacancies and softer asking-rent achievability than the comps imply.
- What's the recent tenant-quality profile in this submarket — average credit score on applications, eviction rate, late-payment / NSF rate, and stable-employment percentage? A property-management company in the area should have these aggregated.
- How much new for-sale + rental construction is in the pipeline within 1–3 miles? Heavy new supply typically softens prices + rents 12–24 months out; constrained supply supports both.
Investment metrics
- 1% rule
- 0.77% ✗
- Cap rate
- 5.85%
- Cash-on-cash
- -1.57%
- DSCR
- 0.93
- GRM
- 10.9
CMA / ARV
- ARV (median comp)
- $383,342
- List price
- $324,950
- Delta
- -15.23%
- Verdict
- UNDERPRICED
- Comps
- 20 within 1.0 mi
Show comp detail 12 sales within ~0.75 mi
| Address | Dist | Beds/Ba | Sqft | Sold | Price | $/sf | Match |
|---|---|---|---|---|---|---|---|
| 5431 W Jade Hollow Pl | 0.28mi | 4/3.0 | 2,534 (-2%) | 9mo | $516,000 | $204 | 73 |
| 5650 W Copperhead Dr | 0.43mi | 4/2.5 | 2,609 (+1%) | 1mo | $418,500 | $160 | 71 |
| 9288 N Thrush Ct | 0.37mi | 4/3.5 | 2,392 (-7%) | 1mo | $435,000 | $182 | 68 |
| 5752 W King Snake Dr | 0.54mi | 4/2.5 | 2,609 (+1%) | 2mo | $405,000 | $155 | 65 |
| 5503 W Copperhead Dr | 0.22mi | 5/3.0 (+1) | 2,886 (+12%) | 2mo | $460,000 | $159 | 59 |
| 9486 N Sammy Ave | 0.22mi | 4/2.5 | 2,886 (+12%) | 10mo | $390,000 | $135 | 56 |
| 8943 N Onyx St | 0.52mi | 4/3.0 | 2,351 (-9%) | 3mo | $385,000 | $164 | 55 |
| 5512 W Beetle Dr | 0.27mi | 4/2.5 | 2,886 (+12%) | 9mo | $480,000 | $166 | 54 |
| 5115 W Sumter Dr | 0.62mi | 4/3.0 | 2,382 (-8%) | 2mo | $575,000 | $241 | 52 |
| 5662 W Copperhead Dr | 0.44mi | 5/2.5 (+1) | 2,790 (+8%) | 9mo | $550,000 | $197 | 47 |
| 5359 W Avenida Tierra Alta | 0.75mi | 3/2.5 (-1) | 2,458 (-4%) | 5mo | $567,000 | $231 | 42 |
| 5480 W Monterey Dr Lot 6 | 0.72mi | 3/2.0 (-1) | 2,223 (-14%) | 10mo | $500,000 | $225 | 22 |
Match score weights: distance 35% · size 25% · config 20% · recency 20%. Top-matched comps best support the ARV.
Projected returns pro-forma
-3.0% appreciation · 4.18% rent growth · sell at horizon
- IRR
- -17.7%
- Equity multiple
- 0.37×
- Total profit
- $-57,294
- Equity at exit
- $48,451
- IRR
- -7.9%
- Equity multiple
- 0.48×
- Total profit
- $-47,293
- Equity at exit
- $28,096
Cash invested: $90,986 (down + closing). Projections, not guarantees.
Landlord ↔ Tenant lean methodology
- Overall (STATE)
- 87 Strongly Landlord-Friendly
- State Arizona
- 87 Strongly Landlord-Friendly · R+3
- County
- — inherits STATE
- City
- — inherits STATE
ZIP-level market 85742
- Rents YoY
- 4.2%
- Active inventory
- 213
- Price-to-rent
- 10.9×
Monthly cashflow live
- Estimated rent
- $2,493 high interval (Pro) →
- Mortgage (P&I)
- −$1,704
- Tax from tax record
- −$249 /mo · $2,991/yr
- Insurance
- −$135
- HOA
- −$0
- Vacancy / Maint / Mgmt
- −$524
- Net cashflow
- $-119
Break-even live
Sensitivity live
| Price | -10% $65 | -5% $-27 | +0% $-119 | +5% $-211 | +10% $-303 |
|---|---|---|---|---|---|
| Rent | -10% $-316 | -5% $-217 | +0% $-119 | +5% $-20 | +10% $78 |
| Rate | -1.0pp $45 | -0.5pp $-36 | base $-119 | +0.5pp $-203 | +1.0pp $-289 |
UW: 25.0% down · 7.5% · 30yr · 1.5% tax · 5.0% vac · 8.0% maint · 8.0% mgmt
Financing live
Cash to close
- Down payment
- $81,238
- Closing costs
- $9,748
- Reserves months
- —
- Total cash needed
- —
Loan-product check · same deal, 3 products live
Conventional
25% down · 7.5% · 30yr
- Down + closing
- —
- Monthly P&I
- —
- Monthly cashflow
- —
- DSCR
- —
- Eligible?
- —
Personal DTI + credit; lowest rate.
DSCR
20% down · 8.5% · 30yr
- Down + closing
- —
- Monthly P&I
- —
- Monthly cashflow
- —
- DSCR
- —
- Eligible?
- —
No personal income docs; deal must DSCR.
Hard money
10% down · 12.0% · 12mo
- Down + closing
- —
- Monthly P&I
- —
- Monthly cashflow
- —
- DSCR
- —
- Eligible?
- —
Short-term bridge; refi at stabilization.
Rent comps 8 comps
| Address | Beds | Baths | Sqft | Rent | $/sqft | DOM | Units | Dist |
|---|---|---|---|---|---|---|---|---|
| 9472 N Albatross Dr Tucson, AZ | 4.0 | 3.0 | 1930 | $2,000 | $1.04 | 45d | 1 | 0.21mi |
| 8984 N Eaglestone Loop Tucson, AZ | 4.0 | 2.5 | 2368 | $2,300 | $0.97 | 5d | 1 | 0.44mi |
| 9019 N Grafton Ave Tucson, AZ | 4.0 | 3.0 | 2351 | $3,200 | $1.36 | 45d | 1 | 0.72mi |
| 5083 W Calle Vista del Sur Tucson, AZ | 3.0 | 2.5 | 2658 | $3,099 | $1.17 | 22d | 1 | 0.93mi |
| 5083 W Calle Vista del Sur Tucson, AZ | 3.0 | 2.5 | 2658 | $3,099 | $1.17 | 25d | 1 | 0.93mi |
| 9906 N Niobrara Way Tucson, AZ | 3.0 | 2.0 | 1844 | $2,095 | $1.14 | 25d | 1 | 1.01mi |
| 8796 N Norway Spruce Rd Tucson, AZ | 4.0 | 3.0 | 2301 | $2,495 | $1.08 | 45d | 1 | 1.40mi |
| 8760 N Norway Spruce Rd Tucson, AZ | 4.0 | 3.0 | 2301 | $2,200 | $0.96 | 45d | 1 | 1.44mi |
Listing history 33 events
-
2026-06-21days on market $324,950 Active 147 DOM
-
2026-06-18days on market $324,950 Active 144 DOM
-
2026-06-17days on market $324,950 Active 143 DOM
-
2026-06-16days on market $324,950 Active 142 DOM
-
2026-06-15days on market $324,950 Active 141 DOM
-
2026-06-13days on market $324,950 Active 139 DOM
-
2026-06-13days on market $324,950 Active 138 DOM
-
2026-06-10pricedays on market $324,950 Active 136 DOM
-
2026-06-09days on market $349,950 Active 135 DOM
-
2026-06-08days on market $349,950 Active 134 DOM
-
2026-06-07days on market $349,950 Active 133 DOM
-
2026-06-05days on market $349,950 Active 130 DOM
-
2026-06-03days on market $349,950 Active 129 DOM
-
2026-06-02days on market $349,950 Active 128 DOM
-
2026-06-01days on market $349,950 Active 127 DOM
-
2026-05-31days on market $349,950 Active 126 DOM
-
2026-04-06price $349,950 781-char remark
Show marketing remark (781 chars)
Home, sweet home! This lovely 4-bedroom home welcomes you with a serene living/dining room with vaulted ceilings, a soothing palette, and wood-look flooring. You'll also find a spacious great room for intimate evenings with loved ones. The well-appointed kitchen comes with granite counters, a striking tile backsplash, ample wood cabinetry, and an island with a breakfast bar. Spend peaceful afternoons in the bright sunroom, perfect for enjoying the warm Arizona weather. Double doors lead to a main bedroom, offering a private bathroom with dual sinks and a jetted tub for ultimate relaxation. You'll also find a spacious bonus room for a versatile space you can customize. Venture out onto the backyard, which includes a covered patio for dining al fresco. Make this gem yours!
-
2026-02-25price $374,950 781-char remark
Show marketing remark (781 chars)
Home, sweet home! This lovely 4-bedroom home welcomes you with a serene living/dining room with vaulted ceilings, a soothing palette, and wood-look flooring. You'll also find a spacious great room for intimate evenings with loved ones. The well-appointed kitchen comes with granite counters, a striking tile backsplash, ample wood cabinetry, and an island with a breakfast bar. Spend peaceful afternoons in the bright sunroom, perfect for enjoying the warm Arizona weather. Double doors lead to a main bedroom, offering a private bathroom with dual sinks and a jetted tub for ultimate relaxation. You'll also find a spacious bonus room for a versatile space you can customize. Venture out onto the backyard, which includes a covered patio for dining al fresco. Make this gem yours!
-
2026-01-25$394,950 Active 781-char remark
Show marketing remark (781 chars)
Home, sweet home! This lovely 4-bedroom home welcomes you with a serene living/dining room with vaulted ceilings, a soothing palette, and wood-look flooring. You'll also find a spacious great room for intimate evenings with loved ones. The well-appointed kitchen comes with granite counters, a striking tile backsplash, ample wood cabinetry, and an island with a breakfast bar. Spend peaceful afternoons in the bright sunroom, perfect for enjoying the warm Arizona weather. Double doors lead to a main bedroom, offering a private bathroom with dual sinks and a jetted tub for ultimate relaxation. You'll also find a spacious bonus room for a versatile space you can customize. Venture out onto the backyard, which includes a covered patio for dining al fresco. Make this gem yours!
-
2024-03-05soldstatus $465,000 Closed 132-char remark
Show marketing remark (132 chars)
Turn-key home featuring ADA adaptations and no HOA. Energy savings with owned Solar electric and an insulated & exhausted attic.
-
2024-03-05soldstatus $465,000
Show marketing remark (132 chars)
Turn-key home featuring ADA adaptations and no HOA. Energy savings with owned Solar electric and an insulated & exhausted attic.
-
2024-01-06Active Contingent 132-char remark
Show marketing remark (132 chars)
Turn-key home featuring ADA adaptations and no HOA. Energy savings with owned Solar electric and an insulated & exhausted attic.
-
2024-01-05$480,000 132-char remark
Show marketing remark (132 chars)
Turn-key home featuring ADA adaptations and no HOA. Energy savings with owned Solar electric and an insulated & exhausted attic.
-
2023-11-15historical
-
2023-10-12price $469,900
-
2023-08-03$475,000 Active
-
2004-02-24soldstatus $164,900
-
2004-02-24soldstatus $164,890
-
2003-12-08$164,900
-
2003-12-08historical
-
2003-10-23$174,900
-
1994-03-24soldstatus $115,750
-
1992-07-02soldstatus $109,000
ⓘ Source: listings_history table (triggers on properties + properties_extension) + one-shot
backfill from property_details.listing_events for pre-trigger history.
Tax reassessment forecast AZ · Resets to sale price
- Current annual tax
- $2,991 · $249/mo
- Projected year-2 tax
- $2,991 · $249/mo
- Expected delta
- $0/yr ($0/mo · 0.0%)
ⓘ Screening estimate from a state-policy table — verify with the county assessor before closing.
Climate risk First Street
- Flood 1/10 Low FEMA zone X (unshaded) · 0% chance over 30 yrs
- Wildfire 6/10 Major
- Heat 8/10 Severe 6 d/yr ≥108°F today · 15 d/yr by 30 yrs out
- Wind 1/10 Low
- Air quality 1/10 Low 0 unhealthy d/yr today · 0 by 30 yrs out
Nearby sold comps map
Loading sold comps map…
Walkable amenities ~0.75 mi
Loading nearby amenities…
Taxation est. · year 1
- Rental income
- $29,921
- − Mortgage interest
- −$18,202
- − Property taxes
- −$2,991
- − Insurance
- −$1,625
- − Repairs & maintenance
- −$2,394
- − Management
- −$2,394
- − Depreciation
- −$9,453
- Taxable loss
- −$7,137
- Est. tax savings @ 24.0%
- +$1,713
- After-tax cash flow
- $286/yr
For passive investors: Depreciation is non-cash, so a rental often shows a tax loss while cash-flowing — sheltering income. Rental losses are passive: they offset passive income freely, and up to $25,000/yr can offset ordinary (W-2) income if you actively participate and your MAGI is under $100k (phasing out to $0 by $150k); unused losses carry forward. On sale, claimed depreciation is recaptured at up to 25%, and gains may owe capital-gains tax (a 1031 exchange can defer both). Figures are a year-1 estimate at your 24.0% rate — not tax advice; consult a CPA.
Schools (NCES district)
- District
- Marana Unified District (4404)
- NCES district ID
- 0404630
- Math proficiency
- 31% ▼ -11.00%
- Reading proficiency
- 37% ▼ -5.00%
- Median HH income
- $65,282
- Composite
- 30.96/100
- National rank
- #6103
- State rank
- #83 of 249 in AZ
Livability — Marana
- Score
- 67/100
- State rank
- #67
- US rank
- #11113
Category grades
Schools grade is shown separately in the Schools card above.
Census & demographics
- County
- Pima County · 1,012,107 people
- City population
- 39,625
- Metro
- Tucson, AZ
- Population (ZIP)
- 31,613
- Household income
- $98,844
- Rent vs Own
- Severe rent burden
- 375.0
Population outlook (Pima County) Hauer SSP2
- Today (2025)
- 1,066,056 people
- By 2030
- 1,086,684 · +1.9%
- By 2040
- 1,117,160 · +4.8%
- By 2050
- 1,149,778 · +7.9%
- By 2075
- 1,271,480 · +19.3%
- By 2100
- 1,321,160 · +23.9%
Race, ethnicity, and origin ACS 2023
- Neighborhood character
- Predominantly White (65%)
- Race & ethnicity
- White 65% Hispanic / Latino 24% Two or more races 14% Asian 3% Black 2%
- Hispanic origin (detail)
- Mexican 19% Puerto Rican 2%
- Common ancestry
- Lithuanian 3% Romanian 3% Slovak 3%
- Foreign-born
- 6% · Canada, South Korea
- Languages at home
- 86% English-only · Spanish 11% Other Indo-European 1%
Political lean MEDSL · Pima
- 2024 margin
- D (+15.2) · D 57.0% · R 41.8% · Other 1.2%
- 2008→2024 swing
- +9.1pp toward D · 2008: 6.1pp · 2024: 15.2pp
- All cycles
- 2024: D+15.2 2020: D+18.7 2016: D+13.5 2012: D+5.8 2008: D+6.1
Not yet ingested
- Civics
- —
Market trends
- HPI YoY
- ▼ -164.07%
- Current HPI
- 268.0313
- Rent YoY
- ▲ 4.18%
- Metro
- Tucson, AZ
- State GDP YoY
- ▲ 4.54%
- F500 in state
- 20
Industry mix (Fortune 500 HQ in AZ)
| Industry | F500 HQs | Revenue |
|---|---|---|
| Technology | 2 | $13B |
|
||
| Mining / Metals | 1 | $23B |
|
||
| Environmental Services | 1 | $16B |
|
||
| Metals / Steel | 1 | $14B |
|
||
| Technology Distribution | 1 | $9B |
|
||
| Homebuilding | 1 | $8B |
|
||
Price history
+221.1% since first listed17 events — show timeline
- 2026-04-06 Price Changed $349,950 MLSSAZ
- 2026-02-25 Price Changed $374,950 MLSSAZ
- 2026-01-25 Listed $394,950 MLSSAZ
- 2024-03-05 Sold (Public Records) $465,000 Public Records
- 2024-03-05 Sold (MLS) $465,000 MLSSAZ
- 2024-01-06 Listed — MLSSAZ
- 2024-01-05 Listed $480,000 MLSSAZ
- 2023-11-15 Listing Removed — MLSSAZ
- 2023-10-12 Price Changed $469,900 MLSSAZ
- 2023-08-03 Listed $475,000 MLSSAZ
- 2004-02-24 Sold (Public Records) $164,890 Public Records
- 2004-02-24 Sold (MLS) $164,900 MLSSAZ
- 2003-12-08 Listing Removed — MLSSAZ
- 2003-12-08 Listed $164,900 MLSSAZ
- 2003-10-23 Listed $174,900 MLSSAZ
- 1994-03-24 Sold (Public Records) $115,750 Public Records
- 1992-07-02 Sold (Public Records) $109,000 Public Records
Property tax history
+4.1%/yrLatest (2025): $2,991 · +34.1% YoY. Source: county tax records.
Cash-flow waterfall
monthlySold comps — $/sqft
last 12 mo · ≤1 miLoading sold comps…