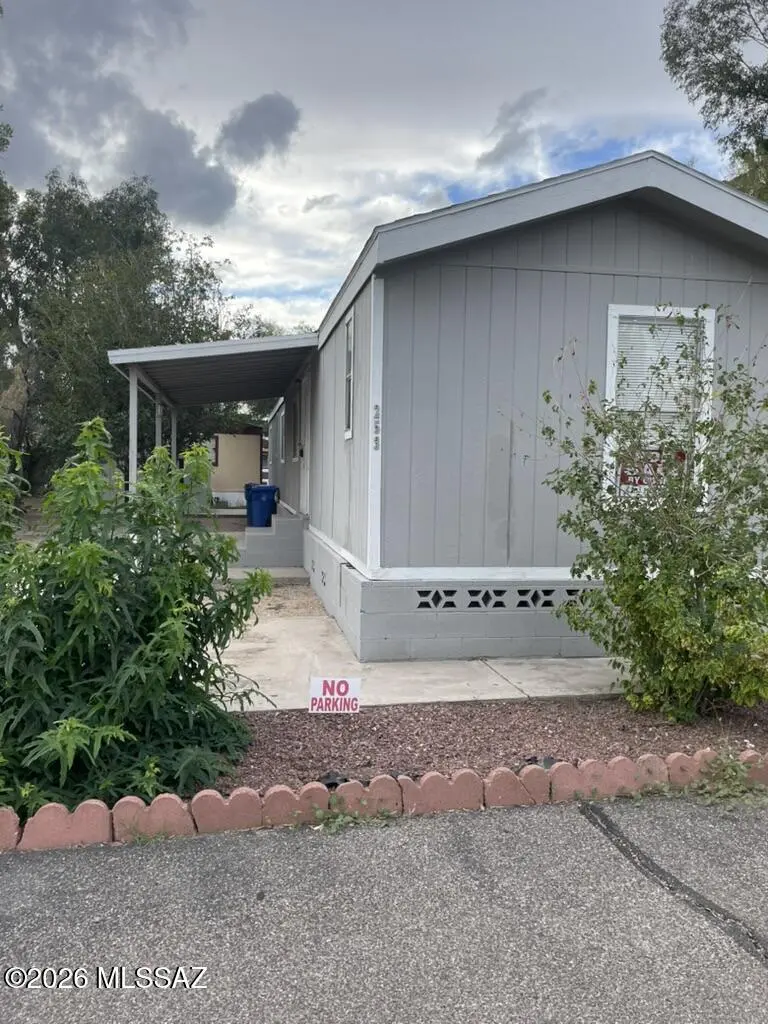
1111 E Limberlost Dr #253 · Tucson, AZ
Flood risk 1/10 · Minimal
- FEMA flood zone
- X (unshaded)
- Chance of flooding over 30 yrs
- 0.0%
- Est. flood insurance / yr
- $507 – $1,088
Fire risk 7/10 · Major
- Est. fire insurance / yr
- $610 – $1,132
Heat risk 8/10 · Major
- Hot days now (above 107°F)
- 7 days/yr
- Hot days in 30 yrs
- 17 days/yr
Wind risk 1/10 · Minimal
- Chance of severe wind over 30 yrs
- —
Air-quality risk 1/10 · Minimal
- Unhealthy air days now
- 0 days/yr
- Unhealthy air days in 30 yrs
- 0 days/yr
Risk factors via First Street. Map © Google.
Why this score? — see what drove the C+ grade
The composite is a weighted blend of 9 inputs, each scored 0–100. Each bar is that input's sub-score; the figure is the points it added to the 100-point composite (weight × sub-score).
- Cash flow +27.9/30.0
- 1% rule +10.0/10.0
- DSCR +9.9/10.0
- Condition / age +4.0/5.0
- Livability +3.7/5.0
- Schools +3.1/10.0
- Rent growth +2.9/5.0
- ARV discount +0.0/15.0
- Appreciation +0.0/10.0
$65,000
🖨 Deal sheet 📄 Offer letter ✓ Due diligence
Listing remarks MLS
Must see this economical recently renovated 3 bedroom, 2 bath home! Community has a club house, swimming pool and more! This will not last long!
Key facts
- Community pool
- Built 1992
- Listed 138 days
Neighborhood map
What this means for you Summary
Snapshot
- This is a 3-bed/2.0-bath manufactured listed at $65k. Condition is rated good.
Deal economics
- At list price, monthly cash flow is $200 ($2k/yr) — positive.
- The deal already cash-flows at list — no discount required.
- Meets the 1% rule at list price ($2k rent vs $65k).
- Recommended offer: $57k (12.0% below list) — sets the bar for market timing.
- Cap rate 10.0% vs local median 3.7% in Tucson — top-decile yield for the area; either an underpriced asset or a hidden risk that comps aren't pricing in. Stress-test before assuming the spread holds.
Location & tenants
- Location reads 74/100 on livability (#17 in AZ, #4,502 nationally) — a middle-class / working-renter tenant base. Strengths: commute A+, cost of living A+, housing A+; Watch: health & safety C-, schools D+, crime F.
- Amphitheater Unified District (4406) (suburban): math 32% / reading 40% proficiency, ranked #85 of 249 in AZ (top 34%) — families likely to look elsewhere, expect single-tenant / working-renter base with shorter leases.
- Market conditions: Rents rising (+1.4%/yr); 159 active listings in the ZIP; 40 comparable units currently listed for rent nearby; rentals at typical pace (median 15d on market — plan ~3-4 weeks tenant-placement turnaround); lower-income renter base — watch delinquency; 5,268 units permitted in Pima County in 2024 (996 in 5+ unit buildings).
- This rent runs 43% of the median local income ($42k/yr) — at the standard rent-burdened threshold; future hikes will face affordability resistance.
Forward outlook
- Local home prices are declining (-3.0%/yr); year-one equity from $449 of loan paydown is wiped out by about $2k of value loss. Plan a longer hold.
- Pima County population projected at +8% by 2050 — modest demand growth; plan on rents tracking national, not racing it.
Negotiation context
- It's been on market 138 days — a 12% lower offer ($57k) is reasonable based on typical stale-listing flexibility.
Risks & watch-outs
- Watch-outs: HOA is 36% of rent.
- Climate carrying-cost: major wildfire risk; extreme-heat days projected 7→17/yr by 2055 (HVAC capex compounding) — expect insurance premiums to compound above CPI over the hold.
Questions for the listing agent
- It's been on market 138 days. Have you received any prior offers? Is the seller open to a 12% concession, seller financing, or rate buy-down credit?
- What does the HOA fee cover, when was the last increase, and are there any pending special assessments or reserve-fund shortfalls?
- Why hasn't it sold? Are there any deal-killer items the seller is aware of (foundation, flood, title, zoning, code violations)?
- Is there a deadline driving the sale (1031 exchange, divorce, estate, relocation)? That informs how much negotiation room exists.
- Schools are D-rated, which usually means shorter tenancies and higher turnover. Who's the typical renter profile here, and what's been the actual vacancy rate?
- Crime grade is F in this area — have there been break-ins, vandalism, or insurance claims at this property in the last 3 years? What carrier currently insures it and at what premium?
- What's the average days-on-market for RENTAL listings here right now (not sales)? A rising rental-DOM trend means longer vacancies and softer asking-rent achievability than the comps imply.
- What's the recent tenant-quality profile in this submarket — average credit score on applications, eviction rate, late-payment / NSF rate, and stable-employment percentage? A property-management company in the area should have these aggregated.
- How much new for-sale + rental construction is in the pipeline within 1–3 miles? Heavy new supply typically softens prices + rents 12–24 months out; constrained supply supports both.
Investment metrics
- 1% rule
- 2.32% ✓
- Cap rate
- 9.99%
- Cash-on-cash
- 13.22%
- DSCR
- 1.59
- GRM
- 3.6
CMA / ARV
- ARV (median comp)
- $50,500
- List price
- $65,000
- Delta
- 28.71%
- Verdict
- OVERPRICED
- Comps
- 2 within 1.0 mi
Projected returns pro-forma
-3.0% appreciation · 1.45% rent growth · sell at horizon
- IRR
- 0.4%
- Equity multiple
- 1.02×
- Total profit
- $274
- Equity at exit
- $9,692
- IRR
- 7.3%
- Equity multiple
- 1.49×
- Total profit
- $8,917
- Equity at exit
- $5,620
Cash invested: $18,200 (down + closing). Projections, not guarantees.
Landlord ↔ Tenant lean methodology
- Overall (STATE)
- 87 Strongly Landlord-Friendly
- State Arizona
- 87 Strongly Landlord-Friendly · R+3
- County
- — inherits STATE
- City
- — inherits STATE
ZIP-level market 85719
- Rents YoY
- 1.4%
- Active inventory
- 159
- Price-to-rent
- 3.6×
Monthly cashflow live
- Estimated rent
- $1,506 high interval (Pro) →
- Mortgage (P&I)
- −$341
- Tax est. 1.5%
- −$81 /mo · $975/yr
- Insurance
- −$27
- HOA
- −$540
- Vacancy / Maint / Mgmt
- −$316
- Net cashflow
- $200
Break-even live
UW: 25.0% down · 7.5% · 30yr · 1.5% tax · 5.0% vac · 8.0% maint · 8.0% mgmt
Financing live
Cash to close
- Down payment
- $16,250
- Closing costs
- $1,950
- Reserves months
- —
- Total cash needed
- —
Loan-product check · same deal, 3 products live
Conventional
25% down · 7.5% · 30yr
- Down + closing
- —
- Monthly P&I
- —
- Monthly cashflow
- —
- DSCR
- —
- Eligible?
- —
Personal DTI + credit; lowest rate.
DSCR
20% down · 8.5% · 30yr
- Down + closing
- —
- Monthly P&I
- —
- Monthly cashflow
- —
- DSCR
- —
- Eligible?
- —
No personal income docs; deal must DSCR.
Hard money
10% down · 12.0% · 12mo
- Down + closing
- —
- Monthly P&I
- —
- Monthly cashflow
- —
- DSCR
- —
- Eligible?
- —
Short-term bridge; refi at stabilization.
Rent comps 40 comps
| Address | Beds | Baths | Sqft | Rent | $/sqft | DOM | Units | Dist |
|---|---|---|---|---|---|---|---|---|
| 4545 N Via Entrada Tucson, AZ | 1.0–3.0 | 1.0–2.5 | 900 | $2,041 | $2.27 | 1d | 30 | 0.33mi |
| 880 E Peppergrass Ln Tucson, AZ | 2.0 | 1.5 | 872 | $1,495 | $1.71 | 20d | 1 | 0.35mi |
| 1402 E Roger Rd Tucson, AZ | 2.0 | 1.0 | 893 | $1,850 | $2.07 | 23d | 1 | 0.44mi |
| 1200 E River Rd Unit K147 Tucson, AZ | 2.0 | 2.0 | 991 | $1,625 | $1.64 | 43d | 1 | 0.44mi |
| 1200 E River Rd Tucson, AZ | 2.0 | 2.0 | 986 | $1,350 | $1.37 | 3d | 1 | 0.45mi |
| 4225 N 1st Ave Tucson, AZ | 1.0–2.0 | 1.0–2.0 | 678 | $1,294 | $1.91 | 2d | 40 | 0.49mi |
| 1200 E River Rd Unit B27 Tucson, AZ | 2.0 | 2.0 | 991 | $2,999 | $3.03 | 23d | 1 | 0.49mi |
| 1337 E Allen Rd Tucson, AZ | 1.0–2.0 | 1.0 | 803 | $995 | $1.24 | 3d | 5 | 0.57mi |
| 1341 E Allen Rd Tucson, AZ | 2.0 | 1.0 | 805 | $925 | $1.15 | 3d | 1 | 0.57mi |
| 1307 E Allen Rd Tucson, AZ | 2.0 | 2.0 | 950 | $1,295 | $1.36 | 43d | 1 | 0.61mi |
| 1301 E Allen Rd Unit B Tucson, AZ | 2.0 | 2.0 | 950 | $1,295 | $1.36 | 43d | 1 | 0.63mi |
| 402 E Limberlost Dr Unit 207 Tucson, AZ | 2.0 | 1.0 | 676 | $925 | $1.37 | 23d | 1 | 0.67mi |
| 402 E Limberlost Dr Unit 202 Tucson, AZ | 2.0 | 1.0 | 676 | $1,025 | $1.52 | 43d | 1 | 0.69mi |
| 402 E Limberlost Dr Apt 108 Tucson, AZ | 2.0 | 1.0 | 676 | $895 | $1.32 | 3d | 1 | 0.69mi |
| 349 E Calle Arizona Unit 1 Tucson, AZ | 2.0 | 1.0 | 770 | $1,075 | $1.40 | 43d | 1 | 0.74mi |
| 2024 E River Rd #202 Tucson, AZ | 2.0 | 2.0 | 1100 | $2,425 | $2.20 | 3d | 1 | 0.75mi |
| 3699 N Mountain Ave Unit 13 Tucson, AZ | 2.0 | 1.0 | 900 | $1,075 | $1.19 | 14d | 1 | 0.75mi |
| 2010 E River Rd #202 Tucson, AZ | 2.0 | 2.0 | 1023 | $1,650 | $1.61 | 43d | 1 | 0.75mi |
| 3733 N Tyndall Ave Tucson, AZ | 2.0 | 1.0 | 884 | $1,300 | $1.47 | 43d | 1 | 0.76mi |
| 3700 N 1st Ave Tucson, AZ | 2.0 | 1.0 | 522 | $1,150 | $2.20 | 2d | 27 | 0.76mi |
| 2018 E River Rd #201 Tucson, AZ | 2.0 | 2.0 | 720 | $1,695 | $2.35 | 23d | 1 | 0.77mi |
| 2026 E River Rd #204 Tucson, AZ | 2.0 | 2.0 | 720 | $1,750 | $2.43 | 3d | 1 | 0.77mi |
| 2000 E River Rd Tucson, AZ | 2.0 | 2.0 | 969 | $1,261 | $1.30 | 43d | 1 | 0.79mi |
| 2000 E River Rd Tucson, AZ | 2.0 | 2.0 | 969 | $1,372 | $1.42 | 3d | 1 | 0.79mi |
| 2028 E River Rd Tucson, AZ | 2.0 | 2.0 | 1023 | $1,800 | $1.76 | 43d | 1 | 0.80mi |
| 2032 E River Rd #200 Tucson, AZ | 2.0 | 2.0 | 1074 | $2,500 | $2.33 | 1d | 1 | 0.82mi |
| 1736 E Allen Rd Unit B Tucson, AZ | 2.0 | 1.0 | 704 | $845 | $1.20 | 43d | 1 | 0.82mi |
| 269 E Calle Arizona Tucson, AZ | 2.0 | 1.0 | 800 | $1,195 | $1.49 | 3d | 1 | 0.85mi |
| 272 E Calle Arizona Unit 2101 Tucson, AZ | 2.0 | 1.0 | 775 | $1,199 | $1.55 | 43d | 1 | 0.86mi |
| 3765 N Campbell Ave Tucson, AZ | 2.0 | 1.0 | 850 | $1,264 | $1.49 | 43d | 7 | 0.86mi |
| 1625 E Prince Rd Unit 92 Tucson, AZ | 2.0 | 1.0 | 716 | $950 | $1.33 | 3d | 1 | 0.89mi |
| 1625 E Prince Rd Unit 108 Tucson, AZ | 2.0 | 1.0 | 716 | $999 | $1.40 | 3d | 1 | 0.89mi |
| 2000 E Roger Rd Tucson, AZ | 1.0–3.0 | 1.0–2.0 | 831 | $1,299 | $1.56 | 2d | 77 | 0.91mi |
| 1625 E Prince Rd Tucson, AZ | 2.0 | 1.0–1.5 | 645 | $1,075 | $1.67 | 3d | 29 | 0.91mi |
| 1625 E Prince Rd Tucson, AZ | 2.0 | 1.0 | 716 | $974 | $1.36 | 43d | 2 | 0.91mi |
| 446 E Pastime Rd Tucson, AZ | 1.0–2.0 | 1.0 | 750 | $1,095 | $1.46 | 3d | 2 | 0.92mi |
| 3700 N Campbell Ave Tucson, AZ | 1.0–2.0 | 1.0–2.0 | 643 | $1,309 | $2.04 | 1d | 41 | 0.99mi |
| 2400 E River Rd Tucson, AZ | 1.0–2.0 | 1.0–2.0 | 1078 | $1,800 | $1.67 | 3d | 1 | 1.01mi |
| 1730 E Prince Rd Unit 4 Tucson, AZ | 2.0 | 1.0 | 550 | $1,000 | $1.82 | 3d | 1 | 1.04mi |
| 5025 N 1st Ave Tucson, AZ | 1.0–2.0 | 1.0–2.0 | 640 | $1,200 | $1.88 | 43d | 1 | 1.05mi |
HOA detail
- Monthly dues
- $540 · $6,480/yr
- Likely covers
- pool
Listing history 15 events
-
2026-06-18days on market $65,000 Active 138 DOM
-
2026-06-17days on market $65,000 Active 137 DOM
-
2026-06-16days on market $65,000 Active 136 DOM
-
2026-06-15days on market $65,000 Active 135 DOM
-
2026-06-13days on market $65,000 Active 133 DOM
-
2026-06-10days on market $65,000 Active 130 DOM
-
2026-06-09days on market $65,000 Active 129 DOM
-
2026-06-08days on market $65,000 Active 128 DOM
-
2026-06-07days on market $65,000 Active 127 DOM
-
2026-06-05days on market $65,000 Active 124 DOM
-
2026-06-03days on market $65,000 Active 123 DOM
-
2026-06-02days on market $65,000 Active 122 DOM
-
2026-06-01days on market $65,000 Active 121 DOM
-
2026-05-31days on market $65,000 Active 120 DOM
-
2026-01-30$69,000 Active 144-char remark
Show marketing remark (144 chars)
Must see this economical recently renovated 3 bedroom, 2 bath home! Community has a club house, swimming pool and more! This will not last long!
ⓘ Source: listings_history table (triggers on properties + properties_extension) + one-shot
backfill from property_details.listing_events for pre-trigger history.
Climate risk First Street
- Flood 1/10 Low FEMA zone X (unshaded) · 0% chance over 30 yrs
- Wildfire 7/10 Severe
- Heat 8/10 Severe 7 d/yr ≥107°F today · 17 d/yr by 30 yrs out
- Wind 1/10 Low
- Air quality 1/10 Low 0 unhealthy d/yr today · 0 by 30 yrs out
Nearby sold comps map
Loading sold comps map…
Walkable amenities ~0.75 mi
Loading nearby amenities…
Taxation est. · year 1
- Rental income
- $18,070
- − Mortgage interest
- −$3,641
- − Property taxes
- −$975
- − Insurance
- −$325
- − Repairs & maintenance
- −$1,446
- − Management
- −$1,446
- − HOA
- −$6,480
- − Depreciation
- −$1,891
- Taxable income
- $1,867
- Est. tax owed @ 24.0%
- −$448
- After-tax cash flow
- $1,957/yr
For passive investors: Depreciation is non-cash, so a rental often shows a tax loss while cash-flowing — sheltering income. Rental losses are passive: they offset passive income freely, and up to $25,000/yr can offset ordinary (W-2) income if you actively participate and your MAGI is under $100k (phasing out to $0 by $150k); unused losses carry forward. On sale, claimed depreciation is recaptured at up to 25%, and gains may owe capital-gains tax (a 1031 exchange can defer both). Figures are a year-1 estimate at your 24.0% rate — not tax advice; consult a CPA.
Condition & rehab AI · 12 photos
This recently renovated 3-bedroom, 2-bath home is move-in ready with new flooring, appliances, and paint. It offers a good return on investment with its curb appeal and updated interior.
Value-add opportunities
- Both Painting exterior — Enhances curb appeal and value
- Both Landscaping — Improves curb appeal and value
- Both New flooring in living areas — Enhances aesthetics and value
Renovation cost estimate screening
Value-add ROI direction
- Both Painting exterior — Enhances curb appeal and value ↑
- Both Landscaping — Improves curb appeal and value ↑
- Both New flooring in living areas — Enhances aesthetics and value ↑
ⓘ Cost ranges are severity-bucket heuristics (US national rule-of-thumb). Get contractor quotes + a written scope before underwriting a rehab budget.
Schools (NCES district)
- District
- Amphitheater Unified District (4406)
- NCES district ID
- 0400680
- Math proficiency
- 32% ▼ -13.00%
- Reading proficiency
- 40% ▼ -8.00%
- Median HH income
- $46,524
- Composite
- 30.82/100
- National rank
- #6135
- State rank
- #85 of 249 in AZ
Livability — Tucson
- Score
- 74/100
- State rank
- #17
- US rank
- #4502
Category grades
Schools grade is shown separately in the Schools card above.
Census & demographics
- Census place
- Tucson, AZ
- County
- Pima County · 1,012,107 people
- City population
- 839,336
- Metro
- Tucson, AZ
- Population (ZIP)
- 51,833
- Household income
- $42,241
- Rent vs Own
- Severe rent burden
- 4906.0
Population outlook (Pima County) Hauer SSP2
- Today (2025)
- 1,066,056 people
- By 2030
- 1,086,684 · +1.9%
- By 2040
- 1,117,160 · +4.8%
- By 2050
- 1,149,778 · +7.9%
- By 2075
- 1,271,480 · +19.3%
- By 2100
- 1,321,160 · +23.9%
Race, ethnicity, and origin ACS 2023
- Neighborhood character
- Diverse neighborhood (Simpson 0.59)
- Race & ethnicity
- White 58% Hispanic / Latino 26% Two or more races 13% Asian 6% Black 4% Native American 2%
- Hispanic origin (detail)
- Mexican 20% Puerto Rican 1%
- Common ancestry
- Romanian 3% Lithuanian 2% Scotch-Irish 2%
- Foreign-born
- 12% · Canada, China, Vietnam
- Languages at home
- 77% English-only · Spanish 14% Other Indo-European 2% Chinese 2%
Political lean MEDSL · Pima
- 2024 margin
- D (+15.2) · D 57.0% · R 41.8% · Other 1.2%
- 2008→2024 swing
- +9.1pp toward D · 2008: 6.1pp · 2024: 15.2pp
- All cycles
- 2024: D+15.2 2020: D+18.7 2016: D+13.5 2012: D+5.8 2008: D+6.1
Not yet ingested
- Civics
- —
Market trends
- HPI YoY
- ▼ -545.74%
- Current HPI
- 279.865
- Rent YoY
- ▲ 1.45%
- Metro
- Tucson, AZ
- State GDP YoY
- ▲ 4.54%
- F500 in state
- 20
Industry mix (Fortune 500 HQ in AZ)
| Industry | F500 HQs | Revenue |
|---|---|---|
| Technology | 2 | $13B |
|
||
| Mining / Metals | 1 | $23B |
|
||
| Environmental Services | 1 | $16B |
|
||
| Metals / Steel | 1 | $14B |
|
||
| Technology Distribution | 1 | $9B |
|
||
| Homebuilding | 1 | $8B |
|
||
Price history
1 event — show timeline
- 2026-01-30 Listed $69,000 MLSSAZ
Cash-flow waterfall
monthlySold comps — $/sqft
last 12 mo · ≤1 miLoading sold comps…