7001 State Rd · Parma, OH
Flood risk 1/10 · Minimal
- FEMA flood zone
- X (unshaded)
- Chance of flooding over 30 yrs
- 0.0%
- Est. flood insurance / yr
- $473 – $860
Fire risk 1/10 · Minimal
- Est. fire insurance / yr
- $713 – $1,323
Heat risk 2/10 · Minimal
- Hot days now (above 94°F)
- 7 days/yr
- Hot days in 30 yrs
- 17 days/yr
Wind risk 1/10 · Minimal
- Chance of severe wind over 30 yrs
- —
Air-quality risk 3/10 · Minor
- Unhealthy air days now
- 2 days/yr
- Unhealthy air days in 30 yrs
- 4 days/yr
Risk factors via First Street. Map © Google.
Why this score? — see what drove the C grade
The composite is a weighted blend of 9 inputs, each scored 0–100. Each bar is that input's sub-score; the figure is the points it added to the 100-point composite (weight × sub-score).
- Cash flow +17.0/30.0
- ARV discount +15.0/15.0
- DSCR +5.3/10.0
- 1% rule +5.2/10.0
- Rent growth +5.0/5.0
- Schools +4.1/10.0
- Livability +4.1/5.0
- Condition / age +2.5/5.0
- Appreciation +0.0/10.0
$199,900
🖨 Deal sheet 📄 Offer letter ✓ Due diligence
Listing remarks MLS
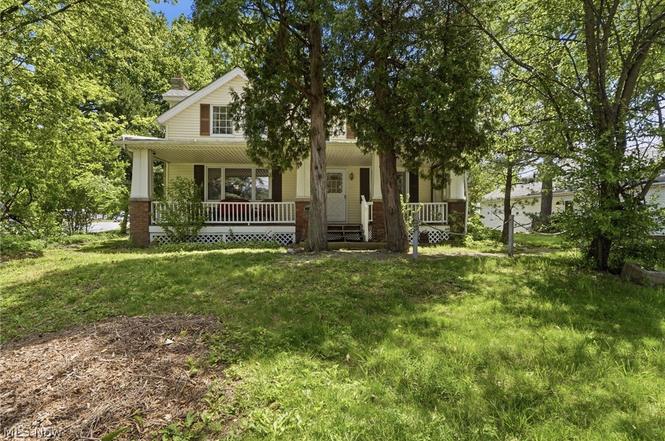
Front porch living and character stand out in this Parma home! This 4 bedroom, 2 bathroom home features a huge front porch, perfect for enjoying those fall nights! As you walk in, you are immediately greeted by character and charm. The living room boasts a brick fireplace and wood beams on the ceiling. The kitchen features stain-glass cabinets, tons of storage, and a breakfast bar. The backyard featured a partially fenced in lot, stone wall landscape, a back deck and plenty of room for a dog to roam or a swing set. With your own personal touches, this home’s charm and character will shine. Don’t let this one pass by, call now to view this home!
Key facts
- Covered front porch
- Unique garage
- Beamed ceilings
Tags
Property features AI
Exterior
- Parking: Detached garage with garage door opener; Driveway
- Utilities: Public water; Public sewer
- Home design: Two-story home
- Construction: Vinyl siding; Asphalt/fiberglass roof
- Exterior features: Covered front and side porches; Lot faces west
Interior
- Kitchen: Range; Refrigerator
- Bedrooms: One main-level bedroom
- Bathrooms: Two full bathrooms; One half bathroom; Two main-level bathrooms
- Interior features: Beamed ceilings; Breakfast bar; Ceiling fan(s); Crown molding; Jetted tub; Double pane windows; Window treatments; Gas-log, gas-starter, and wood-burning fireplace (1)
- Laundry & utility: Washer; Dryer; Laundry located on main level
Neighborhood map
What this means for you Summary
Snapshot
- This is a 3-bed/2.0-bath single-family listed at $200k.
Deal economics
- At list price, monthly cash flow is $136 ($2k/yr) — positive.
- The deal already cash-flows at list — no discount required.
- Meets the 1% rule at list price ($2k rent vs $200k).
- Cap rate 7.1% vs local median 5.0% in Parma — top-decile yield for the area; either an underpriced asset or a hidden risk that comps aren't pricing in. Stress-test before assuming the spread holds.
Location & tenants
- Location reads 82/100 on livability (#84 in OH, #1,232 nationally) — a professional / high-income tenant draw. Strengths: crime A+, amenities A+, cost of living A+; Watch: employment C-, commute F.
- Parma City (suburban): math 43% / reading 52% proficiency, ranked #469 of 656 in OH (top 72%) — families likely to look elsewhere, expect single-tenant / working-renter base with shorter leases.
- Market conditions: Rents rising fast (+10.6%/yr); 118 active listings in the ZIP; 3 comparable units currently listed for rent nearby; rentals lingering (median 44d on market — plan ~5-8 weeks vacancy on turnover, expect pricing pressure); 67% of comp listings sitting > 30 days — soft ceiling on asking rent; 1,441 units permitted in Cuyahoga County in 2024 (700 in 5+ unit buildings).
- This rent runs 36% of the median local income ($69k/yr) — at the standard rent-burdened threshold; future hikes will face affordability resistance.
Forward outlook
- Local home prices are declining (-3.0%/yr); year-one equity from $1k of loan paydown is wiped out by about $6k of value loss. Plan a longer hold.
- Cuyahoga County population projected to shrink 8% by 2050 — rents likely to lag national; underwrite the cash flow, not the appreciation.
- At projected returns (-3.0% appreciation + 8.0% rent growth), your $56k cash investment doubles in ~10 years — after that, you're playing with house money.
Negotiation context
- Only 1 days on market — expect competitive offers; lowballing is unlikely to land.
- 13 sale attempts since 21y ago with the ask held roughly flat each time — persistent listings suggest the price (not the market) is what's stuck; bring a comps-based counter.
- Current owner paid $113k; list at $200k implies a 77% gain — meaningful room to come down on a strong offer.
Risks & watch-outs
- Watch-outs: built in 1910 — expect roof / HVAC / electrical / plumbing capex.
Questions for the listing agent
- Built in 1910 — when were the roof, HVAC, electrical panel, plumbing, and water heater last replaced?
- Is there a deadline driving the sale (1031 exchange, divorce, estate, relocation)? That informs how much negotiation room exists.
- Schools are B-rated — typically a magnet for longer-tenancy family renters. What's the average tenant stay here, and is there a school-zone premium baked into asking?
- What's the average days-on-market for RENTAL listings here right now (not sales)? A rising rental-DOM trend means longer vacancies and softer asking-rent achievability than the comps imply.
- What's the recent tenant-quality profile in this submarket — average credit score on applications, eviction rate, late-payment / NSF rate, and stable-employment percentage? A property-management company in the area should have these aggregated.
- How much new for-sale + rental construction is in the pipeline within 1–3 miles? Heavy new supply typically softens prices + rents 12–24 months out; constrained supply supports both.
Investment metrics
- 1% rule
- 1.02% ✓
- Cap rate
- 7.11%
- Cash-on-cash
- 2.91%
- DSCR
- 1.13
- GRM
- 8.2
CMA / ARV
- ARV (on-the-fly)
- $270,864
- Comps found
- 12
Show comp detail 12 sales within ~0.75 mi
| Address | Dist | Beds/Ba | Sqft | Sold | Price | $/sf | Match |
|---|---|---|---|---|---|---|---|
| 4326 Wood Thrush Dr | 0.31mi | 3/1.5 | 1,812 (+2%) | 9mo | $275,000 | $152 | 73 |
| 3195 Marda Dr | 0.44mi | 3/1.5 | 1,725 (-3%) | 7mo | $260,000 | $151 | 67 |
| 3803 Center Dr | 0.30mi | 3/1.0 | 1,560 (-12%) | 0mo | $200,000 | $128 | 61 |
| 5216 Sassafras Dr | 0.63mi | 3/2.5 | 1,869 (+5%) | 2mo | $244,000 | $131 | 59 |
| 3327 Nottingham Dr | 0.51mi | 3/1.0 | 1,632 (-8%) | 0mo | $275,000 | $169 | 58 |
| 5906 Williston Dr | 0.71mi | 3/1.5 | 1,708 (-4%) | 3mo | $260,000 | $152 | 55 |
| 5301 Regency Dr | 0.67mi | 4/2.5 (+1) | 1,838 (+3%) | 2mo | $340,000 | $185 | 55 |
| 2960 Hetzel Dr | 0.58mi | 3/1.5 | 1,672 (-6%) | 8mo | $194,500 | $116 | 54 |
| 3061 Hilltop Dr | 0.52mi | 4/2.5 (+1) | 1,632 (-8%) | 4mo | $303,000 | $186 | 52 |
| 6001 Williston Dr | 0.71mi | 3/1.5 | 1,692 (-5%) | 8mo | $251,000 | $148 | 50 |
| 2838 Marda Dr | 0.61mi | 3/2.0 | 1,524 (-14%) | 4mo | $220,000 | $144 | 44 |
| 6015 Ely Vista Dr | 0.70mi | 3/3.0 | 1,624 (-9%) | 8mo | $360,000 | $222 | 42 |
Match score weights: distance 35% · size 25% · config 20% · recency 20%. Top-matched comps best support the ARV.
Projected returns pro-forma
-3.0% appreciation · 8.0% rent growth · sell at horizon
- IRR
- -5.9%
- Equity multiple
- 0.77×
- Total profit
- $-12,889
- Equity at exit
- $29,806
- IRR
- 9.2%
- Equity multiple
- 1.88×
- Total profit
- $49,270
- Equity at exit
- $17,284
Cash invested: $55,972 (down + closing). Projections, not guarantees.
Landlord ↔ Tenant lean methodology
- Overall (STATE)
- 73 Landlord-Friendly
- State Ohio
- 73 Landlord-Friendly · R+6
- County
- — inherits STATE
- City
- — inherits STATE
ZIP-level market 44134
- Rents YoY
- 10.6%
- Active inventory
- 118
- Price-to-rent
- 8.2×
Monthly cashflow live
- Estimated rent
- $2,037 medium interval (Pro) →
- Mortgage (P&I)
- −$1,048
- Tax from tax record
- −$342 /mo · $4,104/yr
- Insurance
- −$83
- HOA
- −$0
- Vacancy / Maint / Mgmt
- −$428
- Net cashflow
- $136
Break-even live
UW: 25.0% down · 7.5% · 30yr · 1.5% tax · 5.0% vac · 8.0% maint · 8.0% mgmt
Financing live
Cash to close
- Down payment
- $49,975
- Closing costs
- $5,997
- Reserves months
- —
- Total cash needed
- —
Loan-product check · same deal, 3 products live
Conventional
25% down · 7.5% · 30yr
- Down + closing
- —
- Monthly P&I
- —
- Monthly cashflow
- —
- DSCR
- —
- Eligible?
- —
Personal DTI + credit; lowest rate.
DSCR
20% down · 8.5% · 30yr
- Down + closing
- —
- Monthly P&I
- —
- Monthly cashflow
- —
- DSCR
- —
- Eligible?
- —
No personal income docs; deal must DSCR.
Hard money
10% down · 12.0% · 12mo
- Down + closing
- —
- Monthly P&I
- —
- Monthly cashflow
- —
- DSCR
- —
- Eligible?
- —
Short-term bridge; refi at stabilization.
Rent comps 3 comps
| Address | Beds | Baths | Sqft | Rent | $/sqft | DOM | Units | Dist |
|---|---|---|---|---|---|---|---|---|
| 5080 Whispering Oaks BLVD Parma, OH | 3.0 | 2.0 | 1332 | $1,799 | $1.35 | 12d | 1 | 0.63mi |
| 6924 Day Dr Cleveland, OH | 3.0 | 2.0 | 2104 | $2,200 | $1.05 | 43d | 1 | 0.74mi |
| 4191 W Ridgewood Dr Unit 4193 Parma, OH | 4.0 | 3.0 | 1800 | $1,950 | $1.08 | 43d | 1 | 0.83mi |
Listing history 2 events
-
2026-06-19remarks 699-char remark
-
2026-06-19$199,900 Active 1 DOM
ⓘ Source: listings_history table (triggers on properties + properties_extension) + one-shot
backfill from property_details.listing_events for pre-trigger history.
Tax reassessment forecast OH · Partial reset (capped growth)
- Current annual tax
- $4,104 · $342/mo
- Projected year-2 tax
- $4,104 · $342/mo
- Expected delta
- $0/yr ($0/mo · 0.0%)
ⓘ Screening estimate from a state-policy table — verify with the county assessor before closing.
Climate risk First Street
- Flood 1/10 Low FEMA zone X (unshaded) · 0% chance over 30 yrs
- Wildfire 1/10 Low
- Heat 2/10 Low 7 d/yr ≥94°F today · 17 d/yr by 30 yrs out
- Wind 1/10 Low
- Air quality 3/10 Moderate 2 unhealthy d/yr today · 4 by 30 yrs out
Nearby sold comps map
Loading sold comps map…
Walkable amenities ~0.75 mi
Loading nearby amenities…
Taxation est. · year 1
- Rental income
- $24,446
- − Mortgage interest
- −$11,198
- − Property taxes
- −$4,104
- − Insurance
- −$1,000
- − Repairs & maintenance
- −$1,956
- − Management
- −$1,956
- − Depreciation
- −$5,815
- Taxable loss
- −$1,581
- Est. tax savings @ 24.0%
- +$379
- After-tax cash flow
- $2,009/yr
For passive investors: Depreciation is non-cash, so a rental often shows a tax loss while cash-flowing — sheltering income. Rental losses are passive: they offset passive income freely, and up to $25,000/yr can offset ordinary (W-2) income if you actively participate and your MAGI is under $100k (phasing out to $0 by $150k); unused losses carry forward. On sale, claimed depreciation is recaptured at up to 25%, and gains may owe capital-gains tax (a 1031 exchange can defer both). Figures are a year-1 estimate at your 24.0% rate — not tax advice; consult a CPA.
Schools (NCES district)
- District
- Parma City
- NCES district ID
- 3904463
- Math proficiency
- 43% ▼ -18.00%
- Reading proficiency
- 52% ▼ -10.00%
- Median HH income
- $50,371
- Composite
- 40.72/100
- National rank
- #3662
- State rank
- #469 of 656 in OH
Livability — Parma
- Score
- 82/100
- State rank
- #84
- US rank
- #1232
Category grades
Schools grade is shown separately in the Schools card above.
Census & demographics
- Census place
- Parma, OH
- County
- Cuyahoga County · 1,090,369 people
- City population
- 66,574
- Metro
- Cleveland-Elyria, OH
- Population (ZIP)
- 37,774
- Household income
- $68,625
- Rent vs Own
- Severe rent burden
- 668.0
Population outlook (Cuyahoga County) Hauer SSP2
- Today (2025)
- 1,244,621 people
- By 2030
- 1,230,093 · -1.2%
- By 2040
- 1,189,108 · -4.5%
- By 2050
- 1,145,706 · -7.9%
- By 2075
- 1,076,557 · -13.5%
- By 2100
- 978,987 · -21.3%
Race, ethnicity, and origin ACS 2023
- Neighborhood character
- Predominantly White (85%)
- Race & ethnicity
- White 85% Two or more races 6% Hispanic / Latino 5% Black 3% Asian 3%
- Common ancestry
- Romanian 14% Subsaharan African 6% Slovak 1%
- Foreign-born
- 11% · Canada, Vietnam
- Languages at home
- 84% English-only · Russian/Polish/Slavic 7% Spanish 3% Other Indo-European 2%
Political lean MEDSL · Cuyahoga
- 2024 margin
- Solid D (+31.5) · D 65.4% · R 33.9%
- 2008→2024 swing
- -7.4pp toward R · 2008: 38.9pp · 2024: 31.5pp
- All cycles
- 2024: D+31.5 2020: D+34.1 2016: D+35.0 2012: D+38.7 2008: D+38.9
Not yet ingested
- Civics
- —
Market trends
- HPI YoY
- ▼ -215.17%
- Current HPI
- 184.0553
- Rent YoY
- ▲ 10.56%
- Metro
- Cleveland-Elyria, OH
- State GDP YoY
- ▲ 1.98%
- F500 in state
- 48
Industry mix (Fortune 500 HQ in OH)
| Industry | F500 HQs | Revenue |
|---|---|---|
| Insurance | 3 | $145B |
|
||
| Industrial Machinery | 3 | $49B |
|
||
| Financial Services | 3 | $24B |
|
||
| Consumer Goods | 2 | $93B |
|
||
| Aerospace / Defense | 2 | $47B |
|
||
| Utilities | 2 | $33B |
|
||
Price history
+455.3% since first listed35 events — show timeline
- 2026-06-18 Listed $199,900 MLSNOW
- 2017-05-16 Sold (Public Records) $112,900 Public Records
- 2017-05-16 Sold (MLS) $112,900 FAOR
- 2017-05-16 Sold (MLS) $112,900 MLSNOW
- 2017-03-10 Pending — MLSNOW
- 2017-02-27 Contingent — MLSNOW
- 2017-02-27 Listing Removed — MLSNOW
- 2016-11-01 Relisted — MLSNOW
- 2016-10-24 Pending — MLSNOW
- 2016-10-04 Relisted — MLSNOW
- 2016-09-15 Pending — MLSNOW
- 2016-08-22 Listed $112,900 MLSNOW
- 2016-08-22 Listed $112,900 FAOR
- 2016-06-30 Listing Removed — MLSNOW
- 2016-05-21 Price Changed $112,900 MLSNOW
- 2016-05-20 Relisted — MLSNOW
- 2016-03-18 Contingent — MLSNOW
- 2016-02-11 Price Changed $109,900 MLSNOW
- 2016-02-08 Price Changed $111,500 MLSNOW
- 2016-02-08 Relisted — MLSNOW
- 2016-01-31 Pending — MLSNOW
- 2015-06-01 Listed $112,500 MLSNOW
- 2015-05-25 Listing Removed — MLSNOW
- 2015-04-14 Price Changed $115,000 MLSNOW
- 2015-03-04 Listed $119,900 MLSNOW
- 2014-05-20 Listing Removed — MLSNOW
- 2013-12-05 Listed $129,000 MLSNOW
- 2006-08-23 Sold (Public Records) $120,000 Public Records
- 2006-08-23 Sold (MLS) $120,000 MLSNOW
- 2006-01-05 Listed $129,900 MLSNOW
- 2005-12-20 Listing Removed — MLSNOW
- 2005-10-31 Listed $147,500 MLSNOW
- 2005-10-28 Listing Removed — MLSNOW
- 2005-07-28 Listed $149,900 MLSNOW
- 1978-06-01 Sold (Public Records) $36,000 Public Records
Property tax history
+8.3%/yrLatest (2025): $4,104 · -5.5% YoY. Source: county tax records.
Cash-flow waterfall
monthlySold comps — $/sqft
last 12 mo · ≤1 miLoading sold comps…