 Duplex
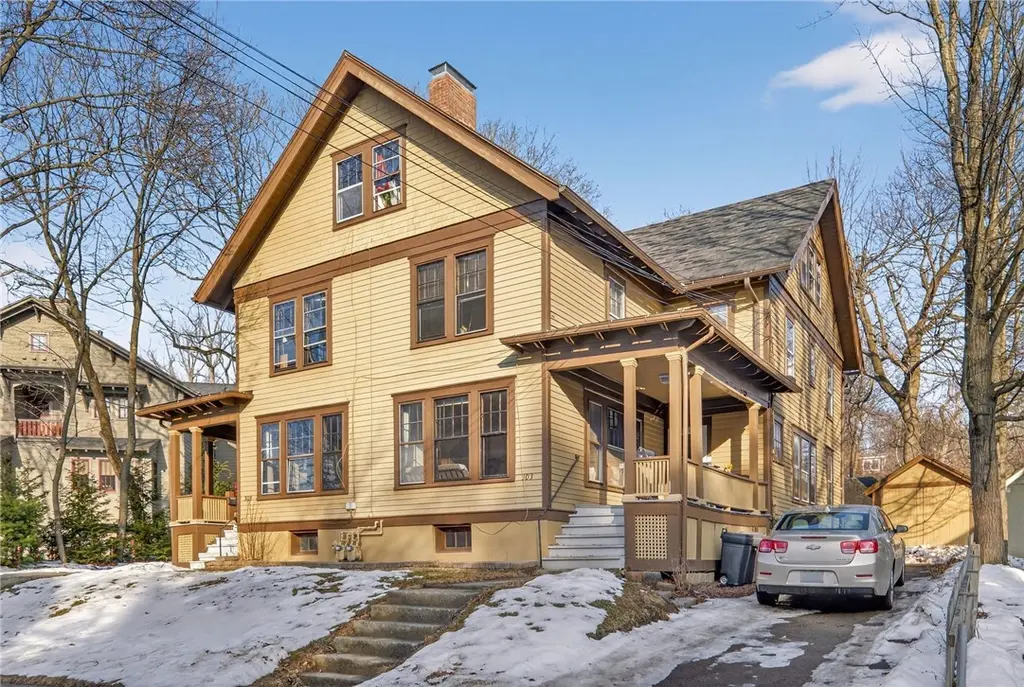
303-305 Wyckoff Ave · Ithaca, NY
Flood risk 1/10 · Minimal
- FEMA flood zone
- X
- Chance of flooding over 30 yrs
- 0.0%
- Est. flood insurance / yr
- $473 – $860
Fire risk 1/10 · Minimal
- Est. fire insurance / yr
- $691 – $1,283
Heat risk 3/10 · Minor
- Hot days now (above 94°F)
- 7 days/yr
- Hot days in 30 yrs
- 15 days/yr
Wind risk 1/10 · Minimal
- Chance of severe wind over 30 yrs
- 1.0%
Air-quality risk 2/10 · Minimal
- Unhealthy air days now
- 0 days/yr
- Unhealthy air days in 30 yrs
- 1 days/yr
Risk factors via First Street. Map © Google.
Why this score? — see what drove the F grade
The composite is a weighted blend of 9 inputs, each scored 0–100. Each bar is that input's sub-score; the figure is the points it added to the 100-point composite (weight × sub-score).
- ARV discount +7.5/15.0
- Cash flow +7.1/30.0
- Schools +5.4/10.0
- Livability +3.9/5.0
- Rent growth +3.8/5.0
- 1% rule +2.8/10.0
- Condition / age +2.5/5.0
- DSCR +1.3/10.0
- Appreciation +0.0/10.0
$675,000
🖨 Deal sheet 📄 Offer letter ✓ Due diligence
Multi-family units
County records classify this as Multi-Family (2-4 Unit). Listing-text estimate: 2 units. confirmed
Listing remarks MLS
Massive side-by-side duplex with unrivaled proximity to Cornell University campus. This 8 bedroom 4,800+ sq ft building marks a rare opportunity to acquire multi-unit property in the Cornell Heights neighborhood. Large room sizes and grandiose layouts make each unit well suited for continuous rental and value-add opportunities. Or, live on one side and rent the other! Two separate driveways for each unit’s off-street parking. Ample storage and bonus spaces. Steady, consistent cash-flow throughout life of ownership, as well as routine maintenance and capital expenditures. Beautiful hardwood, flooring and ornate wood details throughout. EACH UNIT IS SEPARATELY METERED FOR ELECTRIC, GAS, AND WATER/SEWER. Sq. footage derived from 3rd party floorplans and varies from assessment. Call your agent today!
Key facts
- Ample storage space
- Bonus spaces
- Side-by-side duplex
Tags
Neighborhood map
What this means for you Summary
Snapshot
- This is a 2 × 4-bed/1.5-bath units multifamily listed at $675k.
Deal economics
- At list price, monthly cash flow is $-945 ($-11k/yr) — negative. Per door: $-473/mo.
- To cash-flow at today's rent, offer at most $508k (24.7% below list).
- To meet the 1% rule (rent ≥ 1% of price), the offer needs to be $524k (22.3% below list).
- Recommended offer: $508k (24.7% below list) — sets the bar for cash-flow.
Location & tenants
- Location reads 77/100 on livability (#210 in NY, #3,240 nationally) — a middle-class / working-renter tenant base. Strengths: amenities A+, commute A+, health & safety A+; Watch: housing C-, employment D+, cost of living D.
- Ithaca City School District (urban): math 57% / reading 71% proficiency, ranked #195 of 590 in NY (top 33%) — acceptable for families but not a draw, mixed tenant base, ~2y average lease.
- Market conditions: Rents rising fast (+5.2%/yr); 327 active listings in the ZIP; 382 units permitted in Tompkins County in 2024 (208 in 5+ unit buildings).
- At $5,243/mo this rent would consume 88% of the median local household income ($71k/yr) (locally 5169% of renters already pay >50% of income on rent) — very limited rent-growth headroom before tenants either downsize or default.
Forward outlook
- Local home prices are declining (-3.0%/yr); year-one equity from $5k of loan paydown is wiped out by about $20k of value loss. Plan a longer hold.
- Tompkins County population projected at +17% by 2050 — long-run rental-demand tailwind backs the buy-and-hold thesis.
Negotiation context
- It's been on market 108 days — a 9% lower offer ($614k) is reasonable based on typical stale-listing flexibility.
- 2 sale attempts since 3y ago; this cycle's ask has dropped $50k (7%) from the opening price — seller is motivated, your offer sets the floor, not the list.
- Current owner paid $315k; list at $675k implies a 114% gain — meaningful room to come down on a strong offer.
Risks & watch-outs
- Watch-outs: built in 1915 — expect roof / HVAC / electrical / plumbing capex.
Questions for the listing agent
- What do current leases actually rent for vs. the listed asking? Can we see a recent rent roll and the last 12 months of T-12 income?
- It's been on market 108 days. Have you received any prior offers? Is the seller open to a 25% concession, seller financing, or rate buy-down credit?
- Can we see the unit-by-unit rent roll, current vacancy, and any below-market leases? What's the average tenancy length?
- What capital expenditures (roof, boiler, parking lot, exteriors) have been made in the last 5 years, and what's planned in the next 2?
- Built in 1915 — when were the roof, HVAC, electrical panel, plumbing, and water heater last replaced?
- Why hasn't it sold? Are there any deal-killer items the seller is aware of (foundation, flood, title, zoning, code violations)?
- Is there a deadline driving the sale (1031 exchange, divorce, estate, relocation)? That informs how much negotiation room exists.
- Schools are A-rated — typically a magnet for longer-tenancy family renters. What's the average tenant stay here, and is there a school-zone premium baked into asking?
- The area grade is low — what's the realistic commute time and amenity access for the typical tenant pool here? Any planned neighborhood developments (good or bad) we should know about?
- What's the average days-on-market for RENTAL listings here right now (not sales)? A rising rental-DOM trend means longer vacancies and softer asking-rent achievability than the comps imply.
- What's the recent tenant-quality profile in this submarket — average credit score on applications, eviction rate, late-payment / NSF rate, and stable-employment percentage? A property-management company in the area should have these aggregated.
- How much new apartment / multifamily construction is in the pipeline within 1–3 miles? Heavy new supply (>2% of stock underway) typically softens rents 12–24 months out; light construction supports rent growth.
Investment metrics
- 1% rule
- 0.78% ✗
- Cap rate
- 4.61%
- Cash-on-cash
- -6.00%
- DSCR
- 0.73
- GRM
- 10.7
CMA / ARV
- ARV (median comp)
- $1,731,778
- List price
- $675,000
- Delta
- -61.02%
- Verdict
- UNDERPRICED
- Comps
- 2 within 1.0 mi
Projected returns pro-forma
-3.0% appreciation · 5.22% rent growth · sell at horizon
- IRR
- -23.8%
- Equity multiple
- 0.17×
- Total profit
- $-157,273
- Equity at exit
- $100,645
- IRR
- -13.3%
- Equity multiple
- 0.14×
- Total profit
- $-161,690
- Equity at exit
- $58,362
Cash invested: $189,000 (down + closing). Projections, not guarantees.
Landlord ↔ Tenant lean methodology
- Overall (STATE)
- 15 Strongly Tenant-Friendly
- State New York
- 15 Strongly Tenant-Friendly · D+10
- County
- — inherits STATE
- City
- — inherits STATE
ZIP-level market 14850
- Rents YoY
- 5.2%
- Active inventory
- 327
- Price-to-rent
- 21.5×
Monthly cashflow live
- Estimated rent
- $5,243 medium interval (Pro) →
- Mortgage (P&I)
- −$3,540
- Tax from tax record
- −$1,266 /mo · $15,194/yr
- Insurance
- −$281
- HOA
- −$0
- Vacancy / Maint / Mgmt
- −$1,101
- Net cashflow
- $-945
Break-even live
2-unit breakdown (identical units grouped — click to expand)
| Units | Beds | Baths | Est. rent |
|---|---|---|---|
| 2× units | 4 | 1.5 | $5,244 |
| #1 | 4 | 1.5 | $2,622 |
| #2 | 4 | 1.5 | $2,622 |
| Total (2 units) | $5,243 | ||
UW: 25.0% down · 7.5% · 30yr · 1.5% tax · 5.0% vac · 8.0% maint · 8.0% mgmt
Financing live
Cash to close
- Down payment
- $168,750
- Closing costs
- $20,250
- Reserves months
- —
- Total cash needed
- —
Loan-product check · same deal, 3 products live
Conventional
25% down · 7.5% · 30yr
- Down + closing
- —
- Monthly P&I
- —
- Monthly cashflow
- —
- DSCR
- —
- Eligible?
- —
Personal DTI + credit; lowest rate.
DSCR
20% down · 8.5% · 30yr
- Down + closing
- —
- Monthly P&I
- —
- Monthly cashflow
- —
- DSCR
- —
- Eligible?
- —
No personal income docs; deal must DSCR.
Hard money
10% down · 12.0% · 12mo
- Down + closing
- —
- Monthly P&I
- —
- Monthly cashflow
- —
- DSCR
- —
- Eligible?
- —
Short-term bridge; refi at stabilization.
Listing history 20 events
-
2026-06-19days on market $675,000 Active 108 DOM
-
2026-06-18days on market $675,000 Active 107 DOM
-
2026-06-17days on market $675,000 Active 106 DOM
-
2026-06-16days on market $675,000 Active 105 DOM
-
2026-06-15days on market $675,000 Active 104 DOM
-
2026-06-14days on market $675,000 Active 102 DOM
-
2026-06-13days on market $675,000 Active 101 DOM
-
2026-06-10days on market $675,000 Active 99 DOM
-
2026-06-09days on market $675,000 Active 98 DOM
-
2026-06-08days on market $675,000 Active 97 DOM
-
2026-06-07days on market $675,000 Active 96 DOM
-
2026-06-05days on market $675,000 Active 93 DOM
-
2026-06-02days on market $675,000 Active 91 DOM
-
2026-06-01pricedays on market $675,000 Active 90 DOM
-
2026-05-31days on market $725,000 Active 89 DOM
-
2026-05-30days on market $725,000 Active 88 DOM
-
2026-03-03$725,000 Active 813-char remark
Show marketing remark (813 chars)
Massive side-by-side duplex with unrivaled proximity to Cornell University campus. This 8 bedroom 4,800+ sq ft building marks a rare opportunity to acquire multi-unit property in the Cornell Heights neighborhood. Large room sizes and grandiose layouts make each unit well suited for continuous rental and value-add opportunities. Or, live on one side and rent the other! Two separate driveways for each unit’s off-street parking. Ample storage and bonus spaces. Steady, consistent cash-flow throughout life of ownership, as well as routine maintenance and capital expenditures. Beautiful hardwood, flooring and ornate wood details throughout. EACH UNIT IS SEPARATELY METERED FOR ELECTRIC, GAS, AND WATER/SEWER. Sq. footage derived from 3rd party floorplans and varies from assessment. Call your agent today!
-
2023-11-12historical $3,100
-
2023-09-30$3,100
-
2012-06-13soldstatus $315,000
ⓘ Source: listings_history table (triggers on properties + properties_extension) + one-shot
backfill from property_details.listing_events for pre-trigger history.
Tax reassessment forecast NY · Partial reset (capped growth)
- Current annual tax
- $15,194 · $1,266/mo
- Projected year-2 tax
- $15,194 · $1,266/mo
- Expected delta
- $0/yr ($0/mo · -0.0%)
ⓘ Screening estimate from a state-policy table — verify with the county assessor before closing.
Climate risk First Street
- Flood 1/10 Low FEMA zone X · 0% chance over 30 yrs
- Wildfire 1/10 Low
- Heat 3/10 Moderate 7 d/yr ≥94°F today · 15 d/yr by 30 yrs out
- Wind 1/10 Low 100% chance of damaging wind over 30 yrs
- Air quality 2/10 Low 0 unhealthy d/yr today · 1 by 30 yrs out
Nearby sold comps map
Loading sold comps map…
Walkable amenities ~0.75 mi
Loading nearby amenities…
Taxation est. · year 1
- Rental income
- $62,916
- − Mortgage interest
- −$37,810
- − Property taxes
- −$15,194
- − Insurance
- −$3,375
- − Repairs & maintenance
- −$5,033
- − Management
- −$5,033
- − Depreciation
- −$19,636
- Taxable loss
- −$23,167
- Est. tax savings @ 24.0%
- +$5,560
- After-tax cash flow
- $-5,783/yr
For passive investors: Depreciation is non-cash, so a rental often shows a tax loss while cash-flowing — sheltering income. Rental losses are passive: they offset passive income freely, and up to $25,000/yr can offset ordinary (W-2) income if you actively participate and your MAGI is under $100k (phasing out to $0 by $150k); unused losses carry forward. On sale, claimed depreciation is recaptured at up to 25%, and gains may owe capital-gains tax (a 1031 exchange can defer both). Figures are a year-1 estimate at your 24.0% rate — not tax advice; consult a CPA.
Schools (NCES district)
- District
- Ithaca City School District
- NCES district ID
- 3615570
- Math proficiency
- 57% ▼ -5.00%
- Reading proficiency
- 71% ▲ 11.00%
- Median HH income
- $46,528
- Composite
- 54.01/100
- National rank
- #1397
- State rank
- #195 of 590 in NY
Livability — Ithaca
- Score
- 77/100
- State rank
- #210
- US rank
- #3240
Category grades
Schools grade is shown separately in the Schools card above.
Census & demographics
- Census place
- Ithaca, NY
- County
- Tompkins County · 68,610 people
- City population
- 68,610
- Metro
- Ithaca, NY
- Population (ZIP)
- 68,610
- Household income
- $71,445
- Rent vs Own
- Severe rent burden
- 5169.0
Population outlook (Tompkins County) Hauer SSP2
- Today (2025)
- 113,958 people
- By 2030
- 118,774 · +4.2%
- By 2040
- 125,927 · +10.5%
- By 2050
- 133,599 · +17.2%
- By 2075
- 156,759 · +37.6%
- By 2100
- 169,896 · +49.1%
Race, ethnicity, and origin ACS 2023
- Neighborhood character
- Predominantly White (68%)
- Race & ethnicity
- White 68% Asian 13% Hispanic / Latino 8% Two or more races 8% Black 4%
- Hispanic origin (detail)
- Mexican 2% Puerto Rican 2%
- Common ancestry
- Romanian 3% Italian 3% Scotch-Irish 2%
- Foreign-born
- 18% · China, Canada, South Korea
- Languages at home
- 79% English-only · Chinese 5% Spanish 4% Other Indo-European 4%
Political lean MEDSL · Tompkins
- 2024 margin
- Solid D (+50.6) · D 75.3% · R 24.7%
- 2008→2024 swing
- +8.6pp toward D · 2008: 42.1pp · 2024: 50.6pp
- All cycles
- 2024: D+50.6 2020: D+49.2 2016: D+42.1 2012: D+39.8 2008: D+42.1
Not yet ingested
- Civics
- —
Market trends
- HPI YoY
- ▼ -276.59%
- Current HPI
- 389.7215
- Rent YoY
- ▲ 5.22%
- Metro
- Ithaca, NY
- State GDP YoY
- ▲ 2.60%
- F500 in state
- 92
Industry mix (Fortune 500 HQ in NY)
| Industry | F500 HQs | Revenue |
|---|---|---|
| Financial Services | 10 | $950B |
|
||
| Consumer Goods | 9 | $162B |
|
||
| Insurance | 4 | $225B |
|
||
| Telecommunications | 2 | $144B |
|
||
| Pharmaceuticals | 2 | $112B |
|
||
| Media / Entertainment | 2 | $69B |
|
||
Price history
+130.2% since first listed4 events — show timeline
- 2026-03-03 Listed $725,000 IBRMLS
- 2023-11-12 Rental Removed $3,100 APPFOLIO
- 2023-09-30 Listed for Rent $3,100 APPFOLIO
- 2012-06-13 Sold (Public Records) $315,000 Public Records
Property tax history
+0.5%/yrLatest (2025): $15,194 · +2.3% YoY. Source: county tax records.
Cash-flow waterfall
monthlySold comps — $/sqft
last 12 mo · ≤1 miLoading sold comps…