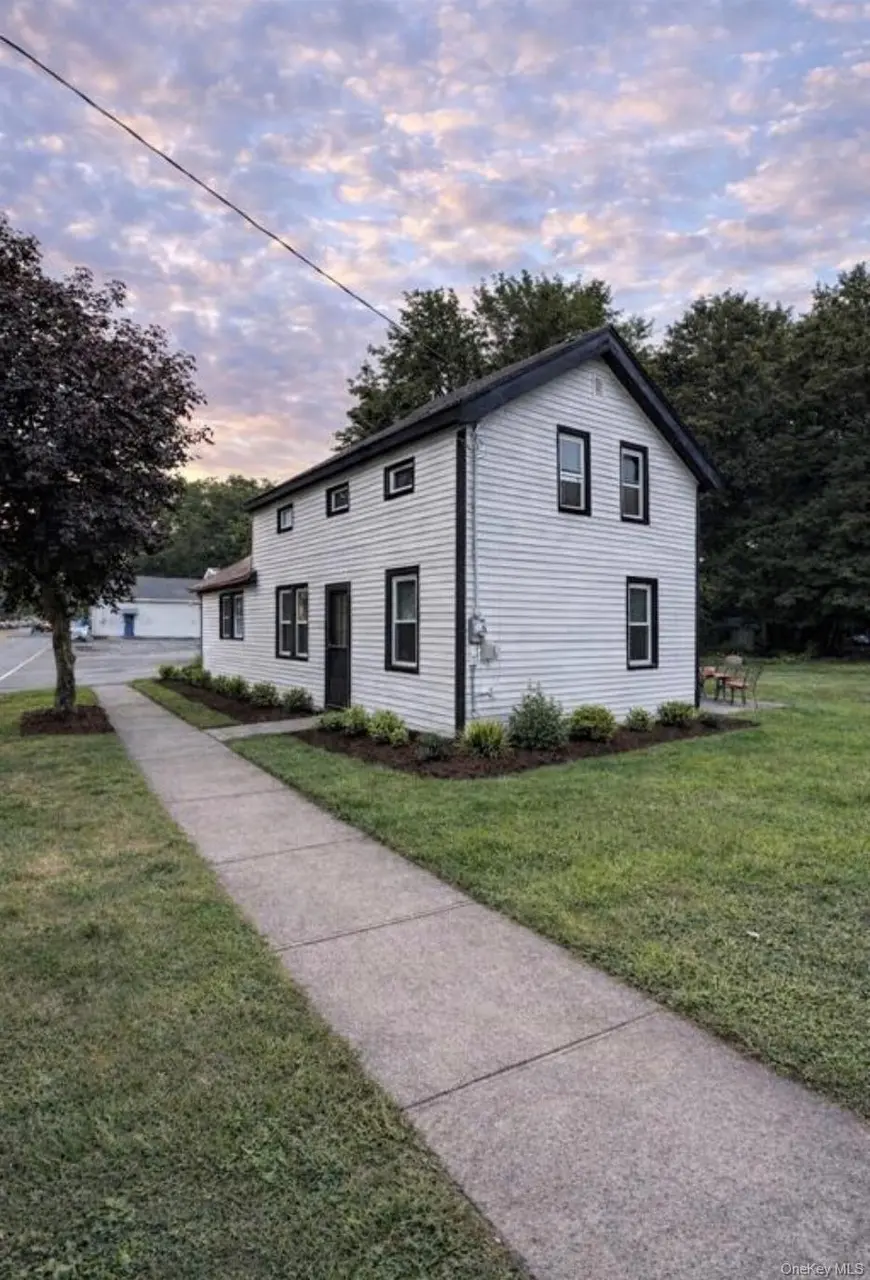
56 Sullivan St · Wurtsboro, NY
Flood risk 8/10 · Major
- FEMA flood zone
- X (unshaded)
- Chance of flooding over 30 yrs
- 0.99%
- Est. flood insurance / yr
- $473 – $860
Fire risk 3/10 · Minor
- Est. fire insurance / yr
- $691 – $1,283
Heat risk 4/10 · Minor
- Hot days now (above 97°F)
- 8 days/yr
- Hot days in 30 yrs
- 17 days/yr
Wind risk 3/10 · Minor
- Chance of severe wind over 30 yrs
- 8.0%
Air-quality risk 2/10 · Minimal
- Unhealthy air days now
- 1 days/yr
- Unhealthy air days in 30 yrs
- 1 days/yr
Risk factors via First Street. Map © Google.
Why this score? — see what drove the B grade
The composite is a weighted blend of 9 inputs, each scored 0–100. Each bar is that input's sub-score; the figure is the points it added to the 100-point composite (weight × sub-score).
- Cash flow +22.8/30.0
- ARV discount +15.0/15.0
- Appreciation +10.0/10.0
- DSCR +7.3/10.0
- 1% rule +6.2/10.0
- Livability +3.5/5.0
- Rent growth +2.5/5.0
- Schools +2.5/10.0
- Condition / age +2.5/5.0
$225,000
🖨 Deal sheet 📄 Offer letter ✓ Due diligence
Listing remarks
Welcome to 56 Sullivan Street, an exciting opportunity in the heart of Wurtsboro. Located along the village’s main commercial corridor and offering C-1 zoning flexibility for permitted commercial or residential use, this turn key 3 bedroom, 1 bath home combines location and versatility. The property features a ground level primary bedroom, full bath, laundry hookup, driveway parking, very low property taxes, a newer septic system, and updated electric. Just steps from local restaurants, coffee shops, antique stores, and a health conscious market, and conveniently located near Route 17 only 90 minutes north of NYC, this home offers both accessibility and small town charm. Call today to
Key facts
- Updated electric
- Newer septic system
- Laundry hookup
Tags
Property features AI
Exterior
- Parking: Driveway
- Utilities: Septic tank; Utilities: see remarks
- Home design: Single family residence
- Construction: Frame construction; Unfinished basement; Scuttle attic
- Exterior features: Frame construction; Not waterfront
Interior
- Kitchen: Oven; Refrigerator; Eat-in, open kitchen layout
- Bedrooms: Includes a bedroom on the first floor
- Flooring: Hardwood floors; Vinyl flooring
- Bathrooms: One full bathroom
- Heating & cooling: Forced air heating; Oil heating; No central cooling
- Interior features: First-floor bedroom; First-floor full bath; Eat-in kitchen; Entrance foyer; Open kitchen; Storage; Bilco door(s) to unfinished basement; Scuttle attic
- Laundry & utility: Washer hookup; Unfinished basement for utilities/storage
Neighborhood map
What this means for you Summary
Snapshot
- This is a 2-bed/1.0-bath single-family listed at $225k.
Deal economics
- At list price, monthly cash flow is $334 ($4k/yr) — positive.
- The deal already cash-flows at list — no discount required.
- Meets the 1% rule at list price ($3k rent vs $225k).
- Recommended offer: $218k (3.0% below list) — sets the bar for market timing.
Location & tenants
- Location reads 70/100 on livability (#453 in NY) — a middle-class / working-renter tenant base. Strengths: crime A+, housing A+, employment A; Watch: amenities F, commute F.
- Monticello Central School District (town): math 29% / reading 30% proficiency, ranked #577 of 590 in NY (top 98%) — low school quality limits family demand, transient renter base, plan for 1-2y turnover.
- Zoned schools: Emma C Chase School (math 32% / reading 47%, grade F, #1,444 of 2,108 statewide, top 71%, 228 students, 57% FRL); Robert J Kaiser Middle School (math 7% / reading 35%, grade F, #661 of 729 statewide, top 91%, 595 students, 66% FRL); Monticello High School (math 82% / reading 34%, grade C, #879 of 1,100 statewide, top 80%, 844 students, 63% FRL).
- Market conditions: 109 active listings in the ZIP; 1 comparable units currently listed for rent nearby; 739 units permitted in Sullivan County in 2024 (5 in 5+ unit buildings).
Forward outlook
- In year one you build about $24k of equity ($2k loan paydown + $22k appreciation (10.0% local appreciation)).
- Sullivan County population projected at -24% by 2050 — secular population decline; favor cash flow + early exit over multi-decade hold.
- At projected returns (10.0% appreciation + 3.0% rent growth), your $63k cash investment doubles in ~3 years — after that, you're playing with house money.
- By year 2, paydown + projected appreciation supports a ~$39k cash-out refi (75% LTV) — recoverable capital for the next deal without selling this one.
Negotiation context
- It's been on market 56 days — a 3% lower offer ($218k) is reasonable based on typical stale-listing flexibility.
- 10 sale attempts since 4y ago; this cycle's ask has dropped $15k (6%) from the opening price — seller is motivated, your offer sets the floor, not the list.
- Current owner paid $50k; list at $225k implies a 350% gain — meaningful room to come down on a strong offer.
Risks & watch-outs
- Watch-outs: flood insurance adds $56/mo; built in 1900 — expect roof / HVAC / electrical / plumbing capex.
- Climate carrying-cost: severe flood risk — expect insurance premiums to compound above CPI over the hold.
Questions for the listing agent
- It's been on market 56 days. Have you received any prior offers? Is the seller open to a 3% concession, seller financing, or rate buy-down credit?
- Built in 1900 — when were the roof, HVAC, electrical panel, plumbing, and water heater last replaced?
- What's the actual annual flood-insurance premium (NFIP or private), and is the property in a SFHA with mandatory coverage?
- Is there a deadline driving the sale (1031 exchange, divorce, estate, relocation)? That informs how much negotiation room exists.
- Schools are F-rated, which usually means shorter tenancies and higher turnover. Who's the typical renter profile here, and what's been the actual vacancy rate?
- What's the average days-on-market for RENTAL listings here right now (not sales)? A rising rental-DOM trend means longer vacancies and softer asking-rent achievability than the comps imply.
- What's the recent tenant-quality profile in this submarket — average credit score on applications, eviction rate, late-payment / NSF rate, and stable-employment percentage? A property-management company in the area should have these aggregated.
- How much new for-sale + rental construction is in the pipeline within 1–3 miles? Heavy new supply typically softens prices + rents 12–24 months out; constrained supply supports both.
Investment metrics
- 1% rule
- 1.12% ✓
- Cap rate
- 8.37%
- Cash-on-cash
- 7.42%
- DSCR
- 1.33
- GRM
- 7.4
CMA / ARV
- ARV (median comp)
- $357,501
- List price
- $225,000
- Delta
- -37.06%
- Verdict
- UNDERPRICED
- Comps
- 20 within 1.0 mi
Show comp detail 6 sales within ~0.75 mi
| Address | Dist | Beds/Ba | Sqft | Sold | Price | $/sf | Match |
|---|---|---|---|---|---|---|---|
| 2 Marc Ln | 0.32mi | 3/1.5 (+1) | 1,356 (-2%) | 14mo | $371,000 | $274 | 64 |
| 19 Third St | 0.33mi | 3/1.0 (+1) | 1,340 (-3%) | 21mo | $283,000 | $211 | 57 |
| 59 Grand St | 0.37mi | 3/1.0 (+1) | 1,352 (-2%) | 23mo | $285,000 | $211 | 55 |
| 259 Kingston Ave | 0.49mi | 3/1.5 (+1) | 1,504 (+9%) | 1mo | $330,000 | $219 | 55 |
| 17 Helm St | 0.60mi | 3/2.0 (+1) | 1,470 (+6%) | 10mo | $300,500 | $204 | 43 |
| 148 Kingston Ave | 0.53mi | 3/1.5 (+1) | 1,311 (-5%) | 22mo | $249,900 | $191 | 41 |
Match score weights: distance 35% · size 25% · config 20% · recency 20%. Top-matched comps best support the ARV.
Projected returns pro-forma
10.0% appreciation · 3.0% rent growth · sell at horizon
- IRR
- 28.9%
- Equity multiple
- 3.28×
- Total profit
- $143,915
- Equity at exit
- $202,698
- IRR
- 25.1%
- Equity multiple
- 7.46×
- Total profit
- $407,284
- Equity at exit
- $437,126
Cash invested: $63,000 (down + closing). Projections, not guarantees.
Landlord ↔ Tenant lean methodology
- Overall (STATE)
- 15 Strongly Tenant-Friendly
- State New York
- 15 Strongly Tenant-Friendly · D+10
- County
- — inherits STATE
- City
- — inherits STATE
ZIP-level market 12790
- Home prices YoY
- 26.8%
- Active inventory
- 109
- Price-to-rent
- 7.4×
Monthly cashflow live
- Estimated rent
- $2,525 medium interval (Pro) →
- Mortgage (P&I)
- −$1,180
- Tax from tax record
- −$332 /mo · $3,979/yr
- Insurance
- −$94
- Flood insurance flood zone
- −$56 /mo · $666/yr
- HOA
- −$0
- Vacancy / Maint / Mgmt
- −$530
- Net cashflow
- $334
Break-even live
UW: 25.0% down · 7.5% · 30yr · 1.5% tax · 5.0% vac · 8.0% maint · 8.0% mgmt
Financing live
Cash to close
- Down payment
- $56,250
- Closing costs
- $6,750
- Reserves months
- —
- Total cash needed
- —
Loan-product check · same deal, 3 products live
Conventional
25% down · 7.5% · 30yr
- Down + closing
- —
- Monthly P&I
- —
- Monthly cashflow
- —
- DSCR
- —
- Eligible?
- —
Personal DTI + credit; lowest rate.
DSCR
20% down · 8.5% · 30yr
- Down + closing
- —
- Monthly P&I
- —
- Monthly cashflow
- —
- DSCR
- —
- Eligible?
- —
No personal income docs; deal must DSCR.
Hard money
10% down · 12.0% · 12mo
- Down + closing
- —
- Monthly P&I
- —
- Monthly cashflow
- —
- DSCR
- —
- Eligible?
- —
Short-term bridge; refi at stabilization.
Rent comps 1 comps
| Address | Beds | Baths | Sqft | Rent | $/sqft | DOM | Units | Dist |
|---|---|---|---|---|---|---|---|---|
| 127 Pine St Unit 4 Wurtsboro, NY | 2.0 | 1.5 | 1200 | $2,525 | $2.10 | 14d | 1 | 0.39mi |
Listing history 50 events
-
2026-06-18days on market $225,000 Active 56 DOM
-
2026-06-17days on market $225,000 Active 55 DOM
-
2026-06-16days on market $225,000 Active 54 DOM
-
2026-06-15days on market $225,000 Active 53 DOM
-
2026-06-14days on market $225,000 Active 51 DOM
-
2026-06-10days on market $225,000 Active 48 DOM
-
2026-06-09days on market $225,000 Active 47 DOM
-
2026-06-08days on market $225,000 Active 46 DOM
-
2026-06-07days on market $225,000 Active 45 DOM
-
2026-06-03days on market $225,000 Active 41 DOM
-
2026-06-02days on market $225,000 Active 40 DOM
-
2026-06-01days on market $225,000 Active 39 DOM
-
2026-05-31days on market $225,000 Active 38 DOM
-
2026-05-31days on market $225,000 Active 37 DOM
-
2026-05-12price $229,900 730-char remark
-
2026-04-23$239,900 Active 730-char remark
-
2026-04-09historical
-
2026-03-03price $229,000
-
2026-02-27price $229,900
-
2026-02-18historical
-
2026-02-18historical
-
2026-02-17historical
-
2026-02-12price $259,888
-
2026-02-12$279,888 Active
-
2026-02-09price $239,000
-
2026-02-01price $259,000
-
2026-01-05price $225,000
-
2025-12-01price $230,000
-
2025-11-14price $245,000
-
2025-08-02$250,000 Active
-
2025-07-02historical
-
2025-03-21price $250,000
-
2025-01-25price $260,000
-
2025-01-14$270,000 Active
-
2023-07-14$264,900 Active
-
2023-07-14$264,900 Active
-
2023-07-09historical
-
2023-01-09status Active
-
2022-12-19historical
-
2022-11-23price $224,900
-
2022-11-23price $224,900
-
2022-09-27status Active
-
2022-09-26historical
-
2022-09-12price $229,900
-
2022-09-12price $229,900
-
2022-05-10price $239,900
-
2022-05-10price $239,900
-
2022-03-26$254,900 Active
-
2022-03-26$254,900 Active
-
2019-07-22soldstatus $50,000
ⓘ Source: listings_history table (triggers on properties + properties_extension) + one-shot
backfill from property_details.listing_events for pre-trigger history.
Tax reassessment forecast NY · Partial reset (capped growth)
- Current annual tax
- $3,979 · $332/mo
- Projected year-2 tax
- $3,979 · $332/mo
- Expected delta
- $0/yr ($0/mo · 0.0%)
ⓘ Screening estimate from a state-policy table — verify with the county assessor before closing.
Climate risk First Street
- Flood 8/10 Severe FEMA zone X (unshaded) · 99% chance over 30 yrs
- Wildfire 3/10 Moderate
- Heat 4/10 Moderate 8 d/yr ≥97°F today · 17 d/yr by 30 yrs out
- Wind 3/10 Moderate 8% chance of damaging wind over 30 yrs
- Air quality 2/10 Low 1 unhealthy d/yr today · 1 by 30 yrs out
Nearby sold comps map
Loading sold comps map…
Walkable amenities ~0.75 mi
Loading nearby amenities…
Taxation est. · year 1
- Rental income
- $30,300
- − Mortgage interest
- −$12,603
- − Property taxes
- −$3,979
- − Insurance
- −$1,792
- − Repairs & maintenance
- −$2,424
- − Management
- −$2,424
- − Depreciation
- −$6,545
- Taxable income
- $533
- Est. tax owed @ 24.0%
- −$128
- After-tax cash flow
- $3,880/yr
For passive investors: Depreciation is non-cash, so a rental often shows a tax loss while cash-flowing — sheltering income. Rental losses are passive: they offset passive income freely, and up to $25,000/yr can offset ordinary (W-2) income if you actively participate and your MAGI is under $100k (phasing out to $0 by $150k); unused losses carry forward. On sale, claimed depreciation is recaptured at up to 25%, and gains may owe capital-gains tax (a 1031 exchange can defer both). Figures are a year-1 estimate at your 24.0% rate — not tax advice; consult a CPA.
Schools (NCES district)
- District
- Monticello Central School District
- NCES district ID
- 3619740
- Math proficiency
- 29% ▼ -4.00%
- Reading proficiency
- 30% ▼ -2.00%
- Median HH income
- $44,696
- Composite
- 25.28/100
- National rank
- #7491
- State rank
- #577 of 590 in NY
Livability — Wurtsboro
- Score
- 70/100
- State rank
- #453
- US rank
- #7914
Category grades
Schools grade is shown separately in the Schools card above.
Census & demographics
- Census place
- Wurtsboro, NY
- Population (ZIP)
- 4,341
Population outlook (Sullivan County) Hauer SSP2
- Today (2025)
- 68,974 people
- By 2030
- 65,609 · -4.9%
- By 2040
- 58,878 · -14.6%
- By 2050
- 52,500 · -23.9%
- By 2075
- 39,941 · -42.1%
- By 2100
- 28,880 · -58.1%
Race, ethnicity, and origin ACS 2023
- Neighborhood character
- Predominantly White (79%)
- Race & ethnicity
- White 79% Two or more races 9% Black 6% Hispanic / Latino 6% Asian 4%
- Hispanic origin (detail)
- Puerto Rican 3%
- Common ancestry
- Russian 7% Slovak 5% Scotch-Irish 4%
- Foreign-born
- 8% · Canada
- Languages at home
- 87% English-only · Spanish 3% Chinese 3% Russian/Polish/Slavic 3%
Political lean MEDSL · Sullivan
- 2024 margin
- R (+16.7) · D 41.6% · R 58.4%
- 2008→2024 swing
- -26.2pp toward R · 2008: 9.5pp · 2024: -16.7pp
- All cycles
- 2024: R+16.7 2020: R+9.2 2016: R+13.7 2012: D+10.4 2008: D+9.5
Not yet ingested
- Civics
- —
Market trends
- HPI YoY
- ▲ 95.79%
- Current HPI
- 452.7233
- Rent YoY
- —
- Metro
- —
- State GDP YoY
- ▲ 2.60%
- F500 in state
- 92
Industry mix (Fortune 500 HQ in NY)
| Industry | F500 HQs | Revenue |
|---|---|---|
| Financial Services | 10 | $950B |
|
||
| Consumer Goods | 9 | $162B |
|
||
| Insurance | 4 | $225B |
|
||
| Telecommunications | 2 | $144B |
|
||
| Pharmaceuticals | 2 | $112B |
|
||
| Media / Entertainment | 2 | $69B |
|
||
Price history
+350.0% since first listed37 events — show timeline
- 2026-05-20 Price Changed $225,000 OneKey® MLS as Distributed by MLS Grid
- 2026-05-12 Price Changed $229,900 OneKey® MLS as Distributed by MLS Grid
- 2026-04-23 Listed $239,900 OneKey® MLS as Distributed by MLS Grid
- 2026-04-09 Listing Removed — OneKey® MLS as Distributed by MLS Grid
- 2026-03-03 Price Changed $229,000 OneKey® MLS as Distributed by MLS Grid
- 2026-02-27 Price Changed $229,900 OneKey® MLS as Distributed by MLS Grid
- 2026-02-18 Listing Removed — UNYREIS
- 2026-02-18 Listing Removed — UNYREIS
- 2026-02-17 Listing Removed — UNYREIS
- 2026-02-12 Price Changed $259,888 UNYREIS
- 2026-02-12 Listed $279,888 UNYREIS
- 2026-02-09 Price Changed $239,000 OneKey® MLS as Distributed by MLS Grid
- 2026-02-01 Price Changed $259,000 OneKey® MLS as Distributed by MLS Grid
- 2026-01-05 Price Changed $225,000 OneKey® MLS as Distributed by MLS Grid
- 2025-12-01 Price Changed $230,000 OneKey® MLS as Distributed by MLS Grid
- 2025-11-14 Price Changed $245,000 OneKey® MLS as Distributed by MLS Grid
- 2025-08-02 Listed $250,000 OneKey® MLS as Distributed by MLS Grid
- 2025-07-02 Listing Removed — OneKey® MLS as Distributed by MLS Grid
- 2025-03-21 Price Changed $250,000 OneKey® MLS as Distributed by MLS Grid
- 2025-01-25 Price Changed $260,000 OneKey® MLS as Distributed by MLS Grid
- 2025-01-14 Listed $270,000 OneKey® MLS as Distributed by MLS Grid
- 2023-07-14 Listed $264,900 OneKey® MLS as Distributed by MLS Grid
- 2023-07-14 Listed $264,900 HVCRMLS
- 2023-07-09 Listing Removed — OneKey® MLS as Distributed by MLS Grid
- 2023-01-09 Relisted — OneKey® MLS as Distributed by MLS Grid
- 2022-12-19 Listing Removed — OneKey® MLS as Distributed by MLS Grid
- 2022-11-23 Price Changed $224,900 HVCRMLS
- 2022-11-23 Price Changed $224,900 OneKey® MLS as Distributed by MLS Grid
- 2022-09-27 Relisted — OneKey® MLS as Distributed by MLS Grid
- 2022-09-26 Listing Removed — OneKey® MLS as Distributed by MLS Grid
- 2022-09-12 Price Changed $229,900 HVCRMLS
- 2022-09-12 Price Changed $229,900 OneKey® MLS as Distributed by MLS Grid
- 2022-05-10 Price Changed $239,900 HVCRMLS
- 2022-05-10 Price Changed $239,900 OneKey® MLS as Distributed by MLS Grid
- 2022-03-26 Listed $254,900 OneKey® MLS as Distributed by MLS Grid
- 2022-03-26 Listed $254,900 HVCRMLS
- 2019-07-22 Sold (Public Records) $50,000 Public Records
Property tax history
+1.4%/yrLatest (2025): $3,979 · +1.6% YoY. Source: county tax records.
Cash-flow waterfall
monthlySold comps — $/sqft
last 12 mo · ≤1 miLoading sold comps…