13919 E Maguire Rd · Slaughterville, OK
Flood risk 9/10 · Severe
- FEMA flood zone
- X (unshaded)
- Chance of flooding over 30 yrs
- 0.99%
- Est. flood insurance / yr
- $507 – $1,088
Fire risk 5/10 · Moderate
- Est. fire insurance / yr
- $2,463 – $4,575
Heat risk 5/10 · Moderate
- Hot days now (above 109°F)
- 7 days/yr
- Hot days in 30 yrs
- 18 days/yr
Wind risk 3/10 · Minor
- Chance of severe wind over 30 yrs
- 5.0%
Air-quality risk 2/10 · Minimal
- Unhealthy air days now
- 1 days/yr
- Unhealthy air days in 30 yrs
- 1 days/yr
Risk factors via First Street. Map © Google.
Why this score? — see what drove the F grade
The composite is a weighted blend of 9 inputs, each scored 0–100. Each bar is that input's sub-score; the figure is the points it added to the 100-point composite (weight × sub-score).
- Cash flow +10.9/30.0
- ARV discount +7.5/15.0
- DSCR +3.2/10.0
- Livability +3.2/5.0
- 1% rule +2.6/10.0
- Rent growth +2.5/5.0
- Condition / age +2.5/5.0
- Schools +2.1/10.0
- Appreciation +0.0/10.0
$170,000
🖨 Deal sheet 📄 Offer letter ✓ Due diligence
Listing remarks MLS
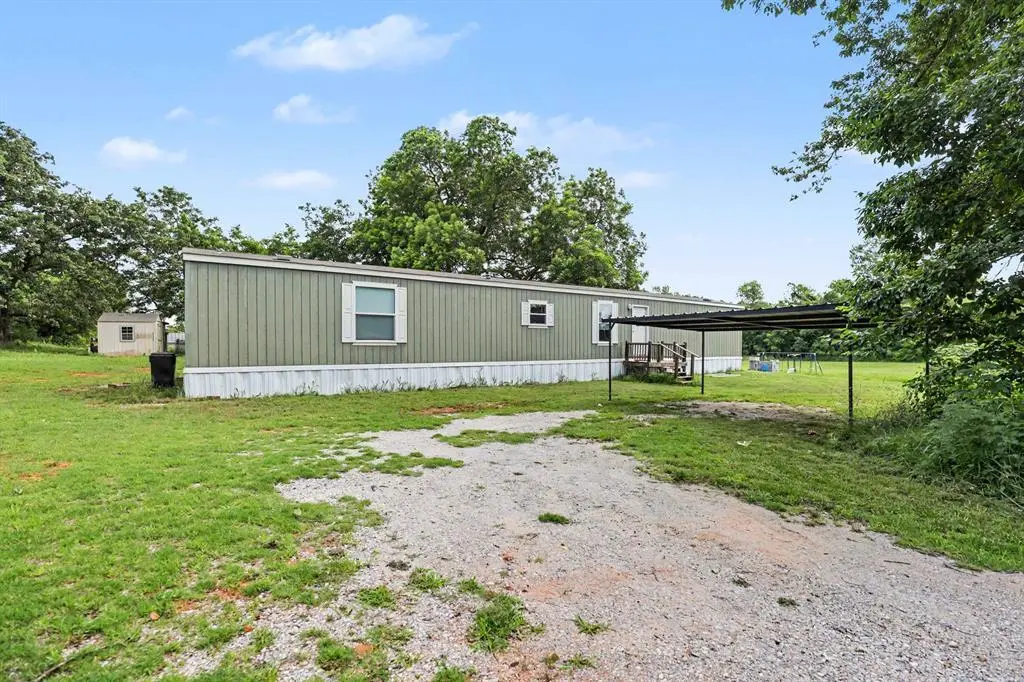
Come check out clean single-wide, mobile home located on over 7 acres in Noble! This home is a 2017 model, and you couldn't ask for a more beautiful piece of land - truly move in ready. The open floor plan makes the most of the square footage with a lovely great room style kitchen/dining/living. Beautiful cabinetry, stylish vent hood, and Hard surface floors in the public spaces make cleaning and maintenance a breeze. Tons of natural light fills each room and wood beam accents give the living room a classy touch. The washer/dryer and fridge stay with the home. You will love the trees on the property- pecan, sand plum, blackberry, black walnut, persimmons. The chicken coop has electricity, and the storage shed has a solar panel. There are also two deer stands that will stay. Well and septic are already in place. Large underground storm shelter.
Key facts
- 7 acres
- Serene creek
- Large open kitchen
Tags
Property features AI
Finance
- Other: Homestead eligible; Livestock permitted
- Financial info: Loan qualification possible
- HOA & community: No mandatory association dues
Exterior
- Utilities: Cable available; Electricity available; Septic tank; Private well available
- Home design: Single family residence; One level; South-facing
- Construction: Mobile construction; Composition roof; Post tension foundation; Built — existing
- Exterior features: Barn(s); Outbuildings; Rural setting; Below-ground storm shelter
Interior
- Kitchen: Free-standing electric range and oven
- Bedrooms: 3 bedrooms
- Flooring: Carpet; Tile; Vinyl
- Bathrooms: 2 full bathrooms
- Heating & cooling: Electric heating
- Interior features: No fireplace; No in-law plan
Neighborhood map
What this means for you Summary
Snapshot
- This is a 2-bed/2.0-bath manufactured listed at $170k.
Deal economics
- At list price, monthly cash flow is $-142 ($-2k/yr) — negative.
- To cash-flow at today's rent, offer at most $145k (14.8% below list).
- To meet the 1% rule (rent ≥ 1% of price), the offer needs to be $129k (24.2% below list).
- Recommended offer: $129k (24.2% below list) — sets the bar for 1% rule.
- Cap rate 5.8% vs local median 4.4% in Slaughterville — top-decile yield for the area; either an underpriced asset or a hidden risk that comps aren't pricing in. Stress-test before assuming the spread holds.
Location & tenants
- Location reads 63/100 on livability (#228 in OK) — a middle-class / working-renter tenant base. Strengths: cost of living A+, housing A+, employment A; Watch: amenities F, commute F, health & safety F.
- Noble (suburban): math 23% / reading 25% proficiency, ranked #108 of 270 in OK (top 40%) — low school quality limits family demand, transient renter base, plan for 1-2y turnover.
- Zoned schools: Pioneer Es (math 34% / reading 29%, grade F, #241 of 845 statewide, top 29%, 415 students, 0% FRL); Noble Hs (math 17% / reading 27%, grade F, #222 of 447 statewide, top 52%, 883 students, 0% FRL) — zoned schools average 0% FRL vs 53% district-wide (53 pts lower); this property's tenant base skews higher-income than the district average.
- Market conditions: 214 active listings in the ZIP; 2 comparable units currently listed for rent nearby; 592 units permitted in Cleveland County in 2024 (12 in 5+ unit buildings).
Forward outlook
- Local home prices are declining (-3.0%/yr); year-one equity from $1k of loan paydown is wiped out by about $5k of value loss. Plan a longer hold.
- Cleveland County population projected at +40% by 2050 — long-run rental-demand tailwind backs the buy-and-hold thesis.
Negotiation context
- Only 6 days on market — expect competitive offers; lowballing is unlikely to land.
- 8 sale attempts since 10y ago with the ask held roughly flat each time — persistent listings suggest the price (not the market) is what's stuck; bring a comps-based counter.
- Current owner paid $145k; 17% above their basis — modest negotiation headroom, anchor on the comps not their cost.
Risks & watch-outs
- Watch-outs: flood insurance adds $66/mo.
- Climate carrying-cost: severe flood risk; moderate wildfire risk; extreme-heat days projected 7→18/yr by 2055 (HVAC capex compounding) — expect insurance premiums to compound above CPI over the hold.
Questions for the listing agent
- What do current leases actually rent for vs. the listed asking? Can we see a recent rent roll and the last 12 months of T-12 income?
- What's the actual annual flood-insurance premium (NFIP or private), and is the property in a SFHA with mandatory coverage?
- Is there a deadline driving the sale (1031 exchange, divorce, estate, relocation)? That informs how much negotiation room exists.
- Schools are F-rated, which usually means shorter tenancies and higher turnover. Who's the typical renter profile here, and what's been the actual vacancy rate?
- The area grade is low — what's the realistic commute time and amenity access for the typical tenant pool here? Any planned neighborhood developments (good or bad) we should know about?
- What's the average days-on-market for RENTAL listings here right now (not sales)? A rising rental-DOM trend means longer vacancies and softer asking-rent achievability than the comps imply.
- What's the recent tenant-quality profile in this submarket — average credit score on applications, eviction rate, late-payment / NSF rate, and stable-employment percentage? A property-management company in the area should have these aggregated.
- How much new for-sale + rental construction is in the pipeline within 1–3 miles? Heavy new supply typically softens prices + rents 12–24 months out; constrained supply supports both.
Investment metrics
- 1% rule
- 0.76% ✗
- Cap rate
- 5.76%
- Cash-on-cash
- -1.91%
- DSCR
- 0.92
- GRM
- 11.0
CMA / ARV
No comps found within radius.
Projected returns pro-forma
-3.0% appreciation · 3.0% rent growth · sell at horizon
- IRR
- -22.3%
- Equity multiple
- 0.23×
- Total profit
- $-36,590
- Equity at exit
- $25,348
- IRR
- -16.4%
- Equity multiple
- 0.09×
- Total profit
- $-43,478
- Equity at exit
- $14,698
Cash invested: $47,600 (down + closing). Projections, not guarantees.
Landlord ↔ Tenant lean methodology
- Overall (STATE)
- 83 Strongly Landlord-Friendly
- State Oklahoma
- 83 Strongly Landlord-Friendly · R+20
- County
- — inherits STATE
- City
- — inherits STATE
ZIP-level market 73068
- Home prices YoY
- -4.8%
- Active inventory
- 214
- Price-to-rent
- 11.0×
Monthly cashflow live
- Estimated rent
- $1,288 medium interval (Pro) →
- Mortgage (P&I)
- −$891
- Tax from tax record
- −$131 /mo · $1,575/yr
- Insurance
- −$71
- Flood insurance flood zone
- −$66 /mo · $798/yr
- HOA
- −$0
- Vacancy / Maint / Mgmt
- −$271
- Net cashflow
- $-142
Break-even live
UW: 25.0% down · 7.5% · 30yr · 1.5% tax · 5.0% vac · 8.0% maint · 8.0% mgmt
Financing live
Cash to close
- Down payment
- $42,500
- Closing costs
- $5,100
- Reserves months
- —
- Total cash needed
- —
Loan-product check · same deal, 3 products live
Conventional
25% down · 7.5% · 30yr
- Down + closing
- —
- Monthly P&I
- —
- Monthly cashflow
- —
- DSCR
- —
- Eligible?
- —
Personal DTI + credit; lowest rate.
DSCR
20% down · 8.5% · 30yr
- Down + closing
- —
- Monthly P&I
- —
- Monthly cashflow
- —
- DSCR
- —
- Eligible?
- —
No personal income docs; deal must DSCR.
Hard money
10% down · 12.0% · 12mo
- Down + closing
- —
- Monthly P&I
- —
- Monthly cashflow
- —
- DSCR
- —
- Eligible?
- —
Short-term bridge; refi at stabilization.
Rent comps 2 comps
| Address | Beds | Baths | Sqft | Rent | $/sqft | DOM | Units | Dist |
|---|---|---|---|---|---|---|---|---|
| 7351 142nd St Unit 37 Noble, OK | 3.0 | 2.0 | 1216 | $1,350 | $1.11 | 2d | 1 | 0.38mi |
| 7500 144th St Unit 17 Noble, OK | 3.0 | 2.0 | 1216 | $1,350 | $1.11 | 2d | 1 | 0.49mi |
Listing history 5 events
-
2026-06-15statusdays on market $170,000 Pending 6 DOM
-
2026-06-13days on market $170,000 Active 5 DOM
-
2026-06-13days on market $170,000 Active 4 DOM
-
2026-06-09remarks 687-char remark
-
2026-06-09$170,000 Active 1 DOM
ⓘ Source: listings_history table (triggers on properties + properties_extension) + one-shot
backfill from property_details.listing_events for pre-trigger history.
Tax reassessment forecast OK · Resets to sale price
- Current annual tax
- $1,575 · $131/mo
- Projected year-2 tax
- $1,575 · $131/mo
- Expected delta
- $0/yr ($0/mo · 0.0%)
ⓘ Screening estimate from a state-policy table — verify with the county assessor before closing.
Climate risk First Street
- Flood 9/10 Extreme FEMA zone X (unshaded) · 99% chance over 30 yrs
- Wildfire 5/10 Major
- Heat 5/10 Major 7 d/yr ≥109°F today · 18 d/yr by 30 yrs out
- Wind 3/10 Moderate 5% chance of damaging wind over 30 yrs
- Air quality 2/10 Low 1 unhealthy d/yr today · 1 by 30 yrs out
Nearby sold comps map
Loading sold comps map…
Walkable amenities ~0.75 mi
Loading nearby amenities…
Taxation est. · year 1
- Rental income
- $15,462
- − Mortgage interest
- −$9,523
- − Property taxes
- −$1,575
- − Insurance
- −$1,648
- − Repairs & maintenance
- −$1,237
- − Management
- −$1,237
- − Depreciation
- −$4,945
- Taxable loss
- −$4,703
- Est. tax savings @ 24.0%
- +$1,129
- After-tax cash flow
- $-577/yr
For passive investors: Depreciation is non-cash, so a rental often shows a tax loss while cash-flowing — sheltering income. Rental losses are passive: they offset passive income freely, and up to $25,000/yr can offset ordinary (W-2) income if you actively participate and your MAGI is under $100k (phasing out to $0 by $150k); unused losses carry forward. On sale, claimed depreciation is recaptured at up to 25%, and gains may owe capital-gains tax (a 1031 exchange can defer both). Figures are a year-1 estimate at your 24.0% rate — not tax advice; consult a CPA.
Schools (NCES district)
- District
- Noble
- NCES district ID
- 4021630
- Math proficiency
- 23% ▼ -8.00%
- Reading proficiency
- 25% ▼ -7.00%
- Median HH income
- $50,812
- Composite
- 21.31/100
- National rank
- #8384
- State rank
- #108 of 270 in OK
Livability — Slaughterville
- Score
- 63/100
- State rank
- #228
- US rank
- #15883
Category grades
Schools grade is shown separately in the Schools card above.
Census & demographics
- Census place
- Slaughterville, OK
- County
- Cleveland County · 239,547 people
- City population
- 12,003
- Metro
- Oklahoma City, OK
- Population (ZIP)
- 12,258
- Household income
- $73,821
- Rent vs Own
- Severe rent burden
- 301.0
Population outlook (Cleveland County) Hauer SSP2
- Today (2025)
- 323,621 people
- By 2030
- 349,070 · +7.9%
- By 2040
- 400,168 · +23.7%
- By 2050
- 454,101 · +40.3%
- By 2075
- 602,926 · +86.3%
- By 2100
- 734,485 · +127.0%
Race, ethnicity, and origin ACS 2023
- Neighborhood character
- Predominantly White (82%)
- Race & ethnicity
- White 82% Two or more races 8% Hispanic / Latino 5% Native American 5% Black 1%
- Hispanic origin (detail)
- Mexican 4% Puerto Rican 1%
- Common ancestry
- Slovak 3% Lithuanian 2% Italian 2%
- Foreign-born
- 1% · Canada
- Languages at home
- 98% English-only · Spanish 1%
Political lean MEDSL · Cleveland
- 2024 margin
- R (+14.9) · D 41.4% · R 56.4% · Other 2.2%
- 2008→2024 swing
- +9.1pp toward D · 2008: -24.0pp · 2024: -14.9pp
- All cycles
- 2024: R+14.9 2020: R+14.1 2016: R+21.7 2012: R+25.9 2008: R+24.0
Not yet ingested
- Civics
- —
Market trends
- HPI YoY
- ▼ -13.99%
- Current HPI
- 278.428
- Rent YoY
- —
- Metro
- Oklahoma City, OK
- State GDP YoY
- ▲ 1.55%
- F500 in state
- 6
Industry mix (Fortune 500 HQ in OK)
| Industry | F500 HQs | Revenue |
|---|---|---|
| Energy | 3 | $48B |
|
||
Price history
+729.3% since first listed22 events — show timeline
- 2026-06-08 Listed $170,000 MLSOK
- 2021-06-09 Sold (Public Records) $145,000 Public Records
- 2021-06-03 Sold (MLS) $145,000 MLSOK
- 2021-03-31 Pending — MLSOK
- 2021-03-24 Listed $135,000 MLSOK
- 2021-03-18 Sold (MLS) $135,000 MLSOK
- 2021-02-15 Pending — MLSOK
- 2021-02-07 Listed $135,000 MLSOK
- 2020-12-23 Sold (MLS) $120,000 MLSOK
- 2020-12-12 Pending — MLSOK
- 2020-12-08 Price Changed $126,500 MLSOK
- 2020-11-25 Relisted — MLSOK
- 2020-11-20 Pending — MLSOK
- 2020-11-18 Relisted — MLSOK
- 2020-11-15 Pending — MLSOK
- 2020-11-13 Listed $130,000 MLSOK
- 2017-04-07 Sold (MLS) $47,000 MLSOK
- 2017-02-15 Pending — MLSOK
- 2017-01-25 Listed $49,900 MLSOK
- 2017-01-19 Listing Removed — MLSOK
- 2016-10-13 Listed $49,900 MLSOK
- 1998-07-24 Sold (Public Records) $20,500 Public Records
Property tax history
+21.9%/yrLatest (2024): $1,575 · +4.9% YoY. Source: county tax records.
Cash-flow waterfall
monthlySold comps — $/sqft
last 12 mo · ≤1 miLoading sold comps…