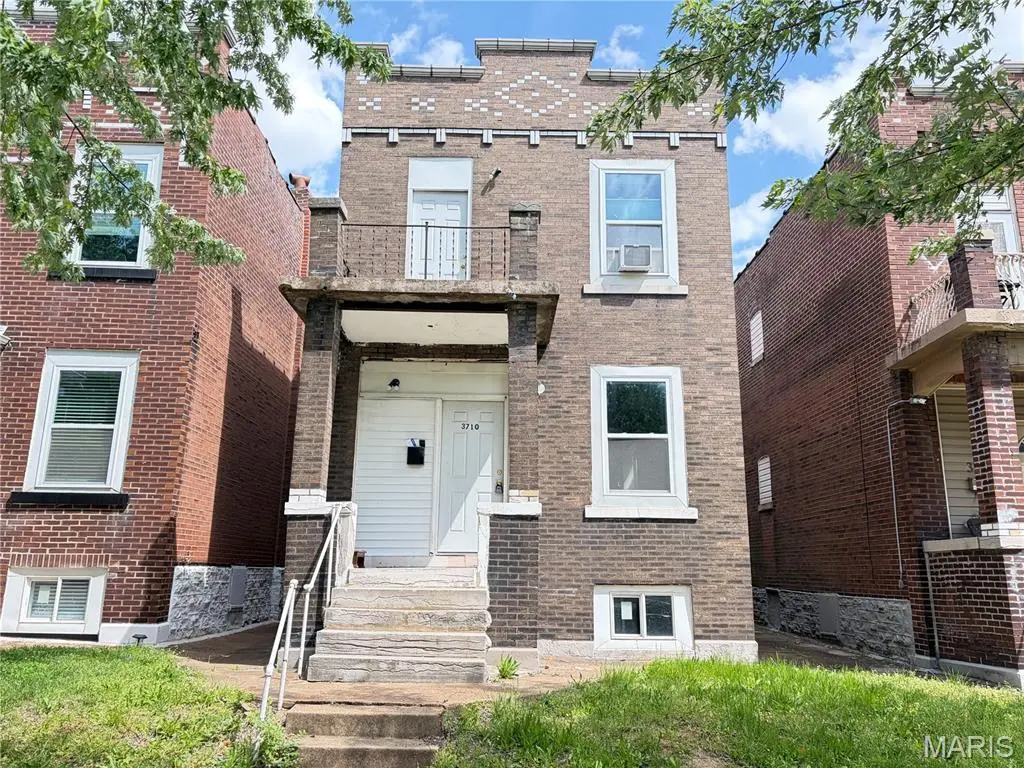
3710 Bamberger Ave · St. Louis, MO
Flood risk 1/10 · Minimal
- FEMA flood zone
- X (unshaded)
- Chance of flooding over 30 yrs
- 0.0%
- Est. flood insurance / yr
- $473 – $860
Fire risk 1/10 · Minimal
- Est. fire insurance / yr
- $1,054 – $1,958
Heat risk 6/10 · Moderate
- Hot days now (above 108°F)
- 7 days/yr
- Hot days in 30 yrs
- 21 days/yr
Wind risk 2/10 · Minimal
- Chance of severe wind over 30 yrs
- 1.0%
Air-quality risk 3/10 · Minor
- Unhealthy air days now
- 3 days/yr
- Unhealthy air days in 30 yrs
- 4 days/yr
Risk factors via First Street. Map © Google.
Why this score? — see what drove the B- grade
The composite is a weighted blend of 9 inputs, each scored 0–100. Each bar is that input's sub-score; the figure is the points it added to the 100-point composite (weight × sub-score).
- Cash flow +30.0/30.0
- 1% rule +10.0/10.0
- DSCR +10.0/10.0
- ARV discount +7.5/15.0
- Rent growth +3.2/5.0
- Livability +2.5/5.0
- Condition / age +2.5/5.0
- Schools +1.2/10.0
- Appreciation +0.0/10.0
$130,000
🖨 Deal sheet 📄 Offer letter ✓ Due diligence
Listing remarks
Ready for your next investment opportunity with most of the cap ex already done? This is a great chance to finish a project that has already undergone many extensive updates including full PVC plumbing (including sewer lateral), new HVAC, new Water Heater, new roof, AND new electrical. It's already been converted from a duplex to a single family with a bedroom on the main level, and the other three upstairs. 2 full bathrooms, one on each floor. Some newer windows. Newer appliances. Finish off the interior and ready to re-list!
Key facts
- New hvac
- New water heater
- Full pvc plumbing
Tags
Property features AI
Exterior
- Parking: On-site parking
- Utilities: Public water; Public sewer; Electricity available (220 volts); Natural gas available
- Home design: Single family residence; Private ownership; Fixer condition; Two levels; Stone foundation
- Construction: Brick and vinyl siding construction; Membrane roof
- Exterior features: Rectangular lot; Back yard with partial wood fencing; No pool
Interior
- Bedrooms: Total of 4 bedrooms; 1 bedroom on the main level; 3 bedrooms on the upper level
- Flooring: Ceramic tile; Vinyl
- Bathrooms: 2 full bathrooms total; 1 full bathroom on the main level; 1 full bathroom on the upper level
- Heating & cooling: Forced air heating; Natural gas heating; Central air conditioning
- Interior features: Unfinished basement with both interior and exterior entry; Balcony
Neighborhood map
What this means for you Summary
Snapshot
- This is a 4-bed/2.0-bath single-family listed at $130k.
Deal economics
- At list price, monthly cash flow is $744 ($9k/yr) — positive.
- The deal already cash-flows at list — no discount required.
- Meets the 1% rule at list price ($2k rent vs $130k).
- Cap rate 13.2% vs local median 5.0% in St. Louis — top-decile yield for the area; either an underpriced asset or a hidden risk that comps aren't pricing in. Stress-test before assuming the spread holds.
Location & tenants
- Location reads: area grade B — affects rentability + tenant quality, not the cash-flow math above.
- St. Louis City (urban): math 10% / reading 18% proficiency, ranked #312 of 324 in MO (top 96%) — low school quality limits family demand, transient renter base, plan for 1-2y turnover; 80% free/reduced lunch — lower-income household profile, screen leases tightly.
- Zoned schools: Oak Hill Elem. (math 12% / reading 12%, grade F, #1,016 of 1,115 statewide, top 92%, 238 students, 99% FRL); Roosevelt High (math 2% / reading 8%, grade F, #517 of 521 statewide, top 100%, 460 students, 99% FRL) — zoned schools average 99% FRL vs 80% district-wide (18 pts higher); higher-poverty schools than district average — tighter screening recommended.
- Market conditions: Rents rising (+2.6%/yr); 255 active listings in the ZIP; 20 comparable units currently listed for rent nearby; rentals at typical pace (median 21d on market — plan ~3-4 weeks tenant-placement turnaround); 40% of comp listings sitting > 30 days — soft ceiling on asking rent; 294 units permitted in St. Louis city in 2024 (227 in 5+ unit buildings).
- This rent runs 38% of the median local income ($61k/yr) — at the standard rent-burdened threshold; future hikes will face affordability resistance.
Forward outlook
- Local home prices are declining (-3.0%/yr); year-one equity from $899 of loan paydown is wiped out by about $4k of value loss. Plan a longer hold.
- St. Louis County population projected to shrink 6% by 2050 — rents likely to lag national; underwrite the cash flow, not the appreciation.
- At projected returns (-3.0% appreciation + 2.6% rent growth), your $36k cash investment doubles in ~6 years — after that, you're playing with house money.
Negotiation context
- Only 6 days on market — expect competitive offers; lowballing is unlikely to land.
- 6 sale attempts since 8y ago with the ask held roughly flat each time — persistent listings suggest the price (not the market) is what's stuck; bring a comps-based counter.
- Current owner paid $58k; list at $130k implies a 124% gain — meaningful room to come down on a strong offer.
Risks & watch-outs
- Watch-outs: built in 1915 — expect roof / HVAC / electrical / plumbing capex.
- Climate carrying-cost: extreme-heat days projected 7→21/yr by 2055 (HVAC capex compounding) — expect insurance premiums to compound above CPI over the hold.
Questions for the listing agent
- Built in 1915 — when were the roof, HVAC, electrical panel, plumbing, and water heater last replaced?
- Is there a deadline driving the sale (1031 exchange, divorce, estate, relocation)? That informs how much negotiation room exists.
- What's the average days-on-market for RENTAL listings here right now (not sales)? A rising rental-DOM trend means longer vacancies and softer asking-rent achievability than the comps imply.
- What's the recent tenant-quality profile in this submarket — average credit score on applications, eviction rate, late-payment / NSF rate, and stable-employment percentage? A property-management company in the area should have these aggregated.
- How much new for-sale + rental construction is in the pipeline within 1–3 miles? Heavy new supply typically softens prices + rents 12–24 months out; constrained supply supports both.
Investment metrics
- 1% rule
- 1.50% ✓
- Cap rate
- 13.16%
- Cash-on-cash
- 24.53%
- DSCR
- 2.09
- GRM
- 5.6
CMA / ARV
- ARV (on-the-fly)
- $260,350
- Comps found
- 12
Show comp detail 12 sales within ~0.75 mi
| Address | Dist | Beds/Ba | Sqft | Sold | Price | $/sf | Match |
|---|---|---|---|---|---|---|---|
| 3959 Keokuk St | 0.32mi | 4/2.0 | 2,044 (-0%) | 3mo | $230,000 | $113 | 82 |
| 3442 Chippewa St | 0.40mi | 4/2.0 | 2,068 (+1%) | 1mo | $199,500 | $96 | 79 |
| 3447 Dunnica | 0.40mi | 4/2.5 | 2,232 (+9%) | 1mo | $249,900 | $112 | 63 |
| 4114 Mcdonald Ave | 0.65mi | 3/2.0 (-1) | 2,000 (-2%) | 0mo | $300,000 | $150 | 60 |
| 3970 Mcdonald Ave | 0.53mi | 4/1.0 | 2,160 (+5%) | 6mo | $275,000 | $127 | 57 |
| 3678 Liermann Ave | 0.39mi | 5/3.0 (+1) | 2,200 (+7%) | 7mo | $220,000 | $100 | 55 |
| 3449 Utah St | 0.69mi | 5/3.0 (+1) | 2,080 (+2%) | 2mo | $399,900 | $192 | 55 |
| 3918 Wyoming St | 0.67mi | 3/2.5 (-1) | 1,936 (-6%) | 2mo | $425,000 | $220 | 51 |
| 3408 Winnebago St | 0.46mi | 3/2.5 (-1) | 1,746 (-15%) | 1mo | $229,500 | $131 | 46 |
| 3449 Tennessee Ave | 0.53mi | 3/1.5 (-1) | 2,328 (+14%) | 2mo | $280,000 | $120 | 44 |
| 3824 Michigan Ave | 0.69mi | 3/2.0 (-1) | 2,340 (+14%) | 6mo | $209,000 | $89 | 34 |
| 3937 Humphrey St | 0.65mi | 3/3.5 (-1) | 1,750 (-15%) | 3mo | $370,000 | $211 | 32 |
Match score weights: distance 35% · size 25% · config 20% · recency 20%. Top-matched comps best support the ARV.
Projected returns pro-forma
-3.0% appreciation · 2.62% rent growth · sell at horizon
- IRR
- 17.4%
- Equity multiple
- 1.70×
- Total profit
- $25,541
- Equity at exit
- $19,383
- IRR
- 25.7%
- Equity multiple
- 3.20×
- Total profit
- $80,091
- Equity at exit
- $11,240
Cash invested: $36,400 (down + closing). Projections, not guarantees.
Landlord ↔ Tenant lean methodology
- Overall (STATE)
- 81 Strongly Landlord-Friendly
- State Missouri
- 81 Strongly Landlord-Friendly · R+10
- County
- — inherits STATE
- City
- — inherits STATE
ZIP-level market 63116
- Rents YoY
- 2.6%
- Active inventory
- 255
- Price-to-rent
- 5.6×
Monthly cashflow live
- Estimated rent
- $1,945 high interval (Pro) →
- Mortgage (P&I)
- −$682
- Tax from tax record
- −$57 /mo · $682/yr
- Insurance
- −$54
- HOA
- −$0
- Vacancy / Maint / Mgmt
- −$408
- Net cashflow
- $744
Break-even live
UW: 25.0% down · 7.5% · 30yr · 1.5% tax · 5.0% vac · 8.0% maint · 8.0% mgmt
Financing live
Cash to close
- Down payment
- $32,500
- Closing costs
- $3,900
- Reserves months
- —
- Total cash needed
- —
Loan-product check · same deal, 3 products live
Conventional
25% down · 7.5% · 30yr
- Down + closing
- —
- Monthly P&I
- —
- Monthly cashflow
- —
- DSCR
- —
- Eligible?
- —
Personal DTI + credit; lowest rate.
DSCR
20% down · 8.5% · 30yr
- Down + closing
- —
- Monthly P&I
- —
- Monthly cashflow
- —
- DSCR
- —
- Eligible?
- —
No personal income docs; deal must DSCR.
Hard money
10% down · 12.0% · 12mo
- Down + closing
- —
- Monthly P&I
- —
- Monthly cashflow
- —
- DSCR
- —
- Eligible?
- —
Short-term bridge; refi at stabilization.
Rent comps 20 comps
| Address | Beds | Baths | Sqft | Rent | $/sqft | DOM | Units | Dist |
|---|---|---|---|---|---|---|---|---|
| 3526 S Spring Ave Saint Louis, MO | 4.0 | 2.0 | 2244 | $2,877 | $1.28 | 44d | 1 | 0.25mi |
| 3807 Potomac St Saint Louis, MO | 3.0 | 1.0 | 2588 | $1,100 | $0.43 | 44d | 1 | 0.32mi |
| 3807 Potomac St Saint Louis, MO | 3.0 | 1.0 | 2588 | $1,300 | $0.50 | 7d | 1 | 0.32mi |
| 3458 Giles Ave Saint Louis, MO | 3.0 | 2.5 | 2204 | $2,400 | $1.09 | 7d | 1 | 0.37mi |
| 3908 McDonald Ave Saint Louis, MO | 3.0 | 2.0 | 1927 | $2,500 | $1.30 | 4d | 1 | 0.48mi |
| 4222 S 38th St Unit 4222 St. Louis, MO | 3.0 | 2.0 | 1836 | $1,400 | $0.76 | 20d | 1 | 0.55mi |
| 3637 Meramec St Saint Louis, MO | 3.0 | 1.5 | 1632 | $1,925 | $1.18 | 17d | 1 | 0.61mi |
| 3411 Cherokee St St. Louis, MO | 4.0 | 2.0 | 1568 | $1,850 | $1.18 | 44d | 1 | 0.62mi |
| 3146 Keokuk St Saint Louis, MO | 3.0 | 1.0 | 1528 | $1,500 | $0.98 | 23d | 1 | 0.67mi |
| 3131 Keokuk St #3131 Saint Louis, MO | 3.0 | 2.0 | 1500 | $1,475 | $0.98 | 14d | 1 | 0.68mi |
| 3628 Wyoming St Unit 2F St. Louis, MO | 4.0 | 1.0 | 1700 | $1,950 | $1.15 | 44d | 1 | 0.68mi |
| 3540 Michigan Ave Saint Louis, MO | 4.0 | 2.0 | 1758 | $1,800 | $1.02 | 2d | 1 | 0.70mi |
| 4135 S Compton Ave Saint Louis, MO | 3.0 | 2.0 | 2104 | $1,600 | $0.76 | 44d | 1 | 0.78mi |
| 4145 S Compton Ave Saint Louis, MO | 3.0 | 2.0 | 1656 | $1,520 | $0.92 | 44d | 1 | 0.79mi |
| 3510 California Ave Saint Louis, MO | 3.0 | 2.0 | 1800 | $1,200 | $0.67 | 44d | 1 | 1.02mi |
| 4145-4147 Hartford St St. Louis, MO | 4.0 | 3.5 | 2400 | $3,800 | $1.58 | 12d | 1 | 1.02mi |
| 3429 Ohio Ave Saint Louis, MO | 3.0 | 3.0 | 1938 | $2,250 | $1.16 | 16d | 1 | 1.14mi |
| 4312 Oregon Ave Saint Louis, MO | 4.0 | 2.0 | 2032 | $2,000 | $0.98 | 2d | 1 | 1.18mi |
| 4450 Pennsylvania Ave Saint Louis, MO | 3.0 | 1.0 | 1500 | $1,100 | $0.73 | 4d | 1 | 1.22mi |
| 2643 Wyoming St Saint Louis, MO | 3.0 | 2.5 | 2592 | $2,600 | $1.00 | 44d | 1 | 1.31mi |
Listing history 21 events
-
2026-04-30status Pending
-
2026-04-24$130,000 Active
-
2024-12-16status Active
-
2024-12-16price $180,500
-
2024-12-02historical
-
2024-08-30$182,999 Active
-
2024-02-03historical
-
2024-01-14price $187,000
-
2023-12-07price $188,000
-
2023-11-17$198,000 Active
-
2021-06-04soldstatus $58,000
-
2021-05-29status Pending
-
2021-05-28soldstatus Closed
-
2021-03-29$69,900 Active
-
2018-05-14soldstatus Closed
-
2018-04-10status Pending
-
2018-04-10historical
-
2018-04-09status Pending
-
2018-04-09$25,000 Active
-
2006-01-24soldstatus $112,500
-
2003-04-18soldstatus
ⓘ Source: listings_history table (triggers on properties + properties_extension) + one-shot
backfill from property_details.listing_events for pre-trigger history.
Tax reassessment forecast MO · Resets to sale price
- Current annual tax
- $682 · $57/mo
- Projected year-2 tax
- $1,261 · $105/mo
- Expected delta
- +$579/yr (+$48/mo · 85.0%)
ⓘ Screening estimate from a state-policy table — verify with the county assessor before closing.
Climate risk First Street
- Flood 1/10 Low FEMA zone X (unshaded) · 0% chance over 30 yrs
- Wildfire 1/10 Low
- Heat 6/10 Major 7 d/yr ≥108°F today · 21 d/yr by 30 yrs out
- Wind 2/10 Low 100% chance of damaging wind over 30 yrs
- Air quality 3/10 Moderate 3 unhealthy d/yr today · 4 by 30 yrs out
Nearby sold comps map
Loading sold comps map…
Walkable amenities ~0.75 mi
Loading nearby amenities…
Taxation est. · year 1
- Rental income
- $23,342
- − Mortgage interest
- −$7,282
- − Property taxes
- −$682
- − Insurance
- −$650
- − Repairs & maintenance
- −$1,867
- − Management
- −$1,867
- − Depreciation
- −$3,782
- Taxable income
- $7,211
- Est. tax owed @ 24.0%
- −$1,731
- After-tax cash flow
- $7,197/yr
For passive investors: Depreciation is non-cash, so a rental often shows a tax loss while cash-flowing — sheltering income. Rental losses are passive: they offset passive income freely, and up to $25,000/yr can offset ordinary (W-2) income if you actively participate and your MAGI is under $100k (phasing out to $0 by $150k); unused losses carry forward. On sale, claimed depreciation is recaptured at up to 25%, and gains may owe capital-gains tax (a 1031 exchange can defer both). Figures are a year-1 estimate at your 24.0% rate — not tax advice; consult a CPA.
Schools (NCES district)
- District
- St. Louis City
- NCES district ID
- 2929280
- Math proficiency
- 10% ▼ -6.00%
- Reading proficiency
- 18% ▼ -3.00%
- Median HH income
- $35,685
- Composite
- 11.54/100
- National rank
- #9699
- State rank
- #312 of 324 in MO
Livability — St. Louis
No livability data for this city. (Only ~50 U.S. cities are tracked.)
Census & demographics
- Census place
- St. Louis, MO
- County
- Saint Louis City · 254,015 people
- City population
- 283,259
- Metro
- St. Louis, MO-IL
- Population (ZIP)
- 42,170
- Household income
- $61,433
- Rent vs Own
- Severe rent burden
- 1923.0
Population outlook (St. Louis County) Hauer SSP2
- Today (2025)
- 315,737 people
- By 2030
- 313,865 · -0.6%
- By 2040
- 305,439 · -3.3%
- By 2050
- 296,529 · -6.1%
- By 2075
- 271,028 · -14.2%
- By 2100
- 255,359 · -19.1%
Race, ethnicity, and origin ACS 2023
- Neighborhood character
- Diverse neighborhood (Simpson 0.63)
- Race & ethnicity
- White 54% Black 27% Hispanic / Latino 10% Two or more races 8% Asian 5%
- Hispanic origin (detail)
- Mexican 7%
- Common ancestry
- Lithuanian 4% Romanian 2% Italian 2%
- Foreign-born
- 11% · Canada, Vietnam, Philippines
- Languages at home
- 85% English-only · Spanish 6% Vietnamese 2% Arabic 2%
Political lean MEDSL · St. Louis
- 2024 margin
- Solid D (+64.7) · D 81.4% · R 16.7% · Other 2.0%
- 2008→2024 swing
- -3.5pp toward R · 2008: 68.2pp · 2024: 64.7pp
- All cycles
- 2024: D+64.7 2020: D+66.2 2016: D+63.7 2012: D+66.6 2008: D+68.2
Not yet ingested
- Civics
- —
Market trends
- HPI YoY
- ▼ -271.19%
- Current HPI
- 215.7108
- Rent YoY
- ▲ 2.62%
- Metro
- St. Louis, MO-IL
- State GDP YoY
- ▲ 1.84%
- F500 in state
- 20
Industry mix (Fortune 500 HQ in MO)
| Industry | F500 HQs | Revenue |
|---|---|---|
| Healthcare | 1 | $163B |
|
||
| Insurance | 1 | $21B |
|
||
| Industrial Technology | 1 | $17B |
|
||
| Retail | 1 | $16B |
|
||
| Industrial Distribution | 1 | $10B |
|
||
| Utilities | 1 | $9B |
|
||
Price history
+15.6% since first listed21 events — show timeline
- 2026-04-30 Pending — MARIS as Distributed by MLS Grid
- 2026-04-24 Listed $130,000 MARIS as Distributed by MLS Grid
- 2024-12-16 Relisted — MARIS as Distributed by MLS Grid
- 2024-12-16 Price Changed $180,500 MARIS as Distributed by MLS Grid
- 2024-12-02 Delisted — MARIS as Distributed by MLS Grid
- 2024-08-30 Listed $182,999 MARIS as Distributed by MLS Grid
- 2024-02-03 Delisted — MARIS as Distributed by MLS Grid
- 2024-01-14 Price Changed $187,000 MARIS as Distributed by MLS Grid
- 2023-12-07 Price Changed $188,000 MARIS as Distributed by MLS Grid
- 2023-11-17 Listed $198,000 MARIS as Distributed by MLS Grid
- 2021-06-04 Sold (Public Records) $58,000 Public Records
- 2021-05-29 Pending — MARIS as Distributed by MLS Grid
- 2021-05-28 Sold (MLS) — MARIS as Distributed by MLS Grid
- 2021-03-29 Listed $69,900 MARIS as Distributed by MLS Grid
- 2018-05-14 Sold (MLS) — MARIS as Distributed by MLS Grid
- 2018-04-10 Pending — MARIS as Distributed by MLS Grid
- 2018-04-10 Delisted — MARIS as Distributed by MLS Grid
- 2018-04-09 Pending — MARIS as Distributed by MLS Grid
- 2018-04-09 Listed $25,000 MARIS as Distributed by MLS Grid
- 2006-01-24 Sold (Public Records) $112,500 Public Records
- 2003-04-18 Sold (Public Records) — Public Records
Property tax history
-0.6%/yrLatest (2024): $682 · +5.0% YoY. Source: county tax records.
Cash-flow waterfall
monthlySold comps — $/sqft
last 12 mo · ≤1 miLoading sold comps…