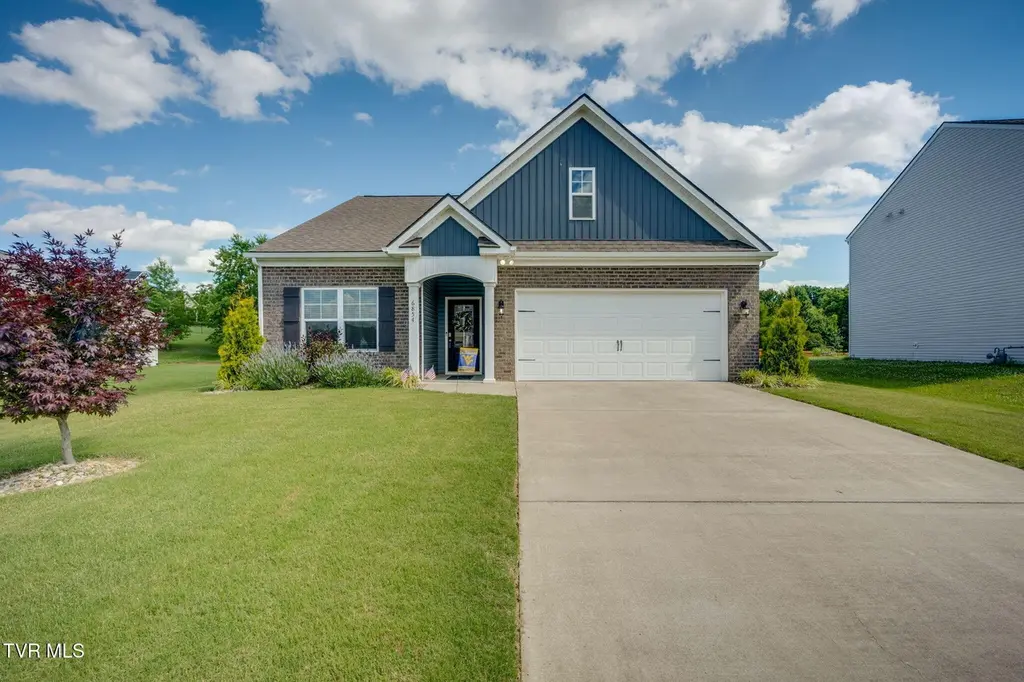
6854 Wildlife Cir · Johnson City, TN
Flood risk 1/10 · Minimal
- FEMA flood zone
- X (unshaded)
- Chance of flooding over 30 yrs
- 0.0%
- Est. flood insurance / yr
- $507 – $1,088
Fire risk 5/10 · Moderate
- Est. fire insurance / yr
- $949 – $1,763
Heat risk 4/10 · Minor
- Hot days now (above 99°F)
- 7 days/yr
- Hot days in 30 yrs
- 21 days/yr
Wind risk 2/10 · Minimal
- Chance of severe wind over 30 yrs
- —
Air-quality risk 2/10 · Minimal
- Unhealthy air days now
- 1 days/yr
- Unhealthy air days in 30 yrs
- 2 days/yr
Risk factors via First Street. Map © Google.
Why this score? — see what drove the B- grade
The composite is a weighted blend of 9 inputs, each scored 0–100. Each bar is that input's sub-score; the figure is the points it added to the 100-point composite (weight × sub-score).
- Cash flow +30.0/30.0
- 1% rule +10.0/10.0
- DSCR +10.0/10.0
- ARV discount +4.9/15.0
- Condition / age +4.0/5.0
- Livability +3.8/5.0
- Rent growth +2.5/5.0
- Schools +1.8/10.0
- Appreciation +0.0/10.0
$354,900
🖨 Deal sheet (PDF) 📄 Offer letter ✓ Due diligence
Listing remarks
Looking for a peaceful home that offers one level living? This charming 3- bedroom, 2-bath home sits on an exterior lot, offering a backyard with additional patio space to be used for entertainment and an irrigation system to keep the lawn beautiful. Step inside to a comfortable, easy-flow layout designed for everyday living. Located within minutes of Johnson City and Piney Flats allowing for easy access to all of Tri-Cities. Book your showing today! (All resources are from third parties, buyer to verify. )
Key facts
- Easy access
- Backyard
- Irrigation system
Tags
Property features AI
Finance
- Other: Lot dimensions approximately 120 x 77 (0.2 acres); Zoning: R 3B
- HOA & community: Homeowners association with landscaping; HOA fee $250 annually (about $20.83/month)
Exterior
- Parking: 2-car garage; Driveway; Garage door opener
- Security: Smoke detectors
- Utilities: Public water; Public sewer
- Home design: Single-family house; One story; Facing direction not specified; Entry level not specified
- Construction: Brick and vinyl siding exterior; Shingle roof; Slab foundation; Built year not specified
- Exterior features: Level topography; Subdivision: The Cliffs At Boone Lake
Interior
- Kitchen: Dishwasher; Gas range; Microwave; Refrigerator
- Bedrooms: Total of 7 rooms (bedroom count not specified)
- Bathrooms: 2 full bathrooms
- Heating & cooling: Heat pump; Ceiling fans; Natural gas heating
- Interior features: Double-pane windows; Gas-log fireplace
- Laundry & utility: Washer hookup
Neighborhood map
What this means for you Summary
Snapshot
- This is a 3-bed/2.0-bath single-family listed at $355k. Condition is rated good.
Deal economics
- At list price, monthly cash flow is $4k ($48k/yr) — positive.
- The deal already cash-flows at list — no discount required.
- Meets the 1% rule at list price ($8k rent vs $355k).
- Cap rate 20.0% vs local median 3.1% in Johnson City — top-decile yield for the area; either an underpriced asset or a hidden risk that comps aren't pricing in. Stress-test before assuming the spread holds.
Location & tenants
- Location reads 76/100 on livability (#8 in TN, #3,349 nationally) — a middle-class / working-renter tenant base. Strengths: amenities A+, cost of living A+, health & safety A; Watch: crime D, commute F, employment F.
- Sullivan County (suburban): math 17% / reading 24% proficiency, ranked #109 of 139 in TN (top 78%) — low school quality limits family demand, transient renter base, plan for 1-2y turnover.
- Zoned schools: Mary Hughes School (math 27% / reading 22%, grade F, #546 of 952 statewide, top 61%, 339 students, 0% FRL); Sullivan East Middle School (math 8% / reading 11%, grade F, #260 of 333 statewide, top 79%, 573 students, 0% FRL); Sullivan East High School (math 10% / reading 27%, grade F, #208 of 332 statewide, top 63%, 849 students, 0% FRL) — zoned schools average 0% FRL vs 45% district-wide (45 pts lower); this property's tenant base skews higher-income than the district average.
- Market conditions: 87 active listings in the ZIP; 1 comparable units currently listed for rent nearby; 453 units permitted in Sullivan County in 2024 (6 in 5+ unit buildings).
Forward outlook
- Local home prices are declining (-3.0%/yr); year-one equity from $2k of loan paydown is wiped out by about $11k of value loss. Plan a longer hold.
- Sullivan County population projected to shrink 5% by 2050 — rents likely to lag national; underwrite the cash flow, not the appreciation.
- At projected returns (-3.0% appreciation + 3.0% rent growth), your $99k cash investment doubles in ~3 years — after that, you're playing with house money.
Negotiation context
- Only 5 days on market — expect competitive offers; lowballing is unlikely to land.
Risks & watch-outs
- Climate carrying-cost: moderate wildfire risk — expect insurance premiums to compound above CPI over the hold.
Questions for the listing agent
- What does the HOA fee cover, when was the last increase, and are there any pending special assessments or reserve-fund shortfalls?
- Is there a deadline driving the sale (1031 exchange, divorce, estate, relocation)? That informs how much negotiation room exists.
- Crime grade is D in this area — have there been break-ins, vandalism, or insurance claims at this property in the last 3 years? What carrier currently insures it and at what premium?
- What's the average days-on-market for RENTAL listings here right now (not sales)? A rising rental-DOM trend means longer vacancies and softer asking-rent achievability than the comps imply.
- What's the recent tenant-quality profile in this submarket — average credit score on applications, eviction rate, late-payment / NSF rate, and stable-employment percentage? A property-management company in the area should have these aggregated.
- How much new for-sale + rental construction is in the pipeline within 1–3 miles? Heavy new supply typically softens prices + rents 12–24 months out; constrained supply supports both.
Investment metrics
- 1% rule
- 2.32% ✓
- Cap rate
- 19.96%
- Cash-on-cash
- 48.79%
- DSCR
- 3.17
- GRM
- 3.6
CMA / ARV
- ARV (on-the-fly)
- $335,780
- Comps found
- 12
Show comp detail 12 sales within ~0.75 mi
| Address | Dist | Beds/Ba | Sqft | Sold | Price | $/sf | Match |
|---|---|---|---|---|---|---|---|
| 1496 Raccoon Ln | 0.26mi | 3/2.0 | 1,618 (-1%) | 10mo | $350,000 | $216 | 78 |
| 1335 Raccoon Ln | 0.18mi | 3/2.0 | 1,623 (-0%) | 16mo | $357,000 | $220 | 78 |
| 1202 Raccoon Ln | 0.18mi | 3/2.0 | 1,689 (+4%) | 11mo | $330,000 | $195 | 76 |
| 447 Bayhill Dr | 0.29mi | 3/2.0 | 1,568 (-4%) | 6mo | $262,000 | $167 | 75 |
| 5130 Wildlife Cir | 0.16mi | 4/2.0 (+1) | 1,756 (+8%) | 1mo | $362,000 | $206 | 74 |
| 2206 Egret Ln | 0.13mi | 3/2.0 | 1,711 (+5%) | 18mo | $350,000 | $205 | 70 |
| 5031 Wildlife Cir | 0.08mi | 4/2.0 (+1) | 1,764 (+8%) | 12mo | $372,000 | $211 | 68 |
| 5659 Wildlife Cir | 0.22mi | 4/2.0 (+1) | 1,774 (+9%) | 4mo | $370,000 | $209 | 66 |
| 5034 Wildlife Cir | 0.09mi | 4/2.0 (+1) | 1,768 (+8%) | 13mo | $359,000 | $203 | 66 |
| 521 Baywood Dr | 0.49mi | 3/2.5 | 1,615 (-1%) | 11mo | $389,429 | $241 | 65 |
| 1545 Raccoon Ln | 0.25mi | 4/2.0 (+1) | 1,764 (+8%) | 8mo | $360,000 | $204 | 63 |
| 2310 Egret Ln | 0.16mi | 4/2.0 (+1) | 1,851 (+14%) | 12mo | $360,000 | $194 | 55 |
Match score weights: distance 35% · size 25% · config 20% · recency 20%. Top-matched comps best support the ARV.
Projected returns pro-forma
-3.0% appreciation · 3.0% rent growth · sell at horizon
- IRR
- 46.4%
- Equity multiple
- 3.01×
- Total profit
- $199,983
- Equity at exit
- $52,917
- IRR
- 52.1%
- Equity multiple
- 6.09×
- Total profit
- $506,085
- Equity at exit
- $30,685
Cash invested: $99,372 (down + closing). Projections, not guarantees.
Landlord ↔ Tenant lean methodology
- Overall (STATE)
- 87 Strongly Landlord-Friendly
- State Tennessee
- 87 Strongly Landlord-Friendly · R+13
- County
- — inherits STATE
- City
- — inherits STATE
ZIP-level market 37686
- Home prices YoY
- -10.2%
- Active inventory
- 87
- Price-to-rent
- 3.6×
Monthly cashflow live
- Estimated rent
- $8,246 medium interval (Pro) →
- Mortgage (P&I)
- −$1,861
- Tax est. 1.5%
- −$444 /mo · $5,324/yr
- Insurance
- −$148
- HOA
- −$21
- Vacancy / Maint / Mgmt
- −$1,732
- Net cashflow
- $4,041
Break-even live
Sensitivity live
| Price | -10% $4,286 | -5% $4,163 | +0% $4,041 | +5% $3,918 | +10% $3,795 |
|---|---|---|---|---|---|
| Rent | -10% $3,389 | -5% $3,715 | +0% $4,041 | +5% $4,366 | +10% $4,692 |
| Rate | -1.0pp $4,219 | -0.5pp $4,131 | base $4,041 | +0.5pp $3,949 | +1.0pp $3,855 |
UW: 25.0% down · 7.5% · 30yr · 1.5% tax · 5.0% vac · 8.0% maint · 8.0% mgmt
Financing live
Cash to close
- Down payment
- $88,725
- Closing costs
- $10,647
- Reserves months
- —
- Total cash needed
- —
Loan-product check · same deal, 3 products live
Conventional
25% down · 7.5% · 30yr
- Down + closing
- —
- Monthly P&I
- —
- Monthly cashflow
- —
- DSCR
- —
- Eligible?
- —
Personal DTI + credit; lowest rate.
DSCR
20% down · 8.5% · 30yr
- Down + closing
- —
- Monthly P&I
- —
- Monthly cashflow
- —
- DSCR
- —
- Eligible?
- —
No personal income docs; deal must DSCR.
Hard money
10% down · 12.0% · 12mo
- Down + closing
- —
- Monthly P&I
- —
- Monthly cashflow
- —
- DSCR
- —
- Eligible?
- —
Short-term bridge; refi at stabilization.
Rent comps 1 comps
| Address | Beds | Baths | Sqft | Rent | $/sqft | DOM | Units | Dist |
|---|---|---|---|---|---|---|---|---|
| 521 Baywood Dr Unit 1397963P Piney Flats, TN | 2.0 | 2.5 | 1614 | $8,246 | $5.11 | 22d | 1 | 0.48mi |
HOA detail
- Monthly dues
- $21 · $252/yr
Listing history 5 events
-
2026-06-21pricedays on market $354,900 Active 5 DOM
-
2026-06-19days on market $364,900 Active 3 DOM
-
2026-06-18days on market $364,900 Active 2 DOM
-
2026-06-17remarks 512-char remark
-
2026-06-17$364,900 Active 1 DOM
ⓘ Source: listings_history table (triggers on properties + properties_extension) + one-shot
backfill from property_details.listing_events for pre-trigger history.
Climate risk First Street
- Flood 1/10 Low FEMA zone X (unshaded) · 0% chance over 30 yrs
- Wildfire 5/10 Major
- Heat 4/10 Moderate 7 d/yr ≥99°F today · 21 d/yr by 30 yrs out
- Wind 2/10 Low
- Air quality 2/10 Low 1 unhealthy d/yr today · 2 by 30 yrs out
Nearby sold comps map
Loading sold comps map…
Walkable amenities ~0.75 mi
Loading nearby amenities…
Taxation est. · year 1
- Rental income
- $98,952
- − Mortgage interest
- −$19,880
- − Property taxes
- −$5,324
- − Insurance
- −$1,774
- − Repairs & maintenance
- −$7,916
- − Management
- −$7,916
- − HOA
- −$252
- − Depreciation
- −$10,324
- Taxable income
- $45,565
- Est. tax owed @ 24.0%
- −$10,936
- After-tax cash flow
- $37,553/yr
For passive investors: Depreciation is non-cash, so a rental often shows a tax loss while cash-flowing — sheltering income. Rental losses are passive: they offset passive income freely, and up to $25,000/yr can offset ordinary (W-2) income if you actively participate and your MAGI is under $100k (phasing out to $0 by $150k); unused losses carry forward. On sale, claimed depreciation is recaptured at up to 25%, and gains may owe capital-gains tax (a 1031 exchange can defer both). Figures are a year-1 estimate at your 24.0% rate — not tax advice; consult a CPA.
Condition & rehab AI · 12 photos
This charming single-family home offers a peaceful and move-in-ready living experience with a good condition score and minimal repairs needed.
Value-add opportunities
- Both landscaping — enhances curb appeal and adds value
- Resale upgrading kitchen appliances — modernizes the space and appeals to buyers
- Resale painting interior walls — fresh paint enhances curb appeal and interior aesthetics
Renovation cost estimate screening
Value-add ROI direction
- Both landscaping — enhances curb appeal and adds value ↑
- Resale upgrading kitchen appliances — modernizes the space and appeals to buyers ↑
- Resale painting interior walls — fresh paint enhances curb appeal and interior aesthetics ↑
ⓘ Cost ranges are severity-bucket heuristics (US national rule-of-thumb). Get contractor quotes + a written scope before underwriting a rehab budget.
Schools (NCES district)
- District
- Sullivan County
- NCES district ID
- 4703990
- Math proficiency
- 17% ▼ -15.00%
- Reading proficiency
- 24% ▼ -10.00%
- Median HH income
- $43,263
- Composite
- 17.66/100
- National rank
- #9030
- State rank
- #109 of 139 in TN
Livability — Johnson City
- Score
- 76/100
- State rank
- #8
- US rank
- #3349
Category grades
Schools grade is shown separately in the Schools card above.
Census & demographics
- City population
- 99,926
- Population (ZIP)
- 9,149
Population outlook (Sullivan County) Hauer SSP2
- Today (2025)
- 157,030 people
- By 2030
- 156,415 · -0.4%
- By 2040
- 153,778 · -2.1%
- By 2050
- 149,018 · -5.1%
- By 2075
- 138,068 · -12.1%
- By 2100
- 119,927 · -23.6%
Race, ethnicity, and origin ACS 2023
- Neighborhood character
- Predominantly White (92%)
- Race & ethnicity
- White 92% Asian 3% Hispanic / Latino 2% Two or more races 2% Black 1%
- Common ancestry
- Iranian 7% Slovak 3% Serbian 3%
- Foreign-born
- 1%
- Languages at home
- 99% English-only · Spanish 1%
Political lean MEDSL · Sullivan
- 2024 margin
- Solid R (+55.0) · D 22.0% · R 77.0% · Other 1.0%
- 2008→2024 swing
- -13.6pp toward R · 2008: -41.3pp · 2024: -55.0pp
- All cycles
- 2024: R+55.0 2020: R+51.9 2016: R+56.2 2012: R+47.2 2008: R+41.3
Not yet ingested
- Civics
- —
Market trends
- HPI YoY
- ▼ -34.96%
- Current HPI
- 306.7377
- Rent YoY
- —
- Metro
- —
- State GDP YoY
- ▲ 2.78%
- F500 in state
- 22
Industry mix (Fortune 500 HQ in TN)
| Industry | F500 HQs | Revenue |
|---|---|---|
| Healthcare | 3 | $91B |
|
||
| Retail | 3 | $72B |
|
||
| Transportation / Logistics | 1 | $88B |
|
||
| Paper / Packaging | 1 | $19B |
|
||
| Insurance | 1 | $13B |
|
||
| Energy | 1 | $12B |
|
||
Price history
1 event — show timeline
- 2026-06-16 Listed $364,900 TVRMLS
Cash-flow waterfall
monthlySold comps — $/sqft
last 12 mo · ≤1 miLoading sold comps…