210 Ben Lacy Dr · Gun Barrel City, TX
Flood risk 1/10 · Minimal
- FEMA flood zone
- X (unshaded)
- Chance of flooding over 30 yrs
- 0.0%
- Est. flood insurance / yr
- $507 – $1,088
Fire risk 2/10 · Minimal
- Est. fire insurance / yr
- $1,222 – $2,270
Heat risk 7/10 · Major
- Hot days now (above 109°F)
- 7 days/yr
- Hot days in 30 yrs
- 24 days/yr
Wind risk 6/10 · Moderate
- Chance of severe wind over 30 yrs
- 55.0%
Air-quality risk 2/10 · Minimal
- Unhealthy air days now
- 0 days/yr
- Unhealthy air days in 30 yrs
- 1 days/yr
Risk factors via First Street. Map © Google.
Why this score? — see what drove the C grade
The composite is a weighted blend of 9 inputs, each scored 0–100. Each bar is that input's sub-score; the figure is the points it added to the 100-point composite (weight × sub-score).
- Cash flow +30.0/30.0
- DSCR +10.0/10.0
- 1% rule +8.3/10.0
- Schools +3.8/10.0
- Livability +3.4/5.0
- Condition / age +2.5/5.0
- Rent growth +1.1/5.0
- ARV discount +0.0/15.0
- Appreciation +0.0/10.0
$89,000
🖨 Deal sheet 📄 Offer letter ✓ Due diligence
Listing remarks MLS
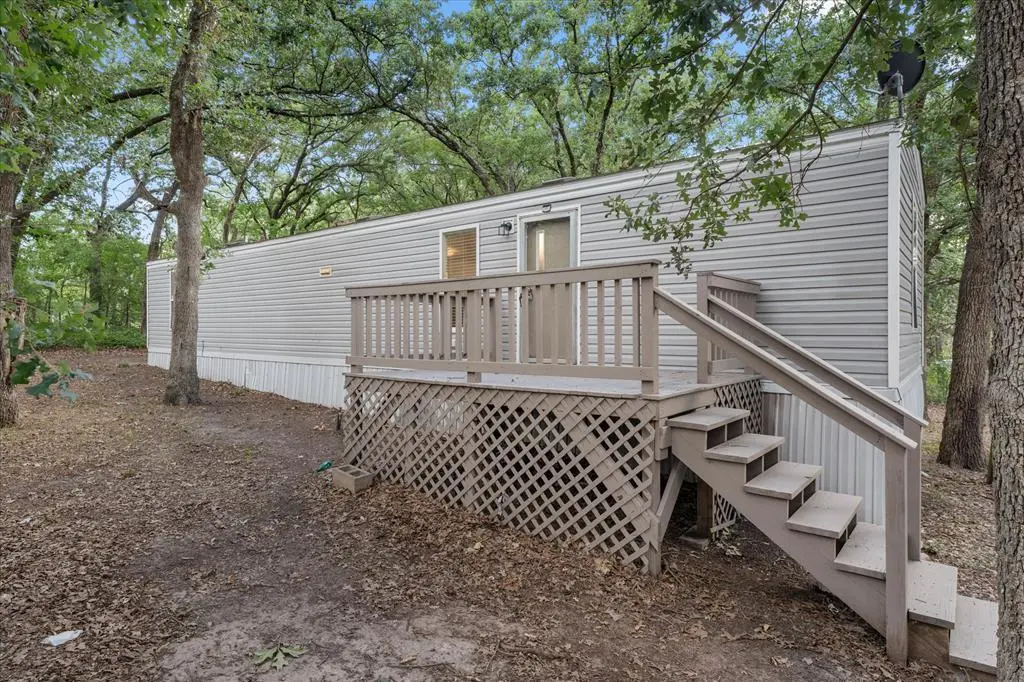
NICE SINGLEWIDE ON 2 LOTS IN GREAT CONDITION. BUILT IN 2015 THIS 2 BEDROOM 1 BATH SITS ACROSS THE STREET FROM THE LAKE. HAS OPEN DESIGN, NICE DECK ON FRONT, WATERFRONT AREA WITH BOAT LAUNCH. GREAT LAKE RENTAL!!! SELLER WILL CONSIDER OWNER FINANCING WITH 20% DOWN. YOU CAN BUY CHEAPER THAN RENTING.
Key facts
- Open design
- Boat launch
- 2 lots
Tags
Property features AI
Finance
- Financial info: Listing terms include Cash, Conventional, Owner will carry
- HOA & community: Mandatory association (Siesta Shores POA); Association management fees included; Association fee listed as $0 annually
Exterior
- Parking: No garage or covered parking; No carport
- Security: Smoke detector(s)
- Utilities: City water; City sewer; Not in a municipal utility district
- Home design: Residential mobile home; Single story; Not attached; Built in 2015
- Construction: Vinyl siding; Composition roof; Other foundation
- Exterior features: Few trees on the lot; Subdivision: Siesta Shores POA; Directions: HWY 334 to Welch Ln to Box Rd, go right to Siesta Shores Kim Dr, follow to Ben Lacy then right — property on the right
Interior
- Kitchen: Dishwasher
- Bedrooms: 2 bedrooms (both on the main level)
- Bathrooms: 1 full bathroom
- Heating & cooling: Central heating (electric); Central air conditioning; Ceiling fans
- Interior features: One-level home; Living area with one living space and one dining area; Other interior features; Dishwasher
- Laundry & utility: Electric dryer hookup
Neighborhood map
What this means for you Summary
Snapshot
- This is a 2-bed/1.0-bath manufactured listed at $89k.
Deal economics
- At list price, monthly cash flow is $402 ($5k/yr) — positive.
- The deal already cash-flows at list — no discount required.
- Meets the 1% rule at list price ($1k rent vs $89k).
- Recommended offer: $88k (1.5% below list) — sets the bar for market timing.
- Cap rate 11.7% vs local median 3.3% in Gun Barrel City — top-decile yield for the area; either an underpriced asset or a hidden risk that comps aren't pricing in. Stress-test before assuming the spread holds.
Location & tenants
- Location reads 67/100 on livability (#519 in TX) — a middle-class / working-renter tenant base. Strengths: cost of living A+, housing A+, health & safety B+; Watch: employment D+, amenities F, commute F.
- Mabank ISD (town): math 47% / reading 44% proficiency, ranked #273 of 826 in TX (top 33%) — families likely to look elsewhere, expect single-tenant / working-renter base with shorter leases.
- Market conditions: Rents falling (-5.8%/yr); 694 active listings in the ZIP; 263 units permitted in Henderson County in 2024 (0 in 5+ unit buildings).
Forward outlook
- Local home prices are declining (-3.0%/yr); year-one equity from $615 of loan paydown is wiped out by about $3k of value loss. Plan a longer hold.
- At projected returns (-3.0% appreciation + 0.0% rent growth), your $25k cash investment doubles in ~8 years — after that, you're playing with house money.
Negotiation context
- It's been on market 24 days — a 2% lower offer ($88k) is reasonable based on typical stale-listing flexibility.
- 5 sale attempts since 11y ago with the ask held roughly flat each time — persistent listings suggest the price (not the market) is what's stuck; bring a comps-based counter.
Risks & watch-outs
- Climate carrying-cost: major wind risk, 55% chance of damaging wind over 30y; extreme-heat days projected 7→24/yr by 2055 (HVAC capex compounding) — expect insurance premiums to compound above CPI over the hold.
Questions for the listing agent
- Is there a deadline driving the sale (1031 exchange, divorce, estate, relocation)? That informs how much negotiation room exists.
- What's the average days-on-market for RENTAL listings here right now (not sales)? A rising rental-DOM trend means longer vacancies and softer asking-rent achievability than the comps imply.
- What's the recent tenant-quality profile in this submarket — average credit score on applications, eviction rate, late-payment / NSF rate, and stable-employment percentage? A property-management company in the area should have these aggregated.
- How much new for-sale + rental construction is in the pipeline within 1–3 miles? Heavy new supply typically softens prices + rents 12–24 months out; constrained supply supports both.
Investment metrics
- 1% rule
- 1.33% ✓
- Cap rate
- 11.71%
- Cash-on-cash
- 19.34%
- DSCR
- 1.86
- GRM
- 6.3
CMA / ARV
- ARV (on-the-fly)
- $69,776
- Comps found
- 3
Show comp detail 3 sales within ~0.75 mi
| Address | Dist | Beds/Ba | Sqft | Sold | Price | $/sf | Match |
|---|---|---|---|---|---|---|---|
| 115 Hiawatha Dr | 0.25mi | 2/1.5 | 868 (+11%) | 22mo | $55,000 | $63 | 50 |
| 124 Meadowlark Ln | 0.53mi | 2/2.0 | 896 (+14%) | 1mo | $80,000 | $89 | 47 |
| 103 Erie Dr | 0.21mi | 3/2.0 (+1) | 900 (+15%) | 22mo | $149,900 | $167 | 38 |
Match score weights: distance 35% · size 25% · config 20% · recency 20%. Top-matched comps best support the ARV.
Projected returns pro-forma
-3.0% appreciation · 0.0% rent growth · sell at horizon
- IRR
- 8.1%
- Equity multiple
- 1.31×
- Total profit
- $7,663
- Equity at exit
- $13,270
- IRR
- 14.8%
- Equity multiple
- 2.05×
- Total profit
- $26,094
- Equity at exit
- $7,695
Cash invested: $24,920 (down + closing). Projections, not guarantees.
Landlord ↔ Tenant lean methodology
- Overall (STATE)
- 87 Strongly Landlord-Friendly
- State Texas
- 87 Strongly Landlord-Friendly · R+5
- County
- — inherits STATE
- City
- — inherits STATE
ZIP-level market 75156
- Rents YoY
- -5.8%
- Active inventory
- 694
- Price-to-rent
- 6.3×
Monthly cashflow live
- Estimated rent
- $1,182 medium interval (Pro) →
- Mortgage (P&I)
- −$467
- Tax from tax record
- −$28 /mo · $338/yr
- Insurance
- −$37
- HOA
- −$0
- Vacancy / Maint / Mgmt
- −$248
- Net cashflow
- $402
Break-even live
UW: 25.0% down · 7.5% · 30yr · 1.5% tax · 5.0% vac · 8.0% maint · 8.0% mgmt
Financing live
Cash to close
- Down payment
- $22,250
- Closing costs
- $2,670
- Reserves months
- —
- Total cash needed
- —
Loan-product check · same deal, 3 products live
Conventional
25% down · 7.5% · 30yr
- Down + closing
- —
- Monthly P&I
- —
- Monthly cashflow
- —
- DSCR
- —
- Eligible?
- —
Personal DTI + credit; lowest rate.
DSCR
20% down · 8.5% · 30yr
- Down + closing
- —
- Monthly P&I
- —
- Monthly cashflow
- —
- DSCR
- —
- Eligible?
- —
No personal income docs; deal must DSCR.
Hard money
10% down · 12.0% · 12mo
- Down + closing
- —
- Monthly P&I
- —
- Monthly cashflow
- —
- DSCR
- —
- Eligible?
- —
Short-term bridge; refi at stabilization.
Listing history 25 events
-
2026-06-19days on market $89,000 Active 24 DOM
-
2026-06-18days on market $89,000 Active 23 DOM
-
2026-06-17days on market $89,000 Active 22 DOM
-
2026-06-16days on market $89,000 Active 21 DOM
-
2026-06-15days on market $89,000 Active 20 DOM
-
2026-06-14days on market $89,000 Active 18 DOM
-
2026-06-12days on market $89,000 Active 17 DOM
-
2026-06-09days on market $89,000 Active 14 DOM
-
2026-06-08days on market $89,000 Active 13 DOM
-
2026-06-07days on market $89,000 Active 12 DOM
-
2026-06-05days on market $89,000 Active 9 DOM
-
2026-06-03days on market $89,000 Active 8 DOM
-
2026-06-02days on market $89,000 Active 7 DOM
-
2026-06-01days on market $89,000 Active 6 DOM
-
2026-05-31days on market $89,000 Active 5 DOM
-
2026-05-30days on market $89,000 Active 4 DOM
-
2026-05-26$89,000 Active 297-char remark
Show marketing remark (297 chars)
NICE SINGLEWIDE ON 2 LOTS IN GREAT CONDITION. BUILT IN 2015 THIS 2 BEDROOM 1 BATH SITS ACROSS THE STREET FROM THE LAKE. HAS OPEN DESIGN, NICE DECK ON FRONT, WATERFRONT AREA WITH BOAT LAUNCH. GREAT LAKE RENTAL!!! SELLER WILL CONSIDER OWNER FINANCING WITH 20% DOWN. YOU CAN BUY CHEAPER THAN RENTING.
-
2026-05-26$89,000 Active
Show marketing remark (297 chars)
NICE SINGLEWIDE ON 2 LOTS IN GREAT CONDITION. BUILT IN 2015 THIS 2 BEDROOM 1 BATH SITS ACROSS THE STREET FROM THE LAKE. HAS OPEN DESIGN, NICE DECK ON FRONT, WATERFRONT AREA WITH BOAT LAUNCH. GREAT LAKE RENTAL!!! SELLER WILL CONSIDER OWNER FINANCING WITH 20% DOWN. YOU CAN BUY CHEAPER THAN RENTING.
-
2017-05-12soldstatus 293-char remark
Show marketing remark (293 chars)
ALMOST NEW! 2-1 SINGLEWIDE MOBILE HOME ON 2 LOTS ACROSS FROM THE LAKE. LOTS OF LARGE TREES, SKIRTING FOR THE MOBILE IS PILED UNDERNEATH IT AS THE MOBILE WAS NEWLY PUT THERE. REFRIGERATOR, WASHER AND DRYER, AND SOME FURNITURE STAYS WITH PROPERTY. HAS CENTRAL HEAT BUT NEEDS OUTSIDE UNIT FOR AC.
-
2017-05-12soldstatus Sold
Show marketing remark (293 chars)
ALMOST NEW! 2-1 SINGLEWIDE MOBILE HOME ON 2 LOTS ACROSS FROM THE LAKE. LOTS OF LARGE TREES, SKIRTING FOR THE MOBILE IS PILED UNDERNEATH IT AS THE MOBILE WAS NEWLY PUT THERE. REFRIGERATOR, WASHER AND DRYER, AND SOME FURNITURE STAYS WITH PROPERTY. HAS CENTRAL HEAT BUT NEEDS OUTSIDE UNIT FOR AC.
-
2017-04-12status Pending
-
2017-03-27$39,000 Active
Show marketing remark (293 chars)
ALMOST NEW! 2-1 SINGLEWIDE MOBILE HOME ON 2 LOTS ACROSS FROM THE LAKE. LOTS OF LARGE TREES, SKIRTING FOR THE MOBILE IS PILED UNDERNEATH IT AS THE MOBILE WAS NEWLY PUT THERE. REFRIGERATOR, WASHER AND DRYER, AND SOME FURNITURE STAYS WITH PROPERTY. HAS CENTRAL HEAT BUT NEEDS OUTSIDE UNIT FOR AC.
-
2017-03-27$39,000 293-char remark
Show marketing remark (293 chars)
ALMOST NEW! 2-1 SINGLEWIDE MOBILE HOME ON 2 LOTS ACROSS FROM THE LAKE. LOTS OF LARGE TREES, SKIRTING FOR THE MOBILE IS PILED UNDERNEATH IT AS THE MOBILE WAS NEWLY PUT THERE. REFRIGERATOR, WASHER AND DRYER, AND SOME FURNITURE STAYS WITH PROPERTY. HAS CENTRAL HEAT BUT NEEDS OUTSIDE UNIT FOR AC.
-
2015-12-08soldstatus
-
2015-05-26$3,000
ⓘ Source: listings_history table (triggers on properties + properties_extension) + one-shot
backfill from property_details.listing_events for pre-trigger history.
Tax reassessment forecast TX · Resets to sale price
- Current annual tax
- $338 · $28/mo
- Projected year-2 tax
- $1,629 · $136/mo
- Expected delta
- +$1,291/yr (+$108/mo · 381.9%)
ⓘ Screening estimate from a state-policy table — verify with the county assessor before closing.
Climate risk First Street
- Flood 1/10 Low FEMA zone X (unshaded) · 0% chance over 30 yrs
- Wildfire 2/10 Low
- Heat 7/10 Severe 7 d/yr ≥109°F today · 24 d/yr by 30 yrs out
- Wind 6/10 Major 55% chance of damaging wind over 30 yrs
- Air quality 2/10 Low 0 unhealthy d/yr today · 1 by 30 yrs out
Nearby sold comps map
Loading sold comps map…
Walkable amenities ~0.75 mi
Loading nearby amenities…
Taxation est. · year 1
- Rental income
- $14,182
- − Mortgage interest
- −$4,985
- − Property taxes
- −$338
- − Insurance
- −$445
- − Repairs & maintenance
- −$1,135
- − Management
- −$1,135
- − Depreciation
- −$2,589
- Taxable income
- $3,555
- Est. tax owed @ 24.0%
- −$853
- After-tax cash flow
- $3,967/yr
For passive investors: Depreciation is non-cash, so a rental often shows a tax loss while cash-flowing — sheltering income. Rental losses are passive: they offset passive income freely, and up to $25,000/yr can offset ordinary (W-2) income if you actively participate and your MAGI is under $100k (phasing out to $0 by $150k); unused losses carry forward. On sale, claimed depreciation is recaptured at up to 25%, and gains may owe capital-gains tax (a 1031 exchange can defer both). Figures are a year-1 estimate at your 24.0% rate — not tax advice; consult a CPA.
Schools (NCES district)
- District
- Mabank ISD
- NCES district ID
- 4828680
- Math proficiency
- 47% ▼ -19.00%
- Reading proficiency
- 44% ▼ -11.00%
- Median HH income
- $40,321
- Composite
- 38.15/100
- National rank
- #4267
- State rank
- #273 of 826 in TX
Livability — Gun Barrel City
- Score
- 67/100
- State rank
- #519
- US rank
- #10212
Category grades
Schools grade is shown separately in the Schools card above.
Census & demographics
- County
- Henderson County · 34,977 people
- Metro
- Athens, TX
- Population (ZIP)
- 16,333
- Household income
- $60,867
- Rent vs Own
- Severe rent burden
- 400.0
Population outlook (Henderson County) Hauer SSP2
- Today (2025)
- 80,471 people
- By 2030
- 80,608 · +0.2%
- By 2040
- 80,087 · -0.5%
- By 2050
- 78,208 · -2.8%
- By 2075
- 72,423 · -10.0%
- By 2100
- 61,012 · -24.2%
Race, ethnicity, and origin ACS 2023
- Neighborhood character
- Predominantly White (85%)
- Race & ethnicity
- White 85% Hispanic / Latino 7% Two or more races 7% Black 1%
- Hispanic origin (detail)
- Mexican 5%
- Common ancestry
- Slovak 3% Serbian 2% European 2%
- Foreign-born
- 4% · Canada, Jamaica
- Languages at home
- 94% English-only · Spanish 4% Other Indo-European 1%
Political lean MEDSL · Henderson
- 2024 margin
- Solid R (+63.5) · D 18.0% · R 81.4%
- 2008→2024 swing
- -18.8pp toward R · 2008: -44.6pp · 2024: -63.5pp
- All cycles
- 2024: R+63.5 2020: R+60.2 2016: R+60.0 2012: R+54.8 2008: R+44.6
Not yet ingested
- Civics
- —
Market trends
- HPI YoY
- ▼ -216.77%
- Current HPI
- 199.8108
- Rent YoY
- ▼ -5.76%
- Metro
- Athens, TX
- State GDP YoY
- ▲ 3.95%
- F500 in state
- 110
Industry mix (Fortune 500 HQ in TX)
| Industry | F500 HQs | Revenue |
|---|---|---|
| Energy | 16 | $1,198B |
|
||
| Technology | 5 | $198B |
|
||
| Engineering / Construction | 4 | $72B |
|
||
| Energy Services | 3 | $60B |
|
||
| Utilities | 3 | $41B |
|
||
| Healthcare | 2 | $330B |
|
||
Price history
+2866.7% since first listed9 events — show timeline
- 2026-05-26 Listed $89,000 HCBOR
- 2026-05-26 Listed $89,000 NTREIS
- 2017-05-12 Sold (MLS) — NTREIS
- 2017-05-12 Sold (MLS) — HCBOR
- 2017-04-12 Pending — NTREIS
- 2017-03-27 Listed $39,000 NTREIS
- 2017-03-27 Listed $39,000 HCBOR
- 2015-12-08 Sold (MLS) — HCBOR
- 2015-05-26 Listed $3,000 HCBOR
Property tax history
+0.0%/yrLatest (2025): $338 · +4.4% YoY. Source: county tax records.
Cash-flow waterfall
monthlySold comps — $/sqft
last 12 mo · ≤1 miLoading sold comps…