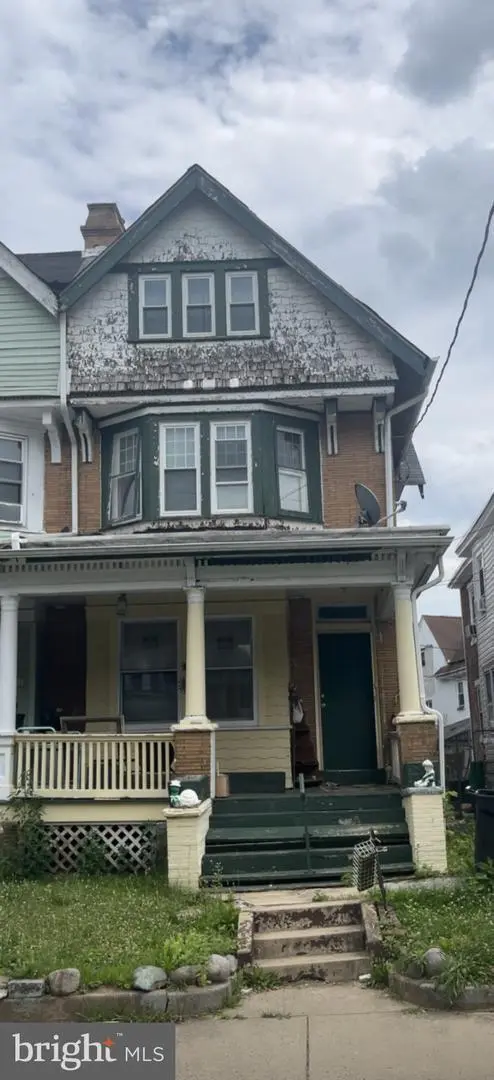
26 Delawareview Ave · Trenton, NJ
Flood risk 7/10 · Major
- FEMA flood zone
- X (unshaded)
- Chance of flooding over 30 yrs
- 0.76%
- Est. flood insurance / yr
- $507 – $1,088
Fire risk 3/10 · Minor
- Est. fire insurance / yr
- $526 – $976
Heat risk 7/10 · Major
- Hot days now (above 103°F)
- 7 days/yr
- Hot days in 30 yrs
- 15 days/yr
Wind risk 6/10 · Moderate
- Chance of severe wind over 30 yrs
- 27.0%
Air-quality risk 5/10 · Moderate
- Unhealthy air days now
- 6 days/yr
- Unhealthy air days in 30 yrs
- 8 days/yr
Risk factors via First Street. Map © Google.
Why this score? — see what drove the B- grade
The composite is a weighted blend of 9 inputs, each scored 0–100. Each bar is that input's sub-score; the figure is the points it added to the 100-point composite (weight × sub-score).
- Cash flow +30.0/30.0
- 1% rule +10.0/10.0
- DSCR +10.0/10.0
- ARV discount +7.5/15.0
- Livability +3.8/5.0
- Rent growth +3.2/5.0
- Condition / age +2.5/5.0
- Schools +0.7/10.0
- Appreciation +0.0/10.0
$129,000
🖨 Deal sheet 📄 Offer letter ✓ Due diligence
Key facts
- Built 1907
- Listed 23 days
Neighborhood map
What this means for you Summary
Snapshot
- This is a 4-bed/1.5-bath single-family listed at $129k.
Deal economics
- At list price, monthly cash flow is $991 ($12k/yr) — positive.
- The deal already cash-flows at list — no discount required.
- Meets the 1% rule at list price ($3k rent vs $129k).
- Recommended offer: $127k (1.5% below list) — sets the bar for market timing.
- Cap rate 16.1% vs local median 6.3% in Trenton — top-decile yield for the area; either an underpriced asset or a hidden risk that comps aren't pricing in. Stress-test before assuming the spread holds.
Location & tenants
- Location reads 76/100 on livability (#133 in NJ, #3,533 nationally) — a middle-class / working-renter tenant base. Strengths: amenities A+, commute A+, health & safety A+; Watch: schools F, crime F, employment F.
- Trenton Public School District (urban): math 2% / reading 16% proficiency, ranked #471 of 472 in NJ (top 100%) — low school quality limits family demand, transient renter base, plan for 1-2y turnover; 80% free/reduced lunch — lower-income household profile, screen leases tightly.
- Market conditions: Rents rising (+2.6%/yr); 144 active listings in the ZIP; 22 comparable units currently listed for rent nearby; rentals leasing fast (median 14d on market — plan ~1-2 weeks tenant-placement turnaround); 2,256 units permitted in Mercer County in 2024 (1,303 in 5+ unit buildings).
- At $2,644/mo this rent would consume 63% of the median local household income ($50k/yr) (locally 2116% of renters already pay >50% of income on rent) — very limited rent-growth headroom before tenants either downsize or default.
Forward outlook
- Local home prices are declining (-3.0%/yr); year-one equity from $892 of loan paydown is wiped out by about $4k of value loss. Plan a longer hold.
- Mercer County population projected at +4% by 2050 — modest demand growth; plan on rents tracking national, not racing it.
- At projected returns (-3.0% appreciation + 2.6% rent growth), your $36k cash investment doubles in ~4 years — after that, you're playing with house money.
Negotiation context
- It's been on market 23 days — a 2% lower offer ($127k) is reasonable based on typical stale-listing flexibility.
- Current owner paid $39k; list at $129k implies a 231% gain — meaningful room to come down on a strong offer.
Risks & watch-outs
- Watch-outs: property tax is 2.8% of price; flood insurance adds $66/mo; built in 1907 — expect roof / HVAC / electrical / plumbing capex.
- Climate carrying-cost: major flood risk; major wind risk, 27% chance of damaging wind over 30y; extreme-heat days projected 7→15/yr by 2055 (HVAC capex compounding) — expect insurance premiums to compound above CPI over the hold.
Questions for the listing agent
- Built in 1907 — when were the roof, HVAC, electrical panel, plumbing, and water heater last replaced?
- Property tax is high relative to price — has the assessment been appealed recently, and will the sale trigger a re-assessment?
- What's the actual annual flood-insurance premium (NFIP or private), and is the property in a SFHA with mandatory coverage?
- Is there a deadline driving the sale (1031 exchange, divorce, estate, relocation)? That informs how much negotiation room exists.
- Schools are F-rated, which usually means shorter tenancies and higher turnover. Who's the typical renter profile here, and what's been the actual vacancy rate?
- Crime grade is F in this area — have there been break-ins, vandalism, or insurance claims at this property in the last 3 years? What carrier currently insures it and at what premium?
- What's the average days-on-market for RENTAL listings here right now (not sales)? A rising rental-DOM trend means longer vacancies and softer asking-rent achievability than the comps imply.
- What's the recent tenant-quality profile in this submarket — average credit score on applications, eviction rate, late-payment / NSF rate, and stable-employment percentage? A property-management company in the area should have these aggregated.
- How much new for-sale + rental construction is in the pipeline within 1–3 miles? Heavy new supply typically softens prices + rents 12–24 months out; constrained supply supports both.
Investment metrics
- 1% rule
- 2.05% ✓
- Cap rate
- 16.13%
- Cash-on-cash
- 35.15%
- DSCR
- 2.56
- GRM
- 4.1
CMA / ARV
- ARV (on-the-fly)
- $349,622
- Comps found
- 4
Show comp detail 4 sales within ~0.75 mi
| Address | Dist | Beds/Ba | Sqft | Sold | Price | $/sf | Match |
|---|---|---|---|---|---|---|---|
| 466 Stuyvesant Ave | 0.49mi | 4/2.0 | 1,525 (-4%) | 10mo | $300,000 | $197 | 61 |
| 840 Parkside Ave | 0.74mi | 3/2.5 (-1) | 1,500 (-5%) | 2mo | $400,000 | $267 | 46 |
| 825 Stuyvesant Ave | 0.55mi | 4/2.0 | 1,480 (-6%) | 23mo | $260,000 | $176 | 42 |
| 31 N Lenape Ave | 0.73mi | 3/1.0 (-1) | 1,364 (-14%) | 7mo | $301,050 | $221 | 30 |
Match score weights: distance 35% · size 25% · config 20% · recency 20%. Top-matched comps best support the ARV.
Projected returns pro-forma
-3.0% appreciation · 2.6% rent growth · sell at horizon
- IRR
- 27.7%
- Equity multiple
- 2.14×
- Total profit
- $41,348
- Equity at exit
- $19,234
- IRR
- 34.9%
- Equity multiple
- 4.15×
- Total profit
- $113,676
- Equity at exit
- $11,154
Cash invested: $36,120 (down + closing). Projections, not guarantees.
Landlord ↔ Tenant lean methodology
- Overall (STATE)
- 21 Tenant-Leaning
- State New Jersey
- 21 Tenant-Leaning · D+6
- County
- — inherits STATE
- City
- — inherits STATE
ZIP-level market 08618
- Rents YoY
- 2.6%
- Active inventory
- 144
- Price-to-rent
- 4.1×
Monthly cashflow live
- Estimated rent
- $2,644 high interval (Pro) →
- Mortgage (P&I)
- −$676
- Tax from tax record
- −$301 /mo · $3,611/yr
- Insurance
- −$54
- Flood insurance flood zone
- −$66 /mo · $798/yr
- HOA
- −$0
- Vacancy / Maint / Mgmt
- −$555
- Net cashflow
- $991
Break-even live
UW: 25.0% down · 7.5% · 30yr · 1.5% tax · 5.0% vac · 8.0% maint · 8.0% mgmt
Financing live
Cash to close
- Down payment
- $32,250
- Closing costs
- $3,870
- Reserves months
- —
- Total cash needed
- —
Loan-product check · same deal, 3 products live
Conventional
25% down · 7.5% · 30yr
- Down + closing
- —
- Monthly P&I
- —
- Monthly cashflow
- —
- DSCR
- —
- Eligible?
- —
Personal DTI + credit; lowest rate.
DSCR
20% down · 8.5% · 30yr
- Down + closing
- —
- Monthly P&I
- —
- Monthly cashflow
- —
- DSCR
- —
- Eligible?
- —
No personal income docs; deal must DSCR.
Hard money
10% down · 12.0% · 12mo
- Down + closing
- —
- Monthly P&I
- —
- Monthly cashflow
- —
- DSCR
- —
- Eligible?
- —
Short-term bridge; refi at stabilization.
Rent comps 22 comps
| Address | Beds | Baths | Sqft | Rent | $/sqft | DOM | Units | Dist |
|---|---|---|---|---|---|---|---|---|
| 649 W State St Trenton, NJ | 5.0 | 2.0 | 1870 | $2,900 | $1.55 | 12d | 1 | 0.14mi |
| 600 Artisan St Trenton, NJ | 3.0 | 2.0 | 1392 | $2,650 | $1.90 | 12d | 3 | 0.25mi |
| 600 Artisan St Unit 126 Trenton, NJ | 3.0 | 2.0 | 1392 | $2,650 | $1.90 | 20d | 1 | 0.25mi |
| 20 N Overbrook Ave Unit B Trenton, NJ | 3.0 | 1.0 | 1518 | $2,300 | $1.52 | 12d | 1 | 0.26mi |
| 311 Spring St Trenton, NJ | 3.0 | 1.0 | 1200 | $2,200 | $1.83 | 13d | 1 | 0.36mi |
| 510 W Hanover St Trenton, NJ | 5.0 | 1.0 | 1200 | $2,200 | $1.83 | 13d | 1 | 0.36mi |
| 186 Passaic St Trenton, NJ | 3.0 | 2.0 | 1064 | $2,400 | $2.26 | 4d | 1 | 0.39mi |
| 510 N Hermitage Ave Trenton, NJ | 5.0 | 1.5 | 1316 | $2,500 | $1.90 | 12d | 1 | 0.48mi |
| 319 Rutherford Ave Trenton, NJ | 4.0 | 2.0 | 1100 | $2,200 | $2.00 | 21d | 1 | 0.49mi |
| 311 Calhoun St Trenton, NJ | 4.0 | 1.0 | 1516 | $2,400 | $1.58 | 43d | 1 | 0.57mi |
| 73 Bellevue Ave Trenton, NJ | 4.0 | 2.0 | 1950 | $2,400 | $1.23 | 13d | 1 | 0.69mi |
| 21 Bellevue Ave Trenton, NJ | 3.0 | 2.0 | 1740 | $2,400 | $1.38 | 43d | 1 | 0.78mi |
| 73 Oak Ln #2 Trenton, NJ | 4.0 | 1.0 | 1886 | $2,300 | $1.22 | 13d | 1 | 0.81mi |
| 34 E Hendrickson Ave Morrisville, PA | 3.0 | 1.0 | 1360 | $2,650 | $1.95 | 43d | 1 | 0.87mi |
| 1442 W State St Trenton, NJ | 5.0 | 2.5 | 1956 | $3,000 | $1.53 | 12d | 1 | 0.98mi |
| 24 New Trent St Trenton, NJ | 3.0 | 2.0 | 1336 | $2,350 | $1.76 | 13d | 1 | 1.05mi |
| 130 W Ingham Ave Trenton, NJ | 4.0 | 1.0 | 1126 | $2,000 | $1.78 | 13d | 1 | 1.09mi |
| 117 Park Ave Morrisville, PA | 3.0 | 2.0 | 1396 | $3,200 | $2.29 | 12d | 1 | 1.12mi |
| 1100 Prospect St Unit 1 Ewing Township, NJ | 3.0 | 1.0 | 1100 | $2,000 | $1.82 | 21d | 1 | 1.13mi |
| 129 Clearfield Ave Trenton, NJ | 4.0 | 1.5 | 1358 | $3,000 | $2.21 | 12d | 1 | 1.18mi |
| 134 Old Rose St Trenton, NJ | 4.0 | 2.0 | 1212 | $2,300 | $1.90 | 21d | 1 | 1.20mi |
| 130 Harper Ave Morrisville, PA | 3.0 | 2.5 | 1276 | $3,500 | $2.74 | 12d | 1 | 1.27mi |
Listing history 4 events
-
2023-07-25status Pending
-
2023-07-01$129,000 Active
-
1994-12-30soldstatus $39,000
-
1991-06-10soldstatus $20,000
ⓘ Source: listings_history table (triggers on properties + properties_extension) + one-shot
backfill from property_details.listing_events for pre-trigger history.
Tax reassessment forecast NJ · Partial reset (capped growth)
- Current annual tax
- $3,611 · $301/mo
- Projected year-2 tax
- $3,611 · $301/mo
- Expected delta
- $0/yr ($0/mo · 0.0%)
ⓘ Screening estimate from a state-policy table — verify with the county assessor before closing.
Climate risk First Street
- Flood 7/10 Severe FEMA zone X (unshaded) · 76% chance over 30 yrs
- Wildfire 3/10 Moderate
- Heat 7/10 Severe 7 d/yr ≥103°F today · 15 d/yr by 30 yrs out
- Wind 6/10 Major 27% chance of damaging wind over 30 yrs
- Air quality 5/10 Major 6 unhealthy d/yr today · 8 by 30 yrs out
Nearby sold comps map
Loading sold comps map…
Walkable amenities ~0.75 mi
Loading nearby amenities…
Taxation est. · year 1
- Rental income
- $31,732
- − Mortgage interest
- −$7,226
- − Property taxes
- −$3,611
- − Insurance
- −$1,442
- − Repairs & maintenance
- −$2,539
- − Management
- −$2,539
- − Depreciation
- −$3,753
- Taxable income
- $10,623
- Est. tax owed @ 24.0%
- −$2,550
- After-tax cash flow
- $9,348/yr
For passive investors: Depreciation is non-cash, so a rental often shows a tax loss while cash-flowing — sheltering income. Rental losses are passive: they offset passive income freely, and up to $25,000/yr can offset ordinary (W-2) income if you actively participate and your MAGI is under $100k (phasing out to $0 by $150k); unused losses carry forward. On sale, claimed depreciation is recaptured at up to 25%, and gains may owe capital-gains tax (a 1031 exchange can defer both). Figures are a year-1 estimate at your 24.0% rate — not tax advice; consult a CPA.
Schools (NCES district)
- District
- Trenton Public School District
- NCES district ID
- 3416290
- Math proficiency
- 2% ▼ -8.00%
- Reading proficiency
- 16% ▼ -4.00%
- Median HH income
- $35,078
- Composite
- 7.31/100
- National rank
- #9956
- State rank
- #471 of 472 in NJ
Livability — Trenton
- Score
- 76/100
- State rank
- #133
- US rank
- #3533
Category grades
Schools grade is shown separately in the Schools card above.
Census & demographics
- Census place
- Trenton, NJ
- County
- Mercer County · 327,655 people
- City population
- 177,819
- Metro
- Trenton-Princeton, NJ
- Population (ZIP)
- 35,634
- Household income
- $50,390
- Rent vs Own
- Severe rent burden
- 2116.0
Population outlook (Mercer County) Hauer SSP2
- Today (2025)
- 381,395 people
- By 2030
- 384,640 · +0.9%
- By 2040
- 391,431 · +2.6%
- By 2050
- 397,845 · +4.3%
- By 2075
- 417,281 · +9.4%
- By 2100
- 420,327 · +10.2%
Race, ethnicity, and origin ACS 2023
- Neighborhood character
- Diverse neighborhood (Simpson 0.59)
- Race & ethnicity
- Black 59% White 19% Hispanic / Latino 16% Two or more races 7% Asian 3%
- Hispanic origin (detail)
- Mexican 1% Puerto Rican 6% Dominican 3%
- Common ancestry
- Romanian 2% Hispanic 1% Scotch-Irish 1%
- Foreign-born
- 14% · Canada, China, South Korea
- Languages at home
- 80% English-only · Spanish 10% Other Indo-European 3% Arabic 1%
Political lean MEDSL · Mercer
- 2024 margin
- Solid D (+33.9) · D 65.9% · R 32.0% · Other 2.1%
- 2008→2024 swing
- -2.2pp toward R · 2008: 36.1pp · 2024: 33.9pp
- All cycles
- 2024: D+33.9 2020: D+40.0 2016: D+36.2 2012: D+36.8 2008: D+36.1
Not yet ingested
- Civics
- —
Market trends
- HPI YoY
- ▼ -309.54%
- Current HPI
- 288.6841
- Rent YoY
- ▲ 2.60%
- Metro
- Trenton-Princeton, NJ
- State GDP YoY
- ▲ 2.05%
- F500 in state
- 34
Industry mix (Fortune 500 HQ in NJ)
| Industry | F500 HQs | Revenue |
|---|---|---|
| Consumer Goods | 3 | $31B |
|
||
| Pharmaceuticals | 2 | $153B |
|
||
| Technology | 2 | $21B |
|
||
| Insurance | 2 | $20B |
|
||
| Healthcare | 2 | $19B |
|
||
| Financial Services | 1 | $70B |
|
||
Price history
+545.0% since first listed4 events — show timeline
- 2023-07-25 Pending — BRIGHT MLS
- 2023-07-01 Listed $129,000 BRIGHT MLS
- 1994-12-30 Sold (Public Records) $39,000 Public Records
- 1991-06-10 Sold (Public Records) $20,000 Public Records
Property tax history
+2.5%/yrLatest (2025): $3,611 · +1.5% YoY. Source: county tax records.
Cash-flow waterfall
monthlySold comps — $/sqft
last 12 mo · ≤1 miLoading sold comps…