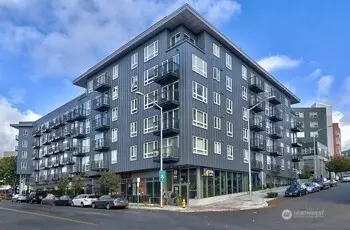
3104 Western Ave #522 · Seattle, WA
Flood risk 1/10 · Minimal
- FEMA flood zone
- X (unshaded)
- Chance of flooding over 30 yrs
- 0.0%
- Est. flood insurance / yr
- $507 – $1,088
Fire risk 1/10 · Minimal
- Est. fire insurance / yr
- $604 – $1,122
Heat risk 3/10 · Minor
- Hot days now (above 86°F)
- 7 days/yr
- Hot days in 30 yrs
- 15 days/yr
Wind risk 1/10 · Minimal
- Chance of severe wind over 30 yrs
- —
Air-quality risk 7/10 · Major
- Unhealthy air days now
- 11 days/yr
- Unhealthy air days in 30 yrs
- 12 days/yr
Risk factors via First Street. Map © Google.
Why this score? — see what drove the D- grade
The composite is a weighted blend of 9 inputs, each scored 0–100. Each bar is that input's sub-score; the figure is the points it added to the 100-point composite (weight × sub-score).
- ARV discount +14.2/15.0
- Schools +6.1/10.0
- Appreciation +4.6/10.0
- Cash flow +4.1/30.0
- Livability +3.8/5.0
- Rent growth +2.5/5.0
- Condition / age +2.5/5.0
- 1% rule +1.5/10.0
- DSCR +0.0/10.0
$309,995
🖨 Deal sheet 📄 Offer letter ✓ Due diligence
Listing remarks
Enjoy refined city living in this beautifully designed 5th-floor 1-bedroom, 1-bath residence. This condo offers a seamless blend of modern style and functionality, featuring a sleek kitchen with quartz countertops, stainless steel appliances, a breakfast bar, and hardwood floors. The open layout flows freely with frosted sliding panels for an open or closed private bedroom, an in-unit washer and dryer, and air conditioning. Also includes a storage unit. Residents enjoy premium amenities including a welcoming lobby with concierge service, secure parking with elevator access, and an impressive rooftop deck complete with BBQs, landscaped spaces, and views of Elliott Bay and the Space Need
Key facts
- Air conditioning
- Breakfast bar
- Hardwood floors
Tags
Neighborhood map
What this means for you Summary
Snapshot
- This is a 1-bed/1.0-bath condo listed at $310k.
Deal economics
- At list price, monthly cash flow is $-860 ($-10k/yr) — negative.
- To cash-flow at today's rent, offer at most $158k (49.0% below list).
- To meet the 1% rule (rent ≥ 1% of price), the offer needs to be $202k (34.9% below list).
- Recommended offer: $158k (49.0% below list) — sets the bar for cash-flow.
- Cap rate 3.0% vs local median 1.6% in Seattle — top-decile yield for the area; either an underpriced asset or a hidden risk that comps aren't pricing in. Stress-test before assuming the spread holds.
Location & tenants
- Location reads 75/100 on livability (#166 in WA, #4,033 nationally) — a middle-class / working-renter tenant base. Strengths: amenities A+, commute A+, employment A+; Watch: crime F, cost of living F.
- Seattle Public Schools (urban): math 64% / reading 72% proficiency, ranked #19 of 291 in WA (top 6%) — acceptable for families but not a draw, mixed tenant base, ~2y average lease.
- Market conditions: Rents flat; 229 active listings in the ZIP; 40 comparable units currently listed for rent nearby; rentals leasing fast (median 1d on market — plan ~1-2 weeks tenant-placement turnaround); high-income renter base; 10,555 units permitted in King County in 2024 (7,119 in 5+ unit buildings).
- This rent is only 16% of the median local income ($152k/yr) — well below the 30% rent-burden line; pricing power to push rent on renewal without tenant pushback.
Forward outlook
- Local home prices are declining (-0.8%/yr); year-one equity from $2k of loan paydown is wiped out by about $3k of value loss. Plan a longer hold.
- King County population projected at +44% by 2050 — long-run rental-demand tailwind backs the buy-and-hold thesis.
Negotiation context
- It's been on market 66 days — a 6% lower offer ($291k) is reasonable based on typical stale-listing flexibility.
- 2 sale attempts since 18y ago with the ask held roughly flat each time — persistent listings suggest the price (not the market) is what's stuck; bring a comps-based counter.
- Current owner paid $250k; 24% above their basis — modest negotiation headroom, anchor on the comps not their cost.
Risks & watch-outs
- Watch-outs: HOA is 23% of rent.
Questions for the listing agent
- What do current leases actually rent for vs. the listed asking? Can we see a recent rent roll and the last 12 months of T-12 income?
- It's been on market 66 days. Have you received any prior offers? Is the seller open to a 49% concession, seller financing, or rate buy-down credit?
- What does the HOA fee cover, when was the last increase, and are there any pending special assessments or reserve-fund shortfalls?
- Any open or pending special assessments — roof, HVAC, plumbing, elevator, façade? What's the per-unit balance and payoff schedule, and is the seller paying it off at close or rolling it to the buyer?
- Why hasn't it sold? Are there any deal-killer items the seller is aware of (foundation, flood, title, zoning, code violations)?
- Is there a deadline driving the sale (1031 exchange, divorce, estate, relocation)? That informs how much negotiation room exists.
- Schools are A-rated — typically a magnet for longer-tenancy family renters. What's the average tenant stay here, and is there a school-zone premium baked into asking?
- Crime grade is F in this area — have there been break-ins, vandalism, or insurance claims at this property in the last 3 years? What carrier currently insures it and at what premium?
- The area grade is low — what's the realistic commute time and amenity access for the typical tenant pool here? Any planned neighborhood developments (good or bad) we should know about?
- What's the average days-on-market for RENTAL listings here right now (not sales)? A rising rental-DOM trend means longer vacancies and softer asking-rent achievability than the comps imply.
- What's the recent tenant-quality profile in this submarket — average credit score on applications, eviction rate, late-payment / NSF rate, and stable-employment percentage? A property-management company in the area should have these aggregated.
- How much new apartment / multifamily construction is in the pipeline within 1–3 miles? Heavy new supply (>2% of stock underway) typically softens rents 12–24 months out; light construction supports rent growth.
Investment metrics
- 1% rule
- 0.65% ✗
- Cap rate
- 2.96%
- Cash-on-cash
- -11.89%
- DSCR
- 0.47
- GRM
- 12.8
CMA / ARV
- ARV (median comp)
- $364,478
- List price
- $309,995
- Delta
- -14.95%
- Verdict
- UNDERPRICED
- Comps
- 20 within 1.0 mi
Projected returns pro-forma
-0.81% appreciation · 0.05% rent growth · sell at horizon
- IRR
- -22.3%
- Equity multiple
- 0.07×
- Total profit
- $-81,096
- Equity at exit
- $77,606
- IRR
- -18.6%
- Equity multiple
- -0.55×
- Total profit
- $-134,790
- Equity at exit
- $83,882
Cash invested: $86,799 (down + closing). Projections, not guarantees.
Landlord ↔ Tenant lean methodology
- Overall (CITY)
- 0 Strongly Tenant-Friendly
- State Washington
- 28 Tenant-Leaning · D+8
- County
- — inherits STATE
- City Seattle
- 0 Strongly Tenant-Friendly · D+52
ZIP-level market 98121
- Home prices YoY
- -0.5%
- Rents YoY
- 0.1%
- Active inventory
- 229
- Price-to-rent
- 12.8×
Monthly cashflow live
- Estimated rent
- $2,020 high interval (Pro) →
- Mortgage (P&I)
- −$1,626
- Tax from tax record
- −$245 /mo · $2,946/yr
- Insurance
- −$129
- HOA
- −$455
- Vacancy / Maint / Mgmt
- −$424
- Net cashflow
- $-860
Break-even live
UW: 25.0% down · 7.5% · 30yr · 1.5% tax · 5.0% vac · 8.0% maint · 8.0% mgmt
Financing live
Cash to close
- Down payment
- $77,499
- Closing costs
- $9,300
- Reserves months
- —
- Total cash needed
- —
Loan-product check · same deal, 3 products live
Conventional
25% down · 7.5% · 30yr
- Down + closing
- —
- Monthly P&I
- —
- Monthly cashflow
- —
- DSCR
- —
- Eligible?
- —
Personal DTI + credit; lowest rate.
DSCR
20% down · 8.5% · 30yr
- Down + closing
- —
- Monthly P&I
- —
- Monthly cashflow
- —
- DSCR
- —
- Eligible?
- —
No personal income docs; deal must DSCR.
Hard money
10% down · 12.0% · 12mo
- Down + closing
- —
- Monthly P&I
- —
- Monthly cashflow
- —
- DSCR
- —
- Eligible?
- —
Short-term bridge; refi at stabilization.
Rent comps 40 comps
| Address | Beds | Baths | Sqft | Rent | $/sqft | DOM | Units | Dist |
|---|---|---|---|---|---|---|---|---|
| 3104 Western Ave #213 Seattle, WA | 1.0 | 1.0 | 506 | $2,000 | $3.95 | 18d | 1 | 0.01mi |
| 107 1st Ave N Seattle, WA | — | 1.0 | 450 | $1,375 | $3.06 | 1d | 1 | 0.05mi |
| 3028 1st Ave Seattle, WA | — | 1.0 | 308 | $1,110 | $3.60 | 1d | 3 | 0.07mi |
| 3028 1st Ave Seattle, WA | — | 1.0 | 794 | $1,402 | $1.77 | 43d | 5 | 0.07mi |
| 3016 1st Ave Seattle, WA | — | 1.0 | 387 | $1,449 | $3.74 | 1d | 3 | 0.08mi |
| 100 Denny Way Seattle, WA | 2.0 | 1.0–2.0 | 911 | $3,159 | $3.47 | 1d | 8 | 0.09mi |
| 105 Warren Ave N Seattle, WA | 1.0–2.0 | 1.0–2.0 | 767 | $1,809 | $2.36 | 1d | 5 | 0.09mi |
| 115 Warren Ave N Seattle, WA | 1.0 | 1.0 | 705 | $2,049 | $2.90 | 1d | 5 | 0.11mi |
| 159 Denny Way Seattle, WA | 1.0 | 1.0–1.5 | 696 | $2,900 | $4.16 | 1d | 3 | 0.11mi |
| 109 John St Seattle, WA | 1.0 | 1.0 | 532 | $1,795 | $3.37 | 1d | 4 | 0.12mi |
| 101 John St Seattle, WA | 1.0–2.0 | 1.0–2.0 | 845 | $1,650 | $1.95 | 1d | 4 | 0.12mi |
| 2929 1st Ave #721 Seattle, WA | — | 1.0 | 438 | $1,600 | $3.65 | 1d | 1 | 0.12mi |
| 2922 Western Ave Seattle, WA | 2.0 | 1.0–2.0 | 684 | $2,118 | $3.10 | 1d | 12 | 0.14mi |
| 2933 2nd Ave Seattle, WA | — | 1.0 | 429 | $1,375 | $3.21 | 1d | 3 | 0.14mi |
| 151 John St Seattle, WA | 1.0 | 1.0 | 608 | $1,995 | $3.28 | 1d | 2 | 0.15mi |
| 215 Queen Anne Ave N Seattle, WA | 1.0 | 1.0 | 389 | $1,745 | $4.48 | 1d | 4 | 0.16mi |
| 222 Queen Anne Ave N Seattle, WA | 1.0–2.0 | 1.0–2.0 | 781 | $1,899 | $2.43 | 1d | 2 | 0.17mi |
| 2900 1st Ave Seattle, WA | 1.0–2.0 | 1.0 | 732 | $2,629 | $3.59 | 1d | 3 | 0.17mi |
| 219 1st Ave N Seattle, WA | 1.0 | 1.0 | 452 | $1,750 | $3.87 | 1d | 2 | 0.17mi |
| 2911 2nd Ave Seattle, WA | 1.0 | 1.0 | 603 | $1,795 | $2.98 | 1d | 1 | 0.17mi |
| 229 1st Ave N Apt 200 Seattle, WA | — | 1.0 | 400 | $1,295 | $3.24 | 1d | 1 | 0.18mi |
| 215 1st Ave W Seattle, WA | 2.0 | 1.0–2.0 | 625 | $2,260 | $3.62 | 1d | 7 | 0.19mi |
| 200 2nd Ave W Seattle, WA | — | 1.0 | 509 | $1,795 | $3.53 | 1d | 3 | 0.20mi |
| 19 W Thomas St Seattle, WA | 1.0 | 1.0 | 625 | $1,595 | $2.55 | 1d | 2 | 0.21mi |
| 2801 1st Ave Seattle, WA | 1.0 | 1.0 | 719 | $2,500 | $3.48 | 1d | 1 | 0.22mi |
| 2801 1st Ave Seattle, WA | 1.0 | 1.0 | 721 | $2,500 | $3.47 | 17d | 1 | 0.22mi |
| 2800 Western Ave Seattle, WA | 2.0 | 1.0–2.0 | 869 | $2,629 | $3.02 | 1d | 6 | 0.22mi |
| 2801 Western Ave Seattle, WA | 3.0 | 1.0–2.0 | 1409 | $2,753 | $1.95 | 1d | 22 | 0.23mi |
| 306 Queen Anne Ave N Seattle, WA | 1.0 | 1.0 | 659 | $2,650 | $4.02 | 1d | 1 | 0.23mi |
| 307 Queen Anne Ave N Seattle, WA | 1.0 | 1.0 | 660 | $1,425 | $2.16 | 1d | 1 | 0.23mi |
| 10 Clay St Seattle, WA | 1.0 | 1.0 | 625 | $2,895 | $4.63 | 1d | 2 | 0.23mi |
| 10 Clay St Seattle, WA | 2.0 | 1.0–2.0 | 830 | $1,975 | $2.38 | 13d | 1 | 0.23mi |
| 300 1st Ave W Seattle, WA | 3.0 | 1.0–2.0 | 916 | $2,824 | $3.08 | 1d | 10 | 0.24mi |
| 81 Clay St Unit 774 Seattle, WA | — | 1.0 | 486 | $2,130 | $4.38 | 19d | 1 | 0.24mi |
| 81 Clay St #526 Seattle, WA | 1.0 | 1.0 | 652 | $2,150 | $3.30 | 1d | 1 | 0.24mi |
| 2721 1st Ave Seattle, WA | 1.0 | 1.0 | 617 | $2,022 | $3.28 | 43d | 3 | 0.24mi |
| 315 1st Ave N Seattle, WA | 1.0 | 1.0 | 571 | $2,428 | $4.25 | 1d | 11 | 0.24mi |
| 2716 Elliott Ave Seattle, WA | — | 1.0 | 500 | $1,625 | $3.25 | 1d | 1 | 0.25mi |
| 320 Queen Anne Ave N Seattle, WA | 1.0 | 1.0–2.0 | 576 | $2,940 | $5.10 | 1d | 5 | 0.25mi |
| 2721 1st Ave Seattle, WA | 1.0 | 1.0 | 657 | $2,150 | $3.27 | 1d | 1 | 0.25mi |
HOA detail condo
- Monthly dues
- $455 · $5,460/yr
- Likely covers
- doorman
- Assessments
- None detected in remarks — confirm with the listing agent.
Listing history 24 events
-
2026-06-19days on market $309,995 Active 66 DOM
-
2026-06-18days on market $309,995 Active 65 DOM
-
2026-06-17days on market $309,995 Active 64 DOM
-
2026-06-16days on market $309,995 Active 63 DOM
-
2026-06-15days on market $309,995 Active 62 DOM
-
2026-06-15days on market $309,995 Active 61 DOM
-
2026-06-13days on market $309,995 Active 60 DOM
-
2026-06-12days on market $309,995 Active 59 DOM
-
2026-06-10days on market $309,995 Active 57 DOM
-
2026-06-09days on market $309,995 Active 56 DOM
-
2026-06-08days on market $309,995 Active 55 DOM
-
2026-06-07days on market $309,995 Active 54 DOM
-
2026-06-07days on market $309,995 Active 53 DOM
-
2026-06-04days on market $309,995 Active 51 DOM
-
2026-06-03days on market $309,995 Active 50 DOM
-
2026-06-02days on market $309,995 Active 49 DOM
-
2026-06-01days on market $309,995 Active 48 DOM
-
2026-05-31days on market $309,995 Active 47 DOM
-
2026-05-09price $309,995
-
2026-04-14$324,995 Active
-
2008-07-09soldstatus $249,950 Sold
-
2008-07-09soldstatus $249,950
-
2008-05-20historical
-
2008-05-16$249,950
ⓘ Source: listings_history table (triggers on properties + properties_extension) + one-shot
backfill from property_details.listing_events for pre-trigger history.
Tax reassessment forecast WA · Resets to sale price
- Current annual tax
- $2,946 · $245/mo
- Projected year-2 tax
- $3,038 · $253/mo
- Expected delta
- +$92/yr (+$8/mo · 3.1%)
ⓘ Screening estimate from a state-policy table — verify with the county assessor before closing.
Climate risk First Street
- Flood 1/10 Low FEMA zone X (unshaded) · 0% chance over 30 yrs
- Wildfire 1/10 Low
- Heat 3/10 Moderate 7 d/yr ≥86°F today · 15 d/yr by 30 yrs out
- Wind 1/10 Low
- Air quality 7/10 Severe 11 unhealthy d/yr today · 12 by 30 yrs out
Nearby sold comps map
Loading sold comps map…
Walkable amenities ~0.75 mi
Loading nearby amenities…
Taxation est. · year 1
- Rental income
- $24,234
- − Mortgage interest
- −$17,365
- − Property taxes
- −$2,946
- − Insurance
- −$1,550
- − Repairs & maintenance
- −$1,939
- − Management
- −$1,939
- − HOA
- −$5,460
- − Depreciation
- −$9,018
- Taxable loss
- −$15,981
- Est. tax savings @ 24.0%
- +$3,836
- After-tax cash flow
- $-6,483/yr
For passive investors: Depreciation is non-cash, so a rental often shows a tax loss while cash-flowing — sheltering income. Rental losses are passive: they offset passive income freely, and up to $25,000/yr can offset ordinary (W-2) income if you actively participate and your MAGI is under $100k (phasing out to $0 by $150k); unused losses carry forward. On sale, claimed depreciation is recaptured at up to 25%, and gains may owe capital-gains tax (a 1031 exchange can defer both). Figures are a year-1 estimate at your 24.0% rate — not tax advice; consult a CPA.
Schools (NCES district)
- District
- Seattle Public Schools
- NCES district ID
- 5307710
- Math proficiency
- 64% ▼ -1.00%
- Reading proficiency
- 72% ▬ 0.00%
- Median HH income
- $68,695
- Composite
- 60.76/100
- National rank
- #1649
- State rank
- #19 of 291 in WA
Livability — Seattle
- Score
- 75/100
- State rank
- #166
- US rank
- #4033
Category grades
Schools grade is shown separately in the Schools card above.
Census & demographics
- Census place
- Seattle, WA
- County
- King County · 2,251,916 people
- City population
- 706,262
- Metro
- Seattle-Tacoma-Bellevue, WA
- Population (ZIP)
- 21,166
- Household income
- $152,019
- Rent vs Own
- Severe rent burden
- 1835.0
Population outlook (King County) Hauer SSP2
- Today (2025)
- 2,576,485 people
- By 2030
- 2,803,316 · +8.8%
- By 2040
- 3,255,921 · +26.4%
- By 2050
- 3,706,444 · +43.9%
- By 2075
- 4,746,063 · +84.2%
- By 2100
- 5,407,730 · +109.9%
Race, ethnicity, and origin ACS 2023
- Neighborhood character
- Diverse neighborhood (Simpson 0.65)
- Race & ethnicity
- White 47% Asian 34% Two or more races 9% Hispanic / Latino 8% Black 3%
- Hispanic origin (detail)
- Mexican 6%
- Common ancestry
- Portuguese 3% Italian 3% Slovak 2%
- Foreign-born
- 40% · China, Canada, South Korea
- Languages at home
- 59% English-only · Other Indo-European 13% Chinese 10% Spanish 5%
Political lean MEDSL · King
- 2024 margin
- Solid D (+51.7) · D 74.2% · R 22.5% · Other 3.4%
- 2008→2024 swing
- +9.6pp toward D · 2008: 42.1pp · 2024: 51.7pp
- All cycles
- 2024: D+51.7 2020: D+52.7 2016: D+50.4 2012: D+39.9 2008: D+42.1
Not yet ingested
- Civics
- —
Market trends
- HPI YoY
- ▼ -0.81%
- Current HPI
- 165.0124
- Rent YoY
- ▬ 0.05%
- Metro
- Seattle-Tacoma-Bellevue, WA
- State GDP YoY
- ▲ 4.65%
- F500 in state
- 22
Industry mix (Fortune 500 HQ in WA)
| Industry | F500 HQs | Revenue |
|---|---|---|
| Retail | 2 | $269B |
|
||
| Technology / Retail | 1 | $638B |
|
||
| Technology | 1 | $245B |
|
||
| Telecommunications | 1 | $38B |
|
||
| Food / Beverage | 1 | $36B |
|
||
| Automotive / Trucks | 1 | $34B |
|
||
Price history
+24.0% since first listed6 events — show timeline
- 2026-05-09 Price Changed $309,995 NWMLS as Distributed by MLS Grid
- 2026-04-14 Listed $324,995 NWMLS as Distributed by MLS Grid
- 2008-07-09 Sold (Public Records) $249,950 Public Records
- 2008-07-09 Sold (MLS) $249,950 NWMLS as Distributed by MLS Grid
- 2008-05-20 Delisted — NWMLS as Distributed by MLS Grid
- 2008-05-16 Listed $249,950 NWMLS as Distributed by MLS Grid
Property tax history
+2.7%/yrLatest (2025): $2,946 · -11.6% YoY. Source: county tax records.
Cash-flow waterfall
monthlySold comps — $/sqft
last 12 mo · ≤1 miLoading sold comps…