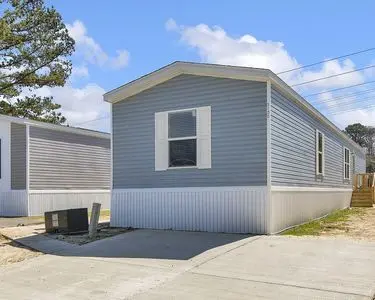
3156 Korea Cir · Hope Mills, NC
Flood risk 4/10 · Minor
- FEMA flood zone
- X (unshaded)
- Chance of flooding over 30 yrs
- 0.24%
- Est. flood insurance / yr
- $507 – $1,088
Fire risk 6/10 · Moderate
- Est. fire insurance / yr
- $906 – $1,684
Heat risk 7/10 · Major
- Hot days now (above 106°F)
- 7 days/yr
- Hot days in 30 yrs
- 16 days/yr
Wind risk 6/10 · Moderate
- Chance of severe wind over 30 yrs
- 74.0%
Air-quality risk 1/10 · Minimal
- Unhealthy air days now
- 0 days/yr
- Unhealthy air days in 30 yrs
- 0 days/yr
Risk factors via First Street. Map © Google.
Why this score? — see what drove the B grade
The composite is a weighted blend of 9 inputs, each scored 0–100. Each bar is that input's sub-score; the figure is the points it added to the 100-point composite (weight × sub-score).
- Cash flow +30.0/30.0
- 1% rule +10.0/10.0
- DSCR +10.0/10.0
- ARV discount +7.5/15.0
- Condition / age +5.0/5.0
- Livability +3.4/5.0
- Schools +3.1/10.0
- Rent growth +2.7/5.0
- Appreciation +0.0/10.0
$68,900
🖨 Deal sheet 📄 Offer letter ✓ Due diligence
Listing remarks
Stop renting and start building equity in this brand new 2026 Cornerstone, built by Clayton. The Cornerstone is designed for everyday life and the moments that matter. From the stylish and functional living space to the spacious primary suite, every detail is chosen to make this home feel like the right one. Three bedrooms and two full bathrooms. This home features an upgraded kitchen with a full island, Samsung stainless steel appliances, and open-concept layout that seamlessly connects to the living room & acirc; & euro; & rdquo; perfect for everyday living and entertaining. The spacious master suite includes a double vanity with two sinks and a walk-in shower for added comfor
Key facts
- Double vanity
- Full island
- Upgraded kitchen
Tags
Property features AI
Exterior
- Home design: Single-family property built in 2026; 1,140 living area
- Construction: Built in 2026
- Exterior features: Located in the South View subdivision
Neighborhood map
What this means for you Summary
Snapshot
- This is a 3-bed/2.0-bath other listed at $69k. Condition is rated excellent.
Deal economics
- At list price, monthly cash flow is $742 ($9k/yr) — positive.
- The deal already cash-flows at list — no discount required.
- Meets the 1% rule at list price ($2k rent vs $69k).
- Recommended offer: $68k (1.5% below list) — sets the bar for market timing.
- Cap rate 19.2% vs local median 4.8% in Hope Mills — top-decile yield for the area; either an underpriced asset or a hidden risk that comps aren't pricing in. Stress-test before assuming the spread holds.
Location & tenants
- Location reads 67/100 on livability (#234 in NC) — a middle-class / working-renter tenant base. Strengths: cost of living A+, housing A+, health & safety B+; Watch: schools D, crime D-, amenities F.
- Cumberland County Schools (urban): math 32% / reading 41% proficiency, ranked #126 of 178 in NC (top 71%) — families likely to look elsewhere, expect single-tenant / working-renter base with shorter leases.
- Market conditions: Rents flat; 401 active listings in the ZIP; 15 comparable units currently listed for rent nearby; rentals leasing fast (median 14d on market — plan ~1-2 weeks tenant-placement turnaround); 1,125 units permitted in Cumberland County in 2024 (104 in 5+ unit buildings).
Forward outlook
- Local home prices are declining (-3.0%/yr); year-one equity from $476 of loan paydown is wiped out by about $2k of value loss. Plan a longer hold.
- At projected returns (-3.0% appreciation + 0.9% rent growth), your $19k cash investment doubles in ~3 years — after that, you're playing with house money.
Negotiation context
- It's been on market 20 days — a 2% lower offer ($68k) is reasonable based on typical stale-listing flexibility.
Risks & watch-outs
- Climate carrying-cost: major wind risk, 74% chance of damaging wind over 30y; major wildfire risk; extreme-heat days projected 7→16/yr by 2055 (HVAC capex compounding) — expect insurance premiums to compound above CPI over the hold.
Questions for the listing agent
- Is there a deadline driving the sale (1031 exchange, divorce, estate, relocation)? That informs how much negotiation room exists.
- Schools are D-rated, which usually means shorter tenancies and higher turnover. Who's the typical renter profile here, and what's been the actual vacancy rate?
- Crime grade is D in this area — have there been break-ins, vandalism, or insurance claims at this property in the last 3 years? What carrier currently insures it and at what premium?
- What's the average days-on-market for RENTAL listings here right now (not sales)? A rising rental-DOM trend means longer vacancies and softer asking-rent achievability than the comps imply.
- What's the recent tenant-quality profile in this submarket — average credit score on applications, eviction rate, late-payment / NSF rate, and stable-employment percentage? A property-management company in the area should have these aggregated.
- How much new for-sale + rental construction is in the pipeline within 1–3 miles? Heavy new supply typically softens prices + rents 12–24 months out; constrained supply supports both.
Investment metrics
- 1% rule
- 2.24% ✓
- Cap rate
- 19.22%
- Cash-on-cash
- 46.17%
- DSCR
- 3.05
- GRM
- 3.7
CMA / ARV
No comps found within radius.
Projected returns pro-forma
-3.0% appreciation · 0.9% rent growth · sell at horizon
- IRR
- 41.0%
- Equity multiple
- 2.71×
- Total profit
- $32,941
- Equity at exit
- $10,273
- IRR
- 46.3%
- Equity multiple
- 5.00×
- Total profit
- $77,094
- Equity at exit
- $5,957
Cash invested: $19,292 (down + closing). Projections, not guarantees.
Landlord ↔ Tenant lean methodology
- Overall (STATE)
- 85 Strongly Landlord-Friendly
- State North Carolina
- 85 Strongly Landlord-Friendly · R+3
- County
- — inherits STATE
- City
- — inherits STATE
ZIP-level market 28306
- Home prices YoY
- -17.7%
- Rents YoY
- 0.9%
- Active inventory
- 401
- Price-to-rent
- 3.7×
Monthly cashflow live
- Estimated rent
- $1,542 high interval (Pro) →
- Mortgage (P&I)
- −$361
- Tax est. 1.5%
- −$86 /mo · $1,034/yr
- Insurance
- −$29
- HOA
- −$0
- Vacancy / Maint / Mgmt
- −$324
- Net cashflow
- $742
Break-even live
UW: 25.0% down · 7.5% · 30yr · 1.5% tax · 5.0% vac · 8.0% maint · 8.0% mgmt
Financing live
Cash to close
- Down payment
- $17,225
- Closing costs
- $2,067
- Reserves months
- —
- Total cash needed
- —
Loan-product check · same deal, 3 products live
Conventional
25% down · 7.5% · 30yr
- Down + closing
- —
- Monthly P&I
- —
- Monthly cashflow
- —
- DSCR
- —
- Eligible?
- —
Personal DTI + credit; lowest rate.
DSCR
20% down · 8.5% · 30yr
- Down + closing
- —
- Monthly P&I
- —
- Monthly cashflow
- —
- DSCR
- —
- Eligible?
- —
No personal income docs; deal must DSCR.
Hard money
10% down · 12.0% · 12mo
- Down + closing
- —
- Monthly P&I
- —
- Monthly cashflow
- —
- DSCR
- —
- Eligible?
- —
Short-term bridge; refi at stabilization.
Rent comps 15 comps
| Address | Beds | Baths | Sqft | Rent | $/sqft | DOM | Units | Dist |
|---|---|---|---|---|---|---|---|---|
| 1514 Aristo Pl Hope Mills, NC | 2.0 | 2.0 | 1000 | $1,050 | $1.05 | 13d | 1 | 0.50mi |
| 3332 Kenmont Ln Unit E Hope Mills, NC | 2.0 | 2.5 | 1100 | $1,150 | $1.05 | 23d | 1 | 0.78mi |
| 3038 Walesby Dr Fayetteville, NC | 3.0 | 2.0 | 1272 | $1,650 | $1.30 | 23d | 1 | 1.02mi |
| 3506 Shipstone Pl Hope Mills, NC | 2.0 | 2.0 | 1280 | $1,380 | $1.08 | 13d | 3 | 1.03mi |
| 5693A Archer Rd Hope Mills, NC | 2.0 | 1.5 | 874 | $1,100 | $1.26 | 13d | 1 | 1.04mi |
| 1055 Winnall LN Hope Mills, NC | 1.0–3.0 | 1.0–2.0 | 1132 | $2,000 | $1.77 | 13d | 20 | 1.04mi |
| 2935 Chillingworth Dr Fayetteville, NC | 3.0 | 2.0 | 1403 | $1,750 | $1.25 | 13d | 1 | 1.08mi |
| 3636 Metric Dr Hope Mills, NC | 3.0 | 1.5 | 1100 | $1,400 | $1.27 | 13d | 1 | 1.17mi |
| 3511 Birchfield Ct Fayetteville, NC | 2.0–3.0 | 2.0 | 1270 | $1,685 | $1.33 | 13d | 5 | 1.23mi |
| 2579 Gotts Ln Fayetteville, NC | 2.0 | 2.0 | 1200 | $1,295 | $1.08 | 21d | 1 | 1.26mi |
| 3916 Middle St Hope Mills, NC | 2.0 | 1.0 | 905 | $1,115 | $1.23 | 13d | 1 | 1.29mi |
| 5532 Robmont Dr Fayetteville, NC | 2.0 | 2.0 | 1301 | $1,800 | $1.38 | 13d | 1 | 1.31mi |
| 2524 Penny Dr Fayetteville, NC | 3.0 | 2.0 | 1330 | $1,400 | $1.05 | 23d | 1 | 1.35mi |
| 5715 Walkabout Rd Hope Mills, NC | 3.0 | 2.0 | 1143 | $1,675 | $1.47 | 23d | 1 | 1.47mi |
| 3462 Marty Cir Hope Mills, NC | 3.0 | 2.0 | 1120 | $1,250 | $1.12 | 23d | 1 | 1.47mi |
Listing history 16 events
-
2026-06-18days on market $68,900 Active 20 DOM
-
2026-06-17days on market $68,900 Active 19 DOM
-
2026-06-16days on market $68,900 Active 18 DOM
-
2026-06-15days on market $68,900 Active 17 DOM
-
2026-06-14days on market $68,900 Active 15 DOM
-
2026-06-13days on market $68,900 Active 14 DOM
-
2026-06-10days on market $68,900 Active 12 DOM
-
2026-06-09days on market $68,900 Active 11 DOM
-
2026-06-08days on market $68,900 Active 10 DOM
-
2026-06-07days on market $68,900 Active 9 DOM
-
2026-06-03days on market $68,900 Active 5 DOM
-
2026-06-02days on market $68,900 Active 4 DOM
-
2026-06-01days on market $68,900 Active 3 DOM
-
2026-05-31days on market $68,900 Active 2 DOM
-
2026-05-30remarks 687-char remark
-
2026-05-30$68,900 Active 1 DOM
ⓘ Source: listings_history table (triggers on properties + properties_extension) + one-shot
backfill from property_details.listing_events for pre-trigger history.
Climate risk First Street
- Flood 4/10 Moderate FEMA zone X (unshaded) · 24% chance over 30 yrs
- Wildfire 6/10 Major
- Heat 7/10 Severe 7 d/yr ≥106°F today · 16 d/yr by 30 yrs out
- Wind 6/10 Major 74% chance of damaging wind over 30 yrs
- Air quality 1/10 Low 0 unhealthy d/yr today · 0 by 30 yrs out
Nearby sold comps map
Loading sold comps map…
Walkable amenities ~0.75 mi
Loading nearby amenities…
Taxation est. · year 1
- Rental income
- $18,507
- − Mortgage interest
- −$3,859
- − Property taxes
- −$1,034
- − Insurance
- −$344
- − Repairs & maintenance
- −$1,481
- − Management
- −$1,481
- − Depreciation
- −$2,004
- Taxable income
- $8,304
- Est. tax owed @ 24.0%
- −$1,993
- After-tax cash flow
- $6,914/yr
For passive investors: Depreciation is non-cash, so a rental often shows a tax loss while cash-flowing — sheltering income. Rental losses are passive: they offset passive income freely, and up to $25,000/yr can offset ordinary (W-2) income if you actively participate and your MAGI is under $100k (phasing out to $0 by $150k); unused losses carry forward. On sale, claimed depreciation is recaptured at up to 25%, and gains may owe capital-gains tax (a 1031 exchange can defer both). Figures are a year-1 estimate at your 24.0% rate — not tax advice; consult a CPA.
Condition & rehab AI · 1 photo
This brand new 2026 Cornerstone by Clayton is in excellent condition with no visible repairs or maintenance needed. It offers a great opportunity for investors to build equity with minimal work.
Value-add opportunities
- Both Painting exterior and interior — Enhances curb appeal and interior aesthetics
- Both Landscaping and curb appeal improvements — Improves curb appeal and enhances property value
- Both Add a small front porch or patio — Increases living space and enhances curb appeal
Renovation cost estimate screening
Value-add ROI direction
- Both Painting exterior and interior — Enhances curb appeal and interior aesthetics ↑
- Both Landscaping and curb appeal improvements — Improves curb appeal and enhances property value ↑
- Both Add a small front porch or patio — Increases living space and enhances curb appeal ↑
ⓘ Cost ranges are severity-bucket heuristics (US national rule-of-thumb). Get contractor quotes + a written scope before underwriting a rehab budget.
Schools (NCES district)
- District
- Cumberland County Schools
- NCES district ID
- 3700011
- Math proficiency
- 32% ▼ -2.00%
- Reading proficiency
- 41% ▼ -1.00%
- Median HH income
- $44,168
- Composite
- 31.0/100
- National rank
- #6096
- State rank
- #126 of 178 in NC
Livability — Hope Mills
- Score
- 67/100
- State rank
- #234
- US rank
- #10761
Category grades
Schools grade is shown separately in the Schools card above.
Census & demographics
- County
- Cumberland County · 265,314 people
- City population
- 39,196
- Metro
- Fayetteville, NC
- Population (ZIP)
- 43,042
- Household income
- $67,544
- Rent vs Own
- Severe rent burden
- 1386.0
Population outlook (Cumberland County) Hauer SSP2
- Today (2025)
- 330,855 people
- By 2030
- 333,523 · +0.8%
- By 2040
- 335,583 · +1.4%
- By 2050
- 335,325 · +1.4%
- By 2075
- 342,853 · +3.6%
- By 2100
- 340,698 · +3.0%
Race, ethnicity, and origin ACS 2023
- Neighborhood character
- Diverse neighborhood (Simpson 0.68)
- Race & ethnicity
- White 44% Black 33% Hispanic / Latino 13% Two or more races 8% Asian 4% Native American 2%
- Hispanic origin (detail)
- Mexican 5% Puerto Rican 5%
- Common ancestry
- Italian 2% Slovak 1% Serbian 1%
- Foreign-born
- 8% · Canada, South Korea, Jamaica
- Languages at home
- 87% English-only · Spanish 9% Other Indo-European 1% French/Haitian/Cajun 1%
Political lean MEDSL · Cumberland
- 2024 margin
- D (+13.4) · D 56.1% · R 42.7% · Other 1.2%
- 2008→2024 swing
- -4.3pp toward R · 2008: 17.7pp · 2024: 13.4pp
- All cycles
- 2024: D+13.4 2020: D+16.6 2016: D+16.0 2012: D+19.7 2008: D+17.7
Not yet ingested
- Civics
- —
Market trends
- HPI YoY
- ▼ -51.69%
- Current HPI
- 239.7281
- Rent YoY
- ▲ 0.90%
- Metro
- Fayetteville, NC
- State GDP YoY
- ▲ 3.28%
- F500 in state
- 26
Industry mix (Fortune 500 HQ in NC)
| Industry | F500 HQs | Revenue |
|---|---|---|
| Financial Services | 2 | $213B |
|
||
| Retail | 2 | $95B |
|
||
| Industrial Conglomerate | 1 | $38B |
|
||
| Metals / Steel | 1 | $35B |
|
||
| Utilities | 1 | $30B |
|
||
| Industrial Machinery | 1 | $19B |
|
||
Price history
1 event — show timeline
- 2026-05-30 Listed $68,900 FSBO.com
Cash-flow waterfall
monthlySold comps — $/sqft
last 12 mo · ≤1 miLoading sold comps…