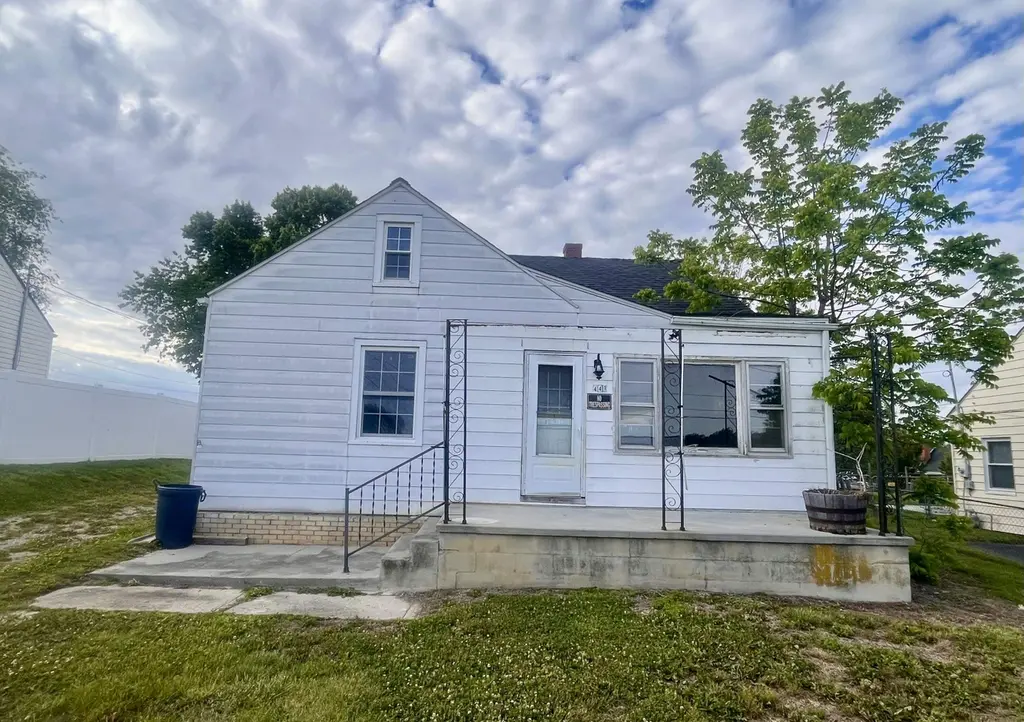
441 Dunlap Rd · Dublin, VA
Flood risk 1/10 · Minimal
- FEMA flood zone
- X (unshaded)
- Chance of flooding over 30 yrs
- 0.0%
- Est. flood insurance / yr
- $507 – $1,088
Fire risk 4/10 · Minor
- Est. fire insurance / yr
- $666 – $1,236
Heat risk 3/10 · Minor
- Hot days now (above 94°F)
- 7 days/yr
- Hot days in 30 yrs
- 20 days/yr
Wind risk 2/10 · Minimal
- Chance of severe wind over 30 yrs
- 1.0%
Air-quality risk 1/10 · Minimal
- Unhealthy air days now
- 0 days/yr
- Unhealthy air days in 30 yrs
- 0 days/yr
Risk factors via First Street. Map © Google.
Why this score? — see what drove the B grade
The composite is a weighted blend of 9 inputs, each scored 0–100. Each bar is that input's sub-score; the figure is the points it added to the 100-point composite (weight × sub-score).
- Cash flow +30.0/30.0
- 1% rule +10.0/10.0
- DSCR +10.0/10.0
- ARV discount +7.5/15.0
- Schools +4.6/10.0
- Livability +3.5/5.0
- Rent growth +2.5/5.0
- Condition / age +2.5/5.0
- Appreciation +0.0/10.0
$73,500
🖨 Deal sheet (PDF) 📄 Offer letter ✓ Due diligence
Listing remarks
Investor special right in the heart of Dublin! This 3BR / 1BA Cape Cod has already been gutted after a fire and is ready for someone to bring it back to life. Perfect opportunity for contractors, investors, or anyone looking for their next full renovation project. The hard part has already started, clean slate, tons of potential, and a GREAT location close to everything Dublin has to offer. Whether you’re looking to flip, rent, or create your next project from the ground up, this property has the bones and location to make it worth the work. Opportunities like this in Dublin don’t come around often. Bring your vision and make it your own!
Key facts
- Clean slate
- Great location
- Tons of potential
Tags
Property features AI
Exterior
- Utilities: Public water; Public sewer
- Home design: Single-family detached residence; One story
- Construction: Vinyl siding construction
- Exterior features: Vinyl siding; Yard includes shed(s)
Interior
- Bathrooms: One full bathroom
- Heating & cooling: Natural gas heating; Has heating
- Interior features: Five total rooms
Neighborhood map
What this means for you Summary
Snapshot
- This is a 3-bed/1.0-bath single-family listed at $74k.
Deal economics
- At list price, monthly cash flow is $787 ($9k/yr) — positive.
- The deal already cash-flows at list — no discount required.
- Meets the 1% rule at list price ($2k rent vs $74k).
- Recommended offer: $71k (3.0% below list) — sets the bar for market timing.
- Cap rate 19.1% vs local median 4.0% in Dublin — top-decile yield for the area; either an underpriced asset or a hidden risk that comps aren't pricing in. Stress-test before assuming the spread holds.
Location & tenants
- Location reads 69/100 on livability (#251 in VA) — a middle-class / working-renter tenant base. Strengths: cost of living A+, housing A+, crime A-; Watch: amenities F, commute F, health & safety F.
- Pulaski County Public School District (rural): math 48% / reading 61% proficiency, ranked #86 of 131 in VA (top 66%) — acceptable for families but not a draw, mixed tenant base, ~2y average lease.
- Zoned schools: Dublin Elementary (math 52% / reading 52%, grade C-, #696 of 1,108 statewide, top 66%, 436 students, 79% FRL); Pulaski County Middle (math 38% / reading 60%, grade C-, #238 of 342 statewide, top 71%, 807 students, 77% FRL); Pulaski County Senior High (math 63% / reading 70%, grade B, #195 of 319 statewide, top 62%, 1,246 students, 76% FRL) — zoned schools average 78% FRL vs 47% district-wide (30 pts higher); higher-poverty schools than district average — tighter screening recommended.
- Market conditions: 94 active listings in the ZIP; 1 comparable units currently listed for rent nearby; 39 units permitted in Pulaski County in 2024 (0 in 5+ unit buildings).
Forward outlook
- Local home prices are declining (-3.0%/yr); year-one equity from $508 of loan paydown is wiped out by about $2k of value loss. Plan a longer hold.
- Pulaski County population projected at -19% by 2050 — secular population decline; favor cash flow + early exit over multi-decade hold.
- At projected returns (-3.0% appreciation + 3.0% rent growth), your $21k cash investment doubles in ~3 years — after that, you're playing with house money.
Negotiation context
- It's been on market 37 days — a 3% lower offer ($71k) is reasonable based on typical stale-listing flexibility.
- Current owner paid $20k; list at $74k implies a 268% gain — meaningful room to come down on a strong offer.
Risks & watch-outs
- Watch-outs: built in 1939 — expect roof / HVAC / electrical / plumbing capex.
Questions for the listing agent
- It's been on market 37 days. Have you received any prior offers? Is the seller open to a 3% concession, seller financing, or rate buy-down credit?
- Built in 1939 — when were the roof, HVAC, electrical panel, plumbing, and water heater last replaced?
- Is there a deadline driving the sale (1031 exchange, divorce, estate, relocation)? That informs how much negotiation room exists.
- Schools are B-rated — typically a magnet for longer-tenancy family renters. What's the average tenant stay here, and is there a school-zone premium baked into asking?
- What's the average days-on-market for RENTAL listings here right now (not sales)? A rising rental-DOM trend means longer vacancies and softer asking-rent achievability than the comps imply.
- What's the recent tenant-quality profile in this submarket — average credit score on applications, eviction rate, late-payment / NSF rate, and stable-employment percentage? A property-management company in the area should have these aggregated.
- How much new for-sale + rental construction is in the pipeline within 1–3 miles? Heavy new supply typically softens prices + rents 12–24 months out; constrained supply supports both.
Investment metrics
- 1% rule
- 2.11% ✓
- Cap rate
- 19.14%
- Cash-on-cash
- 45.89%
- DSCR
- 3.04
- GRM
- 4.0
CMA / ARV
- ARV (median comp)
- $185,639
- List price
- $73,500
- Delta
- -60.41%
- Verdict
- UNDERPRICED
- Comps
- 20 within 1.0 mi
Show comp detail 12 sales within ~0.75 mi
| Address | Dist | Beds/Ba | Sqft | Sold | Price | $/sf | Match |
|---|---|---|---|---|---|---|---|
| 321 Galway Ave | 0.04mi | 2/1.0 (-1) | 1,176 (+2%) | 5mo | $135,000 | $115 | 85 |
| 325 Galway Ave | 0.03mi | 2/1.0 (-1) | 1,176 (+2%) | 12mo | $183,000 | $156 | 80 |
| 210 Second St | 0.47mi | 3/2.0 | 1,120 (-2%) | 5mo | $275,000 | $246 | 66 |
| 5495 Mitchell Dr | 0.27mi | 3/1.0 | 1,000 (-13%) | 2mo | $220,500 | $221 | 65 |
| 5490 Mitchell Dr | 0.29mi | 3/1.0 | 1,000 (-13%) | 5mo | $215,200 | $215 | 61 |
| 5434 Lovell Dr | 0.39mi | 3/1.0 | 1,000 (-13%) | 1mo | $249,900 | $250 | 59 |
| 5419 Collins St | 0.34mi | 3/2.0 | 1,246 (+8%) | 9mo | $234,500 | $188 | 58 |
| 5459 Mitchell Dr | 0.25mi | 3/1.0 | 1,000 (-13%) | 12mo | $200,000 | $200 | 57 |
| 5460 Shepard Dr | 0.33mi | 3/1.0 | 1,000 (-13%) | 12mo | $205,000 | $205 | 54 |
| 420 Powell Ave | 0.66mi | 3/2.0 | 1,169 (+2%) | 10mo | $140,300 | $120 | 53 |
| 5599 Locust Dr | 0.60mi | 3/1.0 | 1,000 (-13%) | 5mo | $239,900 | $240 | 46 |
| 5621 Rolling Hills Dr | 0.65mi | 3/1.0 | 1,000 (-13%) | 9mo | $199,000 | $199 | 40 |
Match score weights: distance 35% · size 25% · config 20% · recency 20%. Top-matched comps best support the ARV.
Projected returns pro-forma
-3.0% appreciation · 3.0% rent growth · sell at horizon
- IRR
- 43.1%
- Equity multiple
- 2.86×
- Total profit
- $38,197
- Equity at exit
- $10,959
- IRR
- 49.1%
- Equity multiple
- 5.75×
- Total profit
- $97,726
- Equity at exit
- $6,355
Cash invested: $20,580 (down + closing). Projections, not guarantees.
Landlord ↔ Tenant lean methodology
- Overall (STATE)
- 55 Moderately Landlord-Leaning
- State Virginia
- 55 Moderately Landlord-Leaning · D+2
- County
- — inherits STATE
- City
- — inherits STATE
ZIP-level market 24084
- Home prices YoY
- -34.4%
- Active inventory
- 94
- Price-to-rent
- 4.0×
Monthly cashflow live
- Estimated rent
- $1,550 medium interval (Pro) →
- Mortgage (P&I)
- −$385
- Tax from tax record
- −$21 /mo · $257/yr
- Insurance
- −$31
- HOA
- −$0
- Vacancy / Maint / Mgmt
- −$326
- Net cashflow
- $787
Break-even live
Sensitivity live
| Price | -10% $829 | -5% $808 | +0% $787 | +5% $766 | +10% $745 |
|---|---|---|---|---|---|
| Rent | -10% $665 | -5% $726 | +0% $787 | +5% $848 | +10% $909 |
| Rate | -1.0pp $824 | -0.5pp $806 | base $787 | +0.5pp $768 | +1.0pp $749 |
UW: 25.0% down · 7.5% · 30yr · 1.5% tax · 5.0% vac · 8.0% maint · 8.0% mgmt
Financing live
Cash to close
- Down payment
- $18,375
- Closing costs
- $2,205
- Reserves months
- —
- Total cash needed
- —
Loan-product check · same deal, 3 products live
Conventional
25% down · 7.5% · 30yr
- Down + closing
- —
- Monthly P&I
- —
- Monthly cashflow
- —
- DSCR
- —
- Eligible?
- —
Personal DTI + credit; lowest rate.
DSCR
20% down · 8.5% · 30yr
- Down + closing
- —
- Monthly P&I
- —
- Monthly cashflow
- —
- DSCR
- —
- Eligible?
- —
No personal income docs; deal must DSCR.
Hard money
10% down · 12.0% · 12mo
- Down + closing
- —
- Monthly P&I
- —
- Monthly cashflow
- —
- DSCR
- —
- Eligible?
- —
Short-term bridge; refi at stabilization.
Rent comps 1 comps
| Address | Beds | Baths | Sqft | Rent | $/sqft | DOM | Units | Dist |
|---|---|---|---|---|---|---|---|---|
| 428 Maple St Dublin, VA | 4.0 | 1.0 | 1116 | $1,550 | $1.39 | 45d | 1 | 0.48mi |
Listing history 20 events
-
2026-06-22days on market $73,500 Active 37 DOM
-
2026-06-19days on market $73,500 Active 35 DOM
-
2026-06-18days on market $73,500 Active 34 DOM
-
2026-06-17days on market $73,500 Active 33 DOM
-
2026-06-16days on market $73,500 Active 32 DOM
-
2026-06-15days on market $73,500 Active 31 DOM
-
2026-06-14days on market $73,500 Active 29 DOM
-
2026-06-13days on market $73,500 Active 28 DOM
-
2026-06-10days on market $73,500 Active 26 DOM
-
2026-06-09days on market $73,500 Active 25 DOM
-
2026-06-08days on market $73,500 Active 24 DOM
-
2026-06-07days on market $73,500 Active 23 DOM
-
2026-06-05days on market $73,500 Active 20 DOM
-
2026-06-02days on market $73,500 Active 18 DOM
-
2026-06-01days on market $73,500 Active 17 DOM
-
2026-05-31days on market $73,500 Active 16 DOM
-
2026-05-30days on market $73,500 Active 15 DOM
-
2026-05-15$73,500 Active 658-char remark
-
2024-11-14soldstatus $20,000
-
2001-10-05soldstatus $59,500
ⓘ Source: listings_history table (triggers on properties + properties_extension) + one-shot
backfill from property_details.listing_events for pre-trigger history.
Tax reassessment forecast VA · Resets to sale price
- Current annual tax
- $257 · $21/mo
- Projected year-2 tax
- $603 · $50/mo
- Expected delta
- +$346/yr (+$29/mo · 134.7%)
ⓘ Screening estimate from a state-policy table — verify with the county assessor before closing.
Climate risk First Street
- Flood 1/10 Low FEMA zone X (unshaded) · 0% chance over 30 yrs
- Wildfire 4/10 Moderate
- Heat 3/10 Moderate 7 d/yr ≥94°F today · 20 d/yr by 30 yrs out
- Wind 2/10 Low 100% chance of damaging wind over 30 yrs
- Air quality 1/10 Low 0 unhealthy d/yr today · 0 by 30 yrs out
Nearby sold comps map
Loading sold comps map…
Walkable amenities ~0.75 mi
Loading nearby amenities…
Taxation est. · year 1
- Rental income
- $18,600
- − Mortgage interest
- −$4,117
- − Property taxes
- −$257
- − Insurance
- −$368
- − Repairs & maintenance
- −$1,488
- − Management
- −$1,488
- − Depreciation
- −$2,138
- Taxable income
- $8,744
- Est. tax owed @ 24.0%
- −$2,099
- After-tax cash flow
- $7,346/yr
For passive investors: Depreciation is non-cash, so a rental often shows a tax loss while cash-flowing — sheltering income. Rental losses are passive: they offset passive income freely, and up to $25,000/yr can offset ordinary (W-2) income if you actively participate and your MAGI is under $100k (phasing out to $0 by $150k); unused losses carry forward. On sale, claimed depreciation is recaptured at up to 25%, and gains may owe capital-gains tax (a 1031 exchange can defer both). Figures are a year-1 estimate at your 24.0% rate — not tax advice; consult a CPA.
Schools (NCES district)
- District
- Pulaski County Public School District
- NCES district ID
- 5103150
- Math proficiency
- 48% ▼ -31.00%
- Reading proficiency
- 61% ▼ -13.00%
- Median HH income
- $44,912
- Composite
- 45.98/100
- National rank
- #2537
- State rank
- #86 of 131 in VA
Livability — Dublin
- Score
- 69/100
- State rank
- #251
- US rank
- #8475
Category grades
Schools grade is shown separately in the Schools card above.
Census & demographics
- Census place
- Dublin, VA
- Population (ZIP)
- 10,860
Population outlook (Pulaski County) Hauer SSP2
- Today (2025)
- 32,949 people
- By 2030
- 31,812 · -3.5%
- By 2040
- 29,224 · -11.3%
- By 2050
- 26,691 · -19.0%
- By 2075
- 21,312 · -35.3%
- By 2100
- 15,697 · -52.4%
Race, ethnicity, and origin ACS 2023
- Neighborhood character
- Predominantly White (91%)
- Race & ethnicity
- White 91% Black 5% Two or more races 2% Hispanic / Latino 1%
- Common ancestry
- Italian 2% Iranian 1% Serbian 1%
- Foreign-born
- 1%
- Languages at home
- 99% English-only · Spanish 1%
Political lean MEDSL · Pulaski
- 2024 margin
- Solid R (+44.7) · D 27.3% · R 72.0%
- 2008→2024 swing
- -25.1pp toward R · 2008: -19.5pp · 2024: -44.7pp
- All cycles
- 2024: R+44.7 2020: R+41.5 2016: R+40.7 2012: R+24.8 2008: R+19.5
Not yet ingested
- Civics
- —
Market trends
- HPI YoY
- ▼ -89.37%
- Current HPI
- 170.282
- Rent YoY
- —
- Metro
- —
- State GDP YoY
- ▲ 2.40%
- F500 in state
- 50
Industry mix (Fortune 500 HQ in VA)
| Industry | F500 HQs | Revenue |
|---|---|---|
| Aerospace / Defense | 4 | $236B |
|
||
| Technology / Defense | 3 | $32B |
|
||
| Financial Services | 2 | $176B |
|
||
| Utilities | 2 | $27B |
|
||
| Insurance | 2 | $25B |
|
||
| Technology | 2 | $15B |
|
||
Price history
+23.5% since first listed3 events — show timeline
- 2026-05-15 Listed $73,500 NRVMLS
- 2024-11-14 Sold (Public Records) $20,000 Public Records
- 2001-10-05 Sold (Public Records) $59,500 Public Records
Property tax history
-5.6%/yrLatest (2026): $257 · +0.0% YoY. Source: county tax records.
Cash-flow waterfall
monthlySold comps — $/sqft
last 12 mo · ≤1 miLoading sold comps…