415 E 52nd St Unit 9AA · New York, NY
Flood risk No data
- FEMA flood zone
- —
- Chance of flooding over 30 yrs
- —
- Est. flood insurance / yr
- —
Fire risk No data
- Est. fire insurance / yr
- —
Heat risk No data
- Hot days now (above threshold)
- —
- Hot days in 30 yrs
- —
Wind risk No data
- Chance of severe wind over 30 yrs
- —
Air-quality risk No data
- Unhealthy air days now
- —
- Unhealthy air days in 30 yrs
- —
Risk factors via First Street. Map © Google.
Why this score? — see what drove the D grade
The composite is a weighted blend of 9 inputs, each scored 0–100. Each bar is that input's sub-score; the figure is the points it added to the 100-point composite (weight × sub-score).
- ARV discount +7.5/15.0
- Appreciation +7.5/10.0
- Cash flow +6.3/30.0
- 1% rule +5.3/10.0
- Schools +5.0/10.0
- Rent growth +4.7/5.0
- Livability +3.8/5.0
- Condition / age +2.5/5.0
- DSCR +0.6/10.0
$700,000
🖨 Deal sheet (PDF) 📄 Offer letter ✓ Due diligence
Listing remarks
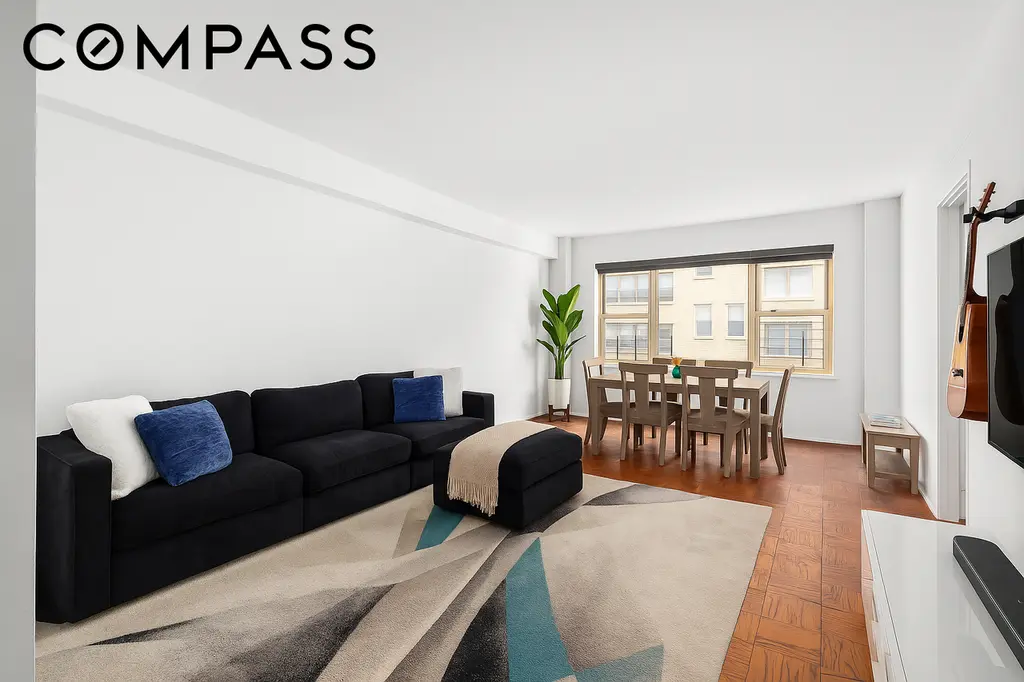
415 East 52nd Street #9AA – Sutton Place / Beekman Place Junior Four Co-op Welcome to your next home at The Sutton House, a full-service cooperative located on one of Manhattan’s only cul-de-sac streets where Sutton Place meets Beekman Place. This oversized junior four apartment offers a flexible layout that can easily convert to a two-bedroom, making it the perfect choice for today’s buyer who needs space for living, working, and entertaining. Step inside to soaring nine-foot ceilings and real wood flooring throughout. The generous entry foyer with a double coat closet opens into a sun-filled living room overlooking a tranquil courtyard with side views of New York City s
Key facts
- Flexible layout
- Renovated kitchen
- Custom closets
Tags
Property features AI
Finance
- Other: Pets allowed (cats and dogs permitted)
- Financial info: Monthly association fee: $2,082; Building contains 287 total units
- HOA & community: Monthly association fee
Exterior
- Parking: Garage
- Home design: High-rise building (19 stories); Entry on 9th floor; The Sutton House
- Construction: Lot dimensions approximately 258.75 x 200.84
- Exterior features: Building roof deck; North exposure
Interior
- Kitchen: Dishwasher
- Bedrooms: 3 total rooms (includes bedrooms and living areas)
- Bathrooms: 1 full bathroom
- Interior features: Unfurnished; Built-in features; High ceilings; Has view
- Laundry & utility: Building washer/dryer installation allowed; Common on-floor laundry; Common area laundry
Neighborhood map
What this means for you Summary
Snapshot
- This is a 2-bed/1.0-bath condo listed at $700k.
Deal economics
- At list price, monthly cash flow is $-1k ($-15k/yr) — negative.
- To cash-flow at today's rent, offer at most $520k (25.7% below list).
- Meets the 1% rule at list price ($7k rent vs $700k).
- Recommended offer: $520k (25.7% below list) — sets the bar for cash-flow.
- Cap rate 4.2% vs local median 2.6% in New York — top-decile yield for the area; either an underpriced asset or a hidden risk that comps aren't pricing in. Stress-test before assuming the spread holds.
Location & tenants
- Location reads 75/100 on livability (#268 in NY, #4,188 nationally) — a middle-class / working-renter tenant base. Strengths: amenities A+, commute A+, health & safety A; Watch: crime F, cost of living F.
- Zoned schools: Elm Tree Elementary School (math 27% / reading 52%, grade F, #1,444 of 2,108 statewide, top 71%, 806 students, 94% FRL); Mark Twain Is 239 For The Gifted And Talented (math 90% / reading 96%, grade A+, #6 of 729 statewide, top 1%, 1,207 students, 44% FRL); Midwood High School (math 94% / reading 96%, grade A+, #83 of 1,100 statewide, top 8%, 4,062 students, 73% FRL).
- Market conditions: Rents rising fast (+8.7%/yr); 715 active listings in the ZIP; 40 comparable units currently listed for rent nearby; rentals leasing fast (median 10d on market — plan ~1-2 weeks tenant-placement turnaround); high-income renter base; 4,467 units permitted in New York County in 2024 (4,463 in 5+ unit buildings).
- At $7,187/mo this rent would consume 50% of the median local household income ($172k/yr) (locally 2256% of renters already pay >50% of income on rent) — very limited rent-growth headroom before tenants either downsize or default.
Forward outlook
- In year one you build about $40k of equity ($5k loan paydown + $35k appreciation (5.0% local appreciation)).
- New York County population projected at +21% by 2050 — long-run rental-demand tailwind backs the buy-and-hold thesis.
- By year 2, paydown + projected appreciation supports a ~$64k cash-out refi (75% LTV) — recoverable capital for the next deal without selling this one.
Negotiation context
- It's been on market 16 days — a 2% lower offer ($690k) is reasonable based on typical stale-listing flexibility.
- 6 sale attempts since 11y ago with the ask held roughly flat each time — persistent listings suggest the price (not the market) is what's stuck; bring a comps-based counter.
Risks & watch-outs
- Watch-outs: HOA is 29% of rent; built in 1956 — expect roof / HVAC / electrical / plumbing capex.
Questions for the listing agent
- What do current leases actually rent for vs. the listed asking? Can we see a recent rent roll and the last 12 months of T-12 income?
- Built in 1956 — when were the roof, HVAC, electrical panel, plumbing, and water heater last replaced?
- What does the HOA fee cover, when was the last increase, and are there any pending special assessments or reserve-fund shortfalls?
- Any open or pending special assessments — roof, HVAC, plumbing, elevator, façade? What's the per-unit balance and payoff schedule, and is the seller paying it off at close or rolling it to the buyer?
- Is there a deadline driving the sale (1031 exchange, divorce, estate, relocation)? That informs how much negotiation room exists.
- Schools are B-rated — typically a magnet for longer-tenancy family renters. What's the average tenant stay here, and is there a school-zone premium baked into asking?
- Crime grade is F in this area — have there been break-ins, vandalism, or insurance claims at this property in the last 3 years? What carrier currently insures it and at what premium?
- The area grade is low — what's the realistic commute time and amenity access for the typical tenant pool here? Any planned neighborhood developments (good or bad) we should know about?
- What's the average days-on-market for RENTAL listings here right now (not sales)? A rising rental-DOM trend means longer vacancies and softer asking-rent achievability than the comps imply.
- What's the recent tenant-quality profile in this submarket — average credit score on applications, eviction rate, late-payment / NSF rate, and stable-employment percentage? A property-management company in the area should have these aggregated.
- How much new apartment / multifamily construction is in the pipeline within 1–3 miles? Heavy new supply (>2% of stock underway) typically softens rents 12–24 months out; light construction supports rent growth.
Investment metrics
- 1% rule
- 1.03% ✓
- Cap rate
- 4.16%
- Cash-on-cash
- -7.60%
- DSCR
- 0.66
- GRM
- 8.1
CMA / ARV
No comps found within radius.
Projected returns pro-forma
4.97% appreciation · 8.0% rent growth · sell at horizon
- IRR
- 9.3%
- Equity multiple
- 1.61×
- Total profit
- $120,280
- Equity at exit
- $395,282
- IRR
- 13.5%
- Equity multiple
- 3.69×
- Total profit
- $526,540
- Equity at exit
- $681,050
Cash invested: $196,000 (down + closing). Projections, not guarantees.
Landlord ↔ Tenant lean methodology
- Overall (CITY)
- 0 Strongly Tenant-Friendly
- State New York
- 15 Strongly Tenant-Friendly · D+10
- County
- — inherits STATE
- City New York
- 0 Strongly Tenant-Friendly · D+34
ZIP-level market 10022
- Home prices YoY
- 2.4%
- Rents YoY
- 8.7%
- Active inventory
- 715
- Price-to-rent
- 8.1×
Monthly cashflow live
- Estimated rent
- $7,187 high interval (Pro) →
- Mortgage (P&I)
- −$3,671
- Tax est. 1.5%
- −$875 /mo · $10,500/yr
- Insurance
- −$292
- HOA
- −$2,082
- Vacancy / Maint / Mgmt
- −$1,509
- Net cashflow
- $-1,242
Break-even live
Sensitivity live
| Price | -10% $-758 | -5% $-1,000 | +0% $-1,242 | +5% $-1,484 | +10% $-1,726 |
|---|---|---|---|---|---|
| Rent | -10% $-1,810 | -5% $-1,526 | +0% $-1,242 | +5% $-958 | +10% $-674 |
| Rate | -1.0pp $-890 | -0.5pp $-1,064 | base $-1,242 | +0.5pp $-1,424 | +1.0pp $-1,608 |
UW: 25.0% down · 7.5% · 30yr · 1.5% tax · 5.0% vac · 8.0% maint · 8.0% mgmt
Financing live
Cash to close
- Down payment
- $175,000
- Closing costs
- $21,000
- Reserves months
- —
- Total cash needed
- —
Loan-product check · same deal, 3 products live
Conventional
25% down · 7.5% · 30yr
- Down + closing
- —
- Monthly P&I
- —
- Monthly cashflow
- —
- DSCR
- —
- Eligible?
- —
Personal DTI + credit; lowest rate.
DSCR
20% down · 8.5% · 30yr
- Down + closing
- —
- Monthly P&I
- —
- Monthly cashflow
- —
- DSCR
- —
- Eligible?
- —
No personal income docs; deal must DSCR.
Hard money
10% down · 12.0% · 12mo
- Down + closing
- —
- Monthly P&I
- —
- Monthly cashflow
- —
- DSCR
- —
- Eligible?
- —
Short-term bridge; refi at stabilization.
Rent comps 40 comps
| Address | Beds | Baths | Sqft | Rent | $/sqft | DOM | Units | Dist |
|---|---|---|---|---|---|---|---|---|
| 420 E 54th St New York, NY | 3.0 | 1.0–2.5 | 1018 | $10,299 | $10.12 | 0d | 12 | 0.05mi |
| 959 1st Ave Unit 6X New York, NY | 1.0 | 1.0 | 739 | $6,000 | $8.12 | 26d | 1 | 0.08mi |
| 500 E 54th St Unit 601 New York, NY | 3.0 | 2.0 | 860 | $7,390 | $8.59 | 9d | 1 | 0.10mi |
| 412 E 55th St New York, NY | 1.0 | 1.0 | 767 | $5,250 | $6.84 | 26d | 1 | 0.11mi |
| 340 E 51st St New York, NY | 2.0 | 1.0–2.0 | 791 | $7,630 | $9.65 | 5d | 3 | 0.15mi |
| 323 E 51st St Unit 1024750P New York, NY | 2.0–4.0 | 2.0–3.5 | 2093 | $21,945 | $10.48 | 1d | 3 | 0.16mi |
| 300 E 51st St New York, NY | 2.0 | 1.0–2.0 | 875 | $7,930 | $9.06 | 4d | 3 | 0.20mi |
| 400 E 57th St New York, NY | 1.0–2.0 | 1.0–2.0 | 1436 | $6,595 | $4.59 | 26d | 3 | 0.21mi |
| 400 E 57th St #2106 New York, NY | 2.0 | 1.0–2.0 | 903 | $8,590 | $9.51 | 5d | 3 | 0.22mi |
| 250 E 53rd St #403 New York, NY | 1.0 | 1.0 | 823 | $5,850 | $7.11 | 26d | 1 | 0.22mi |
| 300 E 57th St #1714 New York, NY | 1.0 | 1.0 | 820 | $5,800 | $7.07 | 22d | 1 | 0.28mi |
| 250 E 49th St Unit 4A New York, NY | 1.0 | 1.0 | 802 | $6,400 | $7.98 | 26d | 1 | 0.29mi |
| 220 E 49th St Unit 1021974P New York, NY | 2.0 | 1.0 | 742 | $5,190 | $6.99 | 16d | 1 | 0.34mi |
| 227 E 57th St Unit 14C New York, NY | 1.0 | 1.0 | 780 | $4,750 | $6.09 | 26d | 1 | 0.35mi |
| 300-302 E 46th St Unit 12J New York, NY | 3.0 | 1.0 | 900 | $8,000 | $8.89 | 7d | 1 | 0.37mi |
| 300 E 46th St New York, NY | 2.0–3.0 | 1.0 | 716 | $4,300 | $6.00 | 26d | 2 | 0.38mi |
| 420 E 61st St Unit 1330815P New York, NY | 2.0–3.0 | 2.0–3.0 | 1490 | $11,424 | $7.67 | 1d | 2 | 0.41mi |
| 138 E 50th St New York, NY | 2.0 | 2.0–2.5 | 1432 | $13,650 | $9.53 | 26d | 1 | 0.42mi |
| 160 E 48th St New York, NY | 3.0 | 1.0–2.0 | 878 | $8,572 | $9.76 | 5d | 9 | 0.43mi |
| 150 E 57th St New York, NY | 5.0 | 1.0–7.5 | 2750 | $15,738 | $5.72 | 3d | 5 | 0.45mi |
| 279 E 44th St #894 New York, NY | 1.0 | 1.0 | 950 | $7,190 | $7.57 | 8d | 1 | 0.47mi |
| 252 E 61st St #638 New York, NY | 1.0 | 1.0 | 666 | $5,530 | $8.30 | 3d | 2 | 0.47mi |
| 135 E 47th St Unit 22F New York, NY | 1.0 | 1.0 | 700 | $7,500 | $10.71 | 24d | 1 | 0.47mi |
| 885 Main St Unit 6B New York, NY | 2.0 | 2.0 | 950 | $5,300 | $5.58 | 1d | 1 | 0.49mi |
| 885 Main St #705 New York, NY | 2.0 | 2.0 | 1100 | $4,800 | $4.36 | 1d | 1 | 0.49mi |
| 230 E 44th St #2165 New York, NY | 1.0–2.0 | 1.0 | 568 | $5,320 | $9.36 | 26d | 2 | 0.50mi |
| 303 Park Ave #2203 New York, NY | 1.0 | 1.5 | 796 | $13,500 | $16.96 | 9d | 1 | 0.54mi |
| 303 Park Ave #2321 New York, NY | 1.0 | 1.5 | 808 | $14,500 | $17.95 | 9d | 1 | 0.54mi |
| 117 E 57th St New York, NY | 1.0 | 1.0 | 732 | $5,975 | $8.16 | 6d | 2 | 0.54mi |
| 301 E 63rd St New York, NY | 2.0 | 1.0 | 975 | $6,650 | $6.82 | 6d | 1 | 0.57mi |
| 220 E 63rd St #567 New York, NY | 1.0 | 1.0 | 800 | $6,460 | $8.07 | 22d | 1 | 0.58mi |
| 225 E 63rd St #1675 New York, NY | 1.0 | 1.0 | 627 | $5,230 | $8.34 | 26d | 2 | 0.61mi |
| 360 E 65th St #1283 New York, NY | 1.0–3.0 | 1.0–2.0 | 1059 | $6,815 | $6.44 | 5d | 3 | 0.63mi |
| 220 E 65th St New York, NY | 1.0 | 1.0 | 700 | $5,950 | $8.50 | 4d | 1 | 0.64mi |
| 304 E 65th St Unit 11C New York, NY | 1.0 | 1.0 | 770 | $5,450 | $7.08 | 17d | 1 | 0.64mi |
| 685 1st Ave Unit 1321817P New York, NY | 2.0 | 2.0 | 1367 | $17,447 | $12.76 | 24d | 1 | 0.65mi |
| 400 E 66th St Unit 1016404P New York, NY | 1.0–2.0 | 1.0–2.0 | 791 | $17,070 | $21.58 | 5d | 2 | 0.66mi |
| 40-44 E 61st St Unit 15B New York, NY | 2.0 | 2.0 | 1200 | $15,000 | $12.50 | 16d | 1 | 0.71mi |
| 222 E 39th St New York, NY | 1.0–4.0 | 1.0–2.0 | 1100 | $6,133 | $5.58 | 5d | 20 | 0.75mi |
| 222 E 39th St New York, NY | 1.0–4.0 | 1.0–2.0 | 1100 | $6,783 | $6.17 | 22d | 19 | 0.75mi |
HOA detail condo
- Monthly dues
- $2,082 · $24,984/yr
- Assessments
- None detected in remarks — confirm with the listing agent.
Listing history 10 events
-
2026-06-21days on market $700,000 Active 16 DOM
-
2026-06-18days on market $700,000 Active 13 DOM
-
2026-06-17days on market $700,000 Active 12 DOM
-
2026-06-16days on market $700,000 Active 11 DOM
-
2026-06-15days on market $700,000 Active 10 DOM
-
2026-06-13days on market $700,000 Active 8 DOM
-
2026-06-09days on market $700,000 Active 4 DOM
-
2026-06-08days on market $700,000 Active 3 DOM
-
2026-06-07remarks 681-char remark
-
2026-06-07$700,000 Active 2 DOM
ⓘ Source: listings_history table (triggers on properties + properties_extension) + one-shot
backfill from property_details.listing_events for pre-trigger history.
Nearby sold comps map
Loading sold comps map…
Walkable amenities ~0.75 mi
Loading nearby amenities…
Taxation est. · year 1
- Rental income
- $86,239
- − Mortgage interest
- −$39,211
- − Property taxes
- −$10,500
- − Insurance
- −$3,500
- − Repairs & maintenance
- −$6,899
- − Management
- −$6,899
- − HOA
- −$24,984
- − Depreciation
- −$20,364
- Taxable loss
- −$26,118
- Est. tax savings @ 24.0%
- +$6,268
- After-tax cash flow
- $-8,637/yr
For passive investors: Depreciation is non-cash, so a rental often shows a tax loss while cash-flowing — sheltering income. Rental losses are passive: they offset passive income freely, and up to $25,000/yr can offset ordinary (W-2) income if you actively participate and your MAGI is under $100k (phasing out to $0 by $150k); unused losses carry forward. On sale, claimed depreciation is recaptured at up to 25%, and gains may owe capital-gains tax (a 1031 exchange can defer both). Figures are a year-1 estimate at your 24.0% rate — not tax advice; consult a CPA.
Schools (NCES district)
No district data.
Livability — New York
- Score
- 75/100
- State rank
- #268
- US rank
- #4188
Category grades
Schools grade is shown separately in the Schools card above.
Census & demographics
- Census place
- New York, NY
- County
- New York County · 1,599,927 people
- City population
- 7,731,280
- Metro
- New York-Newark-Jersey City, NY-NJ-PA
- Population (ZIP)
- 34,049
- Household income
- $172,026
- Rent vs Own
- Severe rent burden
- 2256.0
Population outlook (New York County) Hauer SSP2
- Today (2025)
- 1,825,725 people
- By 2030
- 1,904,611 · +4.3%
- By 2040
- 2,052,719 · +12.4%
- By 2050
- 2,206,601 · +20.9%
- By 2075
- 2,509,427 · +37.4%
- By 2100
- 2,702,933 · +48.0%
Race, ethnicity, and origin ACS 2023
- Neighborhood character
- Predominantly White (73%)
- Race & ethnicity
- White 73% Asian 12% Hispanic / Latino 8% Two or more races 7% Black 2%
- Hispanic origin (detail)
- Mexican 1% Puerto Rican 1% Dominican 1%
- Common ancestry
- Romanian 5% Scotch-Irish 5% Lithuanian 2%
- Foreign-born
- 24% · Canada, China, South Korea
- Languages at home
- 75% English-only · Spanish 6% Other Indo-European 6% Chinese 3%
Political lean MEDSL · New York
- 2024 margin
- Solid D (+64.8) · D 82.4% · R 17.6%
- 2008→2024 swing
- -7.4pp toward R · 2008: 72.2pp · 2024: 64.8pp
- All cycles
- 2024: D+64.8 2020: D+74.5 2016: D+77.2 2012: D+69.6 2008: D+72.2
Not yet ingested
- Civics
- —
Market trends
- HPI YoY
- ▲ 4.97%
- Current HPI
- 215.7225
- Rent YoY
- ▲ 8.69%
- Metro
- New York-Newark-Jersey City, NY-NJ-PA
- State GDP YoY
- ▲ 2.60%
- F500 in state
- 92
Industry mix (Fortune 500 HQ in NY)
| Industry | F500 HQs | Revenue |
|---|---|---|
| Financial Services | 10 | $950B |
|
||
| Consumer Goods | 9 | $162B |
|
||
| Insurance | 4 | $225B |
|
||
| Telecommunications | 2 | $144B |
|
||
| Pharmaceuticals | 2 | $112B |
|
||
| Media / Entertainment | 2 | $69B |
|
||
Price history
-14.6% since first listed10 events — show timeline
- 2026-06-05 Listed $700,000 RLS at REBNY
- 2025-10-29 Price Changed $700,000 RLS at REBNY
- 2023-04-20 Price Changed $750,000 RLS at REBNY
- 2023-03-17 Price Changed $799,000 RLS at REBNY
- 2022-11-18 Listed $850,000 RLS at REBNY
- 2019-12-06 Price Changed $869,000 RLS at REBNY
- 2019-10-17 Listed $869,000 RLS at REBNY
- 2019-10-17 Listed $879,000 RLS at REBNY
- 2015-08-17 Listed $820,000 RLS at REBNY
- 2015-08-17 Listed $820,000 RLS at REBNY
Cash-flow waterfall
monthlySold comps — $/sqft
last 12 mo · ≤1 miLoading sold comps…