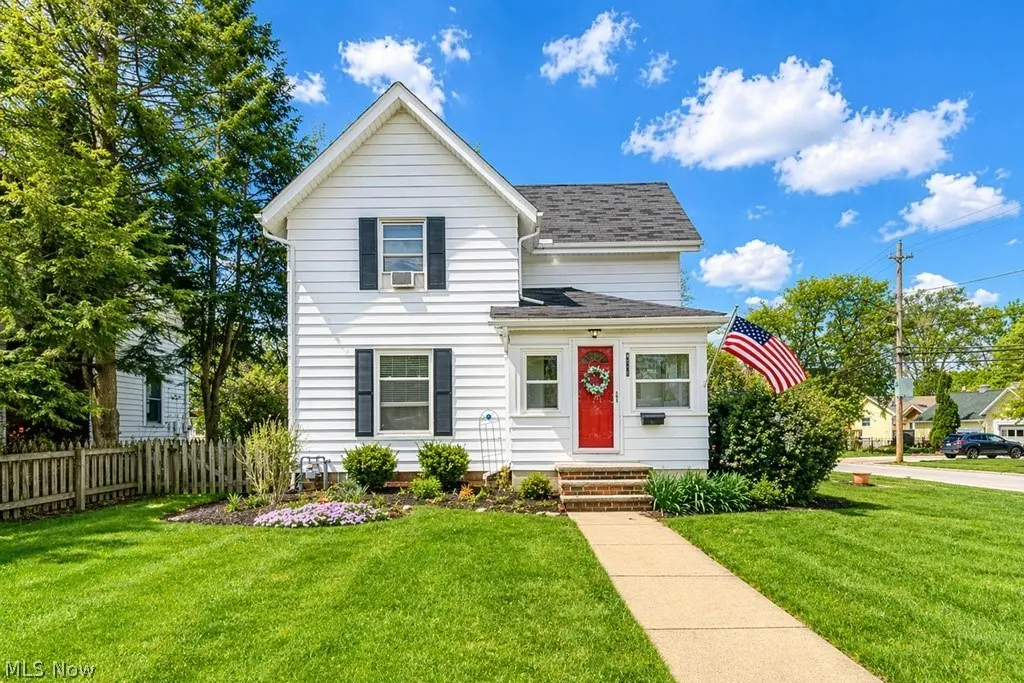
4516 Wood St · Willoughby, OH
Flood risk 1/10 · Minimal
- FEMA flood zone
- X (unshaded)
- Chance of flooding over 30 yrs
- 0.0%
- Est. flood insurance / yr
- $473 – $860
Fire risk 1/10 · Minimal
- Est. fire insurance / yr
- $713 – $1,323
Heat risk 3/10 · Minor
- Hot days now (above 95°F)
- 7 days/yr
- Hot days in 30 yrs
- 17 days/yr
Wind risk 1/10 · Minimal
- Chance of severe wind over 30 yrs
- —
Air-quality risk 4/10 · Minor
- Unhealthy air days now
- 3 days/yr
- Unhealthy air days in 30 yrs
- 5 days/yr
Risk factors via First Street. Map © Google.
Why this score? — see what drove the D- grade
The composite is a weighted blend of 9 inputs, each scored 0–100. Each bar is that input's sub-score; the figure is the points it added to the 100-point composite (weight × sub-score).
- ARV discount +14.0/15.0
- Cash flow +5.9/30.0
- Schools +4.3/10.0
- Livability +3.8/5.0
- Rent growth +3.5/5.0
- Condition / age +2.5/5.0
- 1% rule +1.2/10.0
- DSCR +0.3/10.0
- Appreciation +0.0/10.0
$250,000
🖨 Deal sheet 📄 Offer letter ✓ Due diligence
Listing remarks
Welcome to 4516 Wood Street, a truly exceptional traditional colonial nestled in the heart of downtown Willoughby, where timeless character meets thoughtful modern updates in one of the area’s most desirable and walkable neighborhoods. Perfectly positioned just minutes from vibrant downtown shops, dining, and entertainment, this stunning four bedroom, two full bathroom residence offers both charm and convenience with a highly functional layout that includes a rare first floor bedroom and full bath. From the moment you arrive, the home’s classic curb appeal is enhanced by mature landscaping, a beautifully maintained yard, and a welcoming front entry, while an oversized two car ga
Key facts
- Hardwood flooring
- Maintained yard
- Outdoor picnic area
Tags
Property features AI
Finance
- HOA & community: Community includes sidewalks, park, playground and nearby restaurants
Exterior
- Parking: Detached garage; Two garage spaces
- Utilities: Public water; Public sewer
- Home design: Two-story home; Updated/remodeled condition
- Construction: Aluminum siding; Asphalt/fiberglass roof
- Exterior features: Partial basement; Basement storage; Suburban setting; Sidewalks; Nearby park and playground; Nearby restaurants
Interior
- Kitchen: Granite counters; Built-in features; Dishwasher; Microwave; Range; Refrigerator
- Bedrooms: One main-level bedroom; Additional bedrooms on second floor
- Flooring: Hardwood in kitchen/eat-in area and dining room; Carpet in living room, loft, mud room and several bedrooms; Tile in entry/foyer; Ceramic tile in one bathroom
- Bathrooms: Two full bathrooms; One main-level bathroom
- Heating & cooling: Forced air heating (gas); Central air conditioning
- Interior features: Entrance foyer; Eat-in kitchen; Granite counters; Storage; Updated/remodeled
- Laundry & utility: In-unit laundry; Washer; Dryer; Utility room (lower level)
Neighborhood map
What this means for you Summary
Snapshot
- This is a 3-bed/2.0-bath single-family listed at $250k.
Deal economics
- At list price, monthly cash flow is $-488 ($-6k/yr) — negative.
- To cash-flow at today's rent, offer at most $164k (34.5% below list).
- To meet the 1% rule (rent ≥ 1% of price), the offer needs to be $155k (38.0% below list).
- Recommended offer: $155k (38.0% below list) — sets the bar for 1% rule.
- Cap rate 3.9% vs local median 2.8% in Willoughby — top-decile yield for the area; either an underpriced asset or a hidden risk that comps aren't pricing in. Stress-test before assuming the spread holds.
Location & tenants
- Location reads 75/100 on livability (#249 in OH, #3,972 nationally) — a middle-class / working-renter tenant base. Strengths: crime A+, cost of living A+, housing A+; Watch: health & safety D, amenities F, commute F.
- Willoughby-Eastlake City (suburban): math 42% / reading 58% proficiency, ranked #434 of 656 in OH (top 66%) — acceptable for families but not a draw, mixed tenant base, ~2y average lease.
- Market conditions: Rents rising fast (+4.0%/yr); 187 active listings in the ZIP; 3 comparable units currently listed for rent nearby; rentals at typical pace (median 17d on market — plan ~3-4 weeks tenant-placement turnaround); solid renter incomes; 448 units permitted in Lake County in 2024 (0 in 5+ unit buildings).
Forward outlook
- Local home prices are declining (-3.0%/yr); year-one equity from $2k of loan paydown is wiped out by about $8k of value loss. Plan a longer hold.
- Lake County population projected to shrink 8% by 2050 — rents likely to lag national; underwrite the cash flow, not the appreciation.
Negotiation context
- It's been on market 48 days — a 3% lower offer ($242k) is reasonable based on typical stale-listing flexibility.
- 5 sale attempts since 32y ago; this cycle's ask has dropped $75k (23%) from the opening price — seller is motivated, your offer sets the floor, not the list.
- Current owner paid $152k; list at $250k implies a 64% gain — meaningful room to come down on a strong offer.
Risks & watch-outs
- Watch-outs: built in 1940 — expect roof / HVAC / electrical / plumbing capex.
Questions for the listing agent
- What do current leases actually rent for vs. the listed asking? Can we see a recent rent roll and the last 12 months of T-12 income?
- It's been on market 48 days. Have you received any prior offers? Is the seller open to a 38% concession, seller financing, or rate buy-down credit?
- Built in 1940 — when were the roof, HVAC, electrical panel, plumbing, and water heater last replaced?
- Is there a deadline driving the sale (1031 exchange, divorce, estate, relocation)? That informs how much negotiation room exists.
- Schools are B-rated — typically a magnet for longer-tenancy family renters. What's the average tenant stay here, and is there a school-zone premium baked into asking?
- The area grade is low — what's the realistic commute time and amenity access for the typical tenant pool here? Any planned neighborhood developments (good or bad) we should know about?
- What's the average days-on-market for RENTAL listings here right now (not sales)? A rising rental-DOM trend means longer vacancies and softer asking-rent achievability than the comps imply.
- What's the recent tenant-quality profile in this submarket — average credit score on applications, eviction rate, late-payment / NSF rate, and stable-employment percentage? A property-management company in the area should have these aggregated.
- How much new for-sale + rental construction is in the pipeline within 1–3 miles? Heavy new supply typically softens prices + rents 12–24 months out; constrained supply supports both.
Investment metrics
- 1% rule
- 0.62% ✗
- Cap rate
- 3.95%
- Cash-on-cash
- -8.37%
- DSCR
- 0.63
- GRM
- 13.4
CMA / ARV
- ARV (median comp)
- $292,500
- List price
- $250,000
- Delta
- -14.53%
- Verdict
- UNDERPRICED
- Comps
- 20 within 1.0 mi
Show comp detail 12 sales within ~0.75 mi
| Address | Dist | Beds/Ba | Sqft | Sold | Price | $/sf | Match |
|---|---|---|---|---|---|---|---|
| 4615 Center St | 0.13mi | 3/2.5 | 1,352 (+1%) | 4mo | $295,000 | $218 | 88 |
| 4587 Wood St | 0.09mi | 3/2.5 | 1,398 (+4%) | 3mo | $290,000 | $207 | 84 |
| 4294 Campus Ln | 0.28mi | 3/3.0 | 1,312 (-2%) | 2mo | $510,000 | $389 | 78 |
| 37646 Jordan Dr | 0.36mi | 3/1.5 | 1,356 (+1%) | 2mo | $213,000 | $157 | 77 |
| 4329 River St | 0.27mi | 3/1.5 | 1,373 (+2%) | 8mo | $140,000 | $102 | 75 |
| 37948 Barnes Ct | 0.15mi | 3/2.0 | 1,200 (-10%) | 2mo | $163,900 | $137 | 74 |
| 37510 Park Ave | 0.48mi | 3/2.0 | 1,436 (+7%) | 2mo | $270,000 | $188 | 64 |
| 4278 Murray Ave | 0.36mi | 3/1.5 | 1,216 (-9%) | 3mo | $299,900 | $247 | 64 |
| 38217 Wilson Ave | 0.19mi | 2/2.0 (-1) | 1,166 (-13%) | 3mo | $225,000 | $193 | 62 |
| 38107 Hastings Ave | 0.41mi | 2/2.0 (-1) | 1,217 (-9%) | 2mo | $215,000 | $177 | 59 |
| 4138 Buckeye Ave | 0.69mi | 3/2.5 | 1,461 (+9%) | 2mo | $340,000 | $233 | 49 |
| 37710 Vine St | 0.69mi | 4/1.0 (+1) | 1,160 (-13%) | 10mo | $190,000 | $164 | 28 |
Match score weights: distance 35% · size 25% · config 20% · recency 20%. Top-matched comps best support the ARV.
Projected returns pro-forma
-3.0% appreciation · 4.01% rent growth · sell at horizon
- IRR
- -30.0%
- Equity multiple
- -0.00×
- Total profit
- $-70,005
- Equity at exit
- $37,276
- IRR
- -27.3%
- Equity multiple
- -0.35×
- Total profit
- $-94,279
- Equity at exit
- $21,615
Cash invested: $70,000 (down + closing). Projections, not guarantees.
Landlord ↔ Tenant lean methodology
- Overall (STATE)
- 73 Landlord-Friendly
- State Ohio
- 73 Landlord-Friendly · R+6
- County
- — inherits STATE
- City
- — inherits STATE
ZIP-level market 44094
- Rents YoY
- 4.0%
- Active inventory
- 187
- Price-to-rent
- 13.4×
Monthly cashflow live
- Estimated rent
- $1,551 medium interval (Pro) →
- Mortgage (P&I)
- −$1,311
- Tax from tax record
- −$298 /mo · $3,580/yr
- Insurance
- −$104
- HOA
- −$0
- Vacancy / Maint / Mgmt
- −$326
- Net cashflow
- $-488
Break-even live
UW: 25.0% down · 7.5% · 30yr · 1.5% tax · 5.0% vac · 8.0% maint · 8.0% mgmt
Financing live
Cash to close
- Down payment
- $62,500
- Closing costs
- $7,500
- Reserves months
- —
- Total cash needed
- —
Loan-product check · same deal, 3 products live
Conventional
25% down · 7.5% · 30yr
- Down + closing
- —
- Monthly P&I
- —
- Monthly cashflow
- —
- DSCR
- —
- Eligible?
- —
Personal DTI + credit; lowest rate.
DSCR
20% down · 8.5% · 30yr
- Down + closing
- —
- Monthly P&I
- —
- Monthly cashflow
- —
- DSCR
- —
- Eligible?
- —
No personal income docs; deal must DSCR.
Hard money
10% down · 12.0% · 12mo
- Down + closing
- —
- Monthly P&I
- —
- Monthly cashflow
- —
- DSCR
- —
- Eligible?
- —
Short-term bridge; refi at stabilization.
Rent comps 3 comps
| Address | Beds | Baths | Sqft | Rent | $/sqft | DOM | Units | Dist |
|---|---|---|---|---|---|---|---|---|
| 37848 Euclid Ave Unit down Willoughby, OH | 2.0 | 1.5 | 1200 | $1,599 | $1.33 | 3d | 1 | 0.19mi |
| 4088 Erie St Willoughby, OH | 2.0 | 1.0 | 900 | $1,200 | $1.33 | 44d | 1 | 0.54mi |
| 1323 E 360th St Eastlake, OH | 3.0 | 1.0 | 1036 | $1,599 | $1.54 | 16d | 1 | 1.45mi |
Listing history 23 events
-
2026-06-18days on market $250,000 Active 48 DOM
-
2026-06-17days on market $250,000 Active 47 DOM
-
2026-06-16days on market $250,000 Active 46 DOM
-
2026-06-15days on market $250,000 Active 45 DOM
-
2026-06-13days on market $250,000 Active 43 DOM
-
2026-06-13pricestatusdays on market $250,000 Active 42 DOM
-
2026-06-07statusdays on market $279,900 Pending 41 DOM
-
2026-06-03days on market $279,900 Active 40 DOM
-
2026-06-02days on market $279,900 Active 39 DOM
-
2026-06-01days on market $279,900 Active 38 DOM
-
2026-05-31days on market $279,900 Active 37 DOM
-
2026-05-01price $299,900 2010-char remark
-
2026-04-24$325,000 Active 2010-char remark
-
2001-07-31soldstatus $152,500
-
2000-01-30historical
-
1999-10-02$149,990
-
1997-02-03soldstatus $127,500
-
1996-06-09historical
-
1995-12-11$129,900
-
1994-11-30historical
-
1994-06-03$129,900
-
1990-03-20soldstatus $80,500
-
1988-12-15soldstatus $53,500
ⓘ Source: listings_history table (triggers on properties + properties_extension) + one-shot
backfill from property_details.listing_events for pre-trigger history.
Tax reassessment forecast OH · Partial reset (capped growth)
- Current annual tax
- $3,580 · $298/mo
- Projected year-2 tax
- $3,740 · $312/mo
- Expected delta
- +$160/yr (+$13/mo · 4.5%)
ⓘ Screening estimate from a state-policy table — verify with the county assessor before closing.
Climate risk First Street
- Flood 1/10 Low FEMA zone X (unshaded) · 0% chance over 30 yrs
- Wildfire 1/10 Low
- Heat 3/10 Moderate 7 d/yr ≥95°F today · 17 d/yr by 30 yrs out
- Wind 1/10 Low
- Air quality 4/10 Moderate 3 unhealthy d/yr today · 5 by 30 yrs out
Nearby sold comps map
Loading sold comps map…
Walkable amenities ~0.75 mi
Loading nearby amenities…
Taxation est. · year 1
- Rental income
- $18,611
- − Mortgage interest
- −$14,004
- − Property taxes
- −$3,580
- − Insurance
- −$1,250
- − Repairs & maintenance
- −$1,489
- − Management
- −$1,489
- − Depreciation
- −$7,273
- Taxable loss
- −$10,473
- Est. tax savings @ 24.0%
- +$2,514
- After-tax cash flow
- $-3,346/yr
For passive investors: Depreciation is non-cash, so a rental often shows a tax loss while cash-flowing — sheltering income. Rental losses are passive: they offset passive income freely, and up to $25,000/yr can offset ordinary (W-2) income if you actively participate and your MAGI is under $100k (phasing out to $0 by $150k); unused losses carry forward. On sale, claimed depreciation is recaptured at up to 25%, and gains may owe capital-gains tax (a 1031 exchange can defer both). Figures are a year-1 estimate at your 24.0% rate — not tax advice; consult a CPA.
Schools (NCES district)
- District
- Willoughby-Eastlake City
- NCES district ID
- 3904510
- Math proficiency
- 42% ▼ -21.00%
- Reading proficiency
- 58% ▼ -11.00%
- Median HH income
- $52,500
- Composite
- 42.96/100
- National rank
- #3110
- State rank
- #434 of 656 in OH
Livability — Willoughby
- Score
- 75/100
- State rank
- #249
- US rank
- #3972
Category grades
Schools grade is shown separately in the Schools card above.
Census & demographics
- Census place
- Willoughby, OH
- County
- Lake County · 204,927 people
- City population
- 36,873
- Metro
- Cleveland-Elyria, OH
- Population (ZIP)
- 36,873
- Household income
- $78,772
- Rent vs Own
- Severe rent burden
- 1381.0
Population outlook (Lake County) Hauer SSP2
- Today (2025)
- 230,022 people
- By 2030
- 228,151 · -0.8%
- By 2040
- 221,018 · -3.9%
- By 2050
- 212,754 · -7.5%
- By 2075
- 200,309 · -12.9%
- By 2100
- 183,315 · -20.3%
Race, ethnicity, and origin ACS 2023
- Neighborhood character
- Predominantly White (86%)
- Race & ethnicity
- White 86% Black 7% Two or more races 4% Hispanic / Latino 2% Asian 2%
- Common ancestry
- Romanian 7% Lithuanian 2% Slovak 2%
- Foreign-born
- 7% · Canada, China
- Languages at home
- 92% English-only · Russian/Polish/Slavic 3% Other Indo-European 1% German/W. Germanic 1%
Political lean MEDSL · Lake
- 2024 margin
- R (+14.3) · D 42.4% · R 56.7%
- 2008→2024 swing
- -15.2pp toward R · 2008: 0.8pp · 2024: -14.3pp
- All cycles
- 2024: R+14.3 2020: R+13.6 2016: R+15.6 2012: R+1.7 2008: D+0.8
Not yet ingested
- Civics
- —
Market trends
- HPI YoY
- ▼ -229.28%
- Current HPI
- 179.81
- Rent YoY
- ▲ 4.01%
- Metro
- Cleveland-Elyria, OH
- State GDP YoY
- ▲ 1.98%
- F500 in state
- 48
Industry mix (Fortune 500 HQ in OH)
| Industry | F500 HQs | Revenue |
|---|---|---|
| Insurance | 3 | $145B |
|
||
| Industrial Machinery | 3 | $49B |
|
||
| Financial Services | 3 | $24B |
|
||
| Consumer Goods | 2 | $93B |
|
||
| Aerospace / Defense | 2 | $47B |
|
||
| Utilities | 2 | $33B |
|
||
Price history
+367.3% since first listed16 events — show timeline
- 2026-06-12 Price Changed $250,000 MLSNOW
- 2026-06-12 Relisted — MLSNOW
- 2026-06-04 Pending — MLSNOW
- 2026-05-20 Price Changed $279,900 MLSNOW
- 2026-05-01 Price Changed $299,900 MLSNOW
- 2026-04-24 Listed $325,000 MLSNOW
- 2001-07-31 Sold (Public Records) $152,500 Public Records
- 2000-01-30 Listing Removed — MLSNOW
- 1999-10-02 Listed $149,990 MLSNOW
- 1997-02-03 Sold (Public Records) $127,500 Public Records
- 1996-06-09 Listing Removed — MLSNOW
- 1995-12-11 Listed $129,900 MLSNOW
- 1994-11-30 Listing Removed — MLSNOW
- 1994-06-03 Listed $129,900 MLSNOW
- 1990-03-20 Sold (Public Records) $80,500 Public Records
- 1988-12-15 Sold (Public Records) $53,500 Public Records
Property tax history
+3.0%/yrLatest (2025): $3,580 · -15.8% YoY. Source: county tax records.
Cash-flow waterfall
monthlySold comps — $/sqft
last 12 mo · ≤1 miLoading sold comps…