 🏗️ New Construction
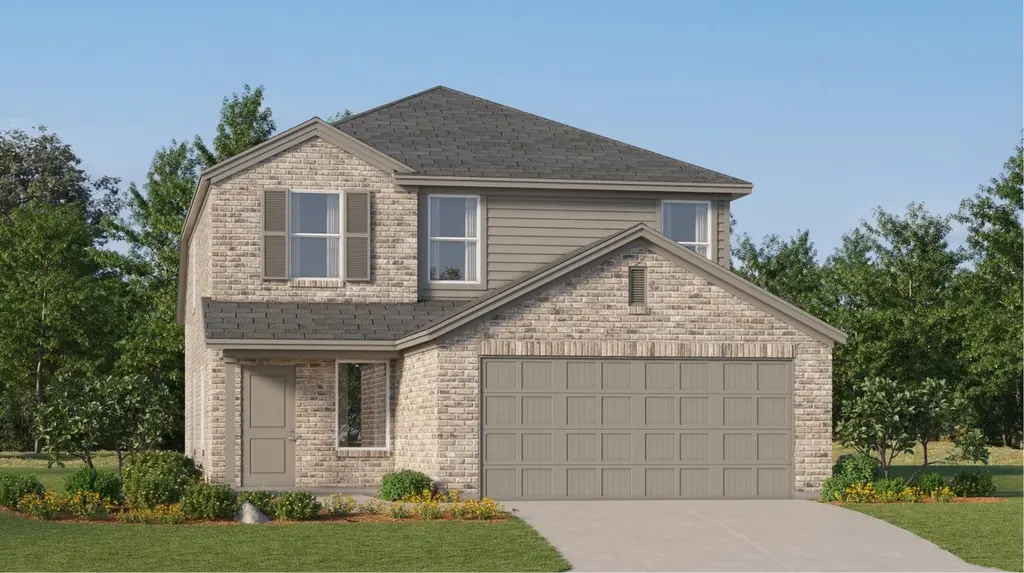
Morrow Plan · Houston, TX
Flood risk No data
- FEMA flood zone
- —
- Chance of flooding over 30 yrs
- —
- Est. flood insurance / yr
- —
Fire risk No data
- Est. fire insurance / yr
- —
Heat risk No data
- Hot days now (above threshold)
- —
- Hot days in 30 yrs
- —
Wind risk No data
- Chance of severe wind over 30 yrs
- —
Air-quality risk No data
- Unhealthy air days now
- —
- Unhealthy air days in 30 yrs
- —
Risk factors via First Street. Map © Google.
Why this score? — see what drove the F grade
The composite is a weighted blend of 9 inputs, each scored 0–100. Each bar is that input's sub-score; the figure is the points it added to the 100-point composite (weight × sub-score).
- Cash flow +8.5/30.0
- ARV discount +7.5/15.0
- Livability +3.7/5.0
- Schools +2.9/10.0
- 1% rule +2.6/10.0
- Condition / age +2.5/5.0
- DSCR +2.3/10.0
- Rent growth +2.1/5.0
- Appreciation +0.0/10.0
$280,990
🖨 Deal sheet (PDF) 📄 Offer letter ✓ Due diligence
Listing remarks MLS
This new two-story home boasts a spacious and modern design. On the first floor, a flexible open-concept floorplan combines the kitchen, living and dining areas, and the luxurious owner's suite is tucked into a private rear corner with a spa-inspired bathroom and walk-in closet. On the second floor, three secondary bedrooms surround a versatile loft for convenient shared living.
Key facts
- Walk-in closet
- Versatile loft
- 2 garage spots
Tags
Neighborhood map
What this means for you Summary
Snapshot
- This is a 4-bed/2.5-bath single-family listed at $281k.
Deal economics
- At list price, monthly cash flow is $-277 ($-3k/yr) — negative.
- To cash-flow at today's rent, offer at most $273k (2.7% below list).
- To meet the 1% rule (rent ≥ 1% of price), the offer needs to be $239k (14.9% below list).
- Recommended offer: $239k (14.9% below list) — sets the bar for 1% rule.
- Cap rate 5.2% vs local median 3.1% in Houston — top-decile yield for the area; either an underpriced asset or a hidden risk that comps aren't pricing in. Stress-test before assuming the spread holds.
Location & tenants
- Location reads 74/100 on livability (#184 in TX, #4,771 nationally) — a middle-class / working-renter tenant base. Strengths: amenities A+, cost of living A+, housing A+; Watch: crime F.
- Waller ISD (rural): math 30% / reading 35% proficiency, ranked #532 of 826 in TX (top 64%) — families likely to look elsewhere, expect single-tenant / working-renter base with shorter leases.
- Zoned schools: I T Holleman El (math 33% / reading 31%, grade F, #2,268 of 4,322 statewide, top 55%, 688 students, 70% FRL); Waller J H (math 21% / reading 28%, grade F, #1,279 of 1,662 statewide, top 78%, 899 students, 69% FRL); Waller H S (math 25% / reading 40%, grade F, #1,029 of 1,632 statewide, top 64%, 2,639 students, 62% FRL).
- Market conditions: Rents soft (-1.6%/yr); 1791 active listings in the ZIP; 3 comparable units currently listed for rent nearby; rentals lingering (median 46d on market — plan ~5-8 weeks vacancy on turnover, expect pricing pressure); 67% of comp listings sitting > 30 days — soft ceiling on asking rent; high-income renter base; 29,883 units permitted in Harris County in 2024 (8,621 in 5+ unit buildings).
Forward outlook
- Local home prices are declining (-3.0%/yr); year-one equity from $2k of loan paydown is wiped out by about $9k of value loss. Plan a longer hold.
- Harris County population projected at +47% by 2050 — long-run rental-demand tailwind backs the buy-and-hold thesis.
Negotiation context
- It's been on market 353 days — a 12% lower offer ($247k) is reasonable based on typical stale-listing flexibility.
Questions for the listing agent
- What do current leases actually rent for vs. the listed asking? Can we see a recent rent roll and the last 12 months of T-12 income?
- It's been on market 353 days. Have you received any prior offers? Is the seller open to a 15% concession, seller financing, or rate buy-down credit?
- Why hasn't it sold? Are there any deal-killer items the seller is aware of (foundation, flood, title, zoning, code violations)?
- Is there a deadline driving the sale (1031 exchange, divorce, estate, relocation)? That informs how much negotiation room exists.
- Schools are D-rated, which usually means shorter tenancies and higher turnover. Who's the typical renter profile here, and what's been the actual vacancy rate?
- Crime grade is F in this area — have there been break-ins, vandalism, or insurance claims at this property in the last 3 years? What carrier currently insures it and at what premium?
- The area grade is low — what's the realistic commute time and amenity access for the typical tenant pool here? Any planned neighborhood developments (good or bad) we should know about?
- What's the average days-on-market for RENTAL listings here right now (not sales)? A rising rental-DOM trend means longer vacancies and softer asking-rent achievability than the comps imply.
- What's the recent tenant-quality profile in this submarket — average credit score on applications, eviction rate, late-payment / NSF rate, and stable-employment percentage? A property-management company in the area should have these aggregated.
- How much new for-sale + rental construction is in the pipeline within 1–3 miles? Heavy new supply typically softens prices + rents 12–24 months out; constrained supply supports both.
Investment metrics
- 1% rule
- 0.76% ✗
- Cap rate
- 5.23%
- Cash-on-cash
- -3.79%
- DSCR
- 0.83
- GRM
- 10.9
CMA / ARV
- ARV (median comp)
- $313,589
- List price
- $280,990
- Delta
- -10.40%
- Verdict
- UNDERPRICED
- Comps
- 20 within 1.0 mi
Show comp detail 12 sales within ~0.75 mi
| Address | Dist | Beds/Ba | Sqft | Sold | Price | $/sf | Match |
|---|---|---|---|---|---|---|---|
| 27242 Wheat Falls Ln | 0.01mi | 3/2.0 (-1) | 1,908 (-2%) | 0mo | $281,640 | $148 | 89 |
| 29067 Bison Haven Dr | 0.01mi | 4/2.5 | 2,083 (+7%) | 0mo | $305,290 | $147 | 88 |
| 28807 Golden Wheat Ct | 0.36mi | 4/2.0 | 1,924 (-1%) | 1mo | $259,990 | $135 | 78 |
| 16847 Spotted Oak Dr | 0.31mi | 4/2.0 | 2,066 (+6%) | 0mo | $259,440 | $126 | 74 |
| 16839 Old Wagon Way | 0.32mi | 4/2.0 | 2,066 (+6%) | 1mo | $234,990 | $114 | 73 |
| 28911 Rustic Robin Ln | 0.31mi | 3/2.0 (-1) | 1,880 (-4%) | 0mo | $298,990 | $159 | 72 |
| 28534 Golden Hay Dr | 0.34mi | 4/2.0 | 2,066 (+6%) | 0mo | $248,000 | $120 | 72 |
| 28803 Golden Wheat Ct | 0.36mi | 4/2.0 | 1,776 (-9%) | 1mo | $275,440 | $155 | 66 |
| 16122 Domestic Dove Way | 0.46mi | 4/2.0 | 1,776 (-9%) | 0mo | $250,990 | $141 | 61 |
| 16850 Old Wagon Way | 0.35mi | 4/2.0 | 1,670 (-14%) | 1mo | $286,990 | $172 | 57 |
| 28518 Golden Hay Dr | 0.35mi | 4/2.0 | 1,670 (-14%) | 1mo | $241,140 | $144 | 57 |
| 16311 Golden Corral Dr | 0.50mi | 3/2.5 (-1) | 1,749 (-10%) | 1mo | $326,990 | $187 | 54 |
Match score weights: distance 35% · size 25% · config 20% · recency 20%. Top-matched comps best support the ARV.
Projected returns pro-forma
-3.0% appreciation · 0.0% rent growth · sell at horizon
- IRR
- -26.1%
- Equity multiple
- 0.14×
- Total profit
- $-75,452
- Equity at exit
- $46,757
- IRR
- -36.8%
- Equity multiple
- -0.31×
- Total profit
- $-115,392
- Equity at exit
- $27,113
Cash invested: $87,805 (down + closing). Projections, not guarantees.
Landlord ↔ Tenant lean methodology
- Overall (STATE)
- 87 Strongly Landlord-Friendly
- State Texas
- 87 Strongly Landlord-Friendly · R+5
- County
- — inherits STATE
- City
- — inherits STATE
ZIP-level market 77447
- Home prices YoY
- -31.1%
- Rents YoY
- -1.6%
- Active inventory
- 1791
- Price-to-rent
- 9.8×
Monthly cashflow live
- Estimated rent
- $2,392 medium interval (Pro) →
- Mortgage (P&I)
- −$1,644
- Tax est. 1.5%
- −$392 /mo · $4,704/yr
- Insurance
- −$131
- HOA
- −$0
- Vacancy / Maint / Mgmt
- −$502
- Net cashflow
- $-277
Break-even live
Sensitivity live
| Price | -10% $-61 | -5% $-169 | +0% $-277 | +5% $-386 | +10% $-494 |
|---|---|---|---|---|---|
| Rent | -10% $-466 | -5% $-372 | +0% $-277 | +5% $-183 | +10% $-88 |
| Rate | -1.0pp $-119 | -0.5pp $-198 | base $-277 | +0.5pp $-359 | +1.0pp $-441 |
UW: 25.0% down · 7.5% · 30yr · 1.5% tax · 5.0% vac · 8.0% maint · 8.0% mgmt
Financing live
Cash to close
- Down payment
- $78,397
- Closing costs
- $9,408
- Reserves months
- —
- Total cash needed
- —
Loan-product check · same deal, 3 products live
Conventional
25% down · 7.5% · 30yr
- Down + closing
- —
- Monthly P&I
- —
- Monthly cashflow
- —
- DSCR
- —
- Eligible?
- —
Personal DTI + credit; lowest rate.
DSCR
20% down · 8.5% · 30yr
- Down + closing
- —
- Monthly P&I
- —
- Monthly cashflow
- —
- DSCR
- —
- Eligible?
- —
No personal income docs; deal must DSCR.
Hard money
10% down · 12.0% · 12mo
- Down + closing
- —
- Monthly P&I
- —
- Monthly cashflow
- —
- DSCR
- —
- Eligible?
- —
Short-term bridge; refi at stabilization.
Rent comps 3 comps
| Address | Beds | Baths | Sqft | Rent | $/sqft | DOM | Units | Dist |
|---|---|---|---|---|---|---|---|---|
| 16722 Old Wagon Way Hockley, TX | 4.0 | 2.0 | 1880 | $1,790 | $0.95 | 45d | 1 | 0.23mi |
| 16315 Mesquite Field Dr Hockley, TX | 4.0 | 2.0 | 1500 | $2,600 | $1.73 | 45d | 1 | 0.36mi |
| 29023 Pearl Barley Way Unit 3656 Hockley, TX | 4.0 | 2.5 | 2395 | $2,300 | $0.96 | 26d | 1 | 0.37mi |
Listing history 17 events
-
2026-06-21pricedays on market $280,990 Active 353 DOM
-
2026-06-18price $281,990 Active 350 DOM
-
2026-06-18days on market $286,990 Active 350 DOM
-
2026-06-18price $286,990 Active 349 DOM
-
2026-06-17days on market $300,990 Active 349 DOM
-
2026-06-16days on market $300,990 Active 348 DOM
-
2026-06-15days on market $300,990 Active 347 DOM
-
2026-06-13days on market $300,990 Active 345 DOM
-
2026-06-09days on market $300,990 Active 341 DOM
-
2026-06-08days on market $300,990 Active 340 DOM
-
2026-06-07days on market $300,990 Active 339 DOM
-
2026-06-04days on market $300,990 Active 336 DOM
-
2026-06-03days on market $300,990 Active 335 DOM
-
2026-06-02days on market $300,990 Active 334 DOM
-
2026-06-01days on market $300,990 Active 333 DOM
-
2026-05-31days on market $300,990 Active 332 DOM
-
2025-07-03$300,990 Active 381-char remark
Show marketing remark (381 chars)
This new two-story home boasts a spacious and modern design. On the first floor, a flexible open-concept floorplan combines the kitchen, living and dining areas, and the luxurious owner's suite is tucked into a private rear corner with a spa-inspired bathroom and walk-in closet. On the second floor, three secondary bedrooms surround a versatile loft for convenient shared living.
ⓘ Source: listings_history table (triggers on properties + properties_extension) + one-shot
backfill from property_details.listing_events for pre-trigger history.
Nearby sold comps map
Loading sold comps map…
Walkable amenities ~0.75 mi
Loading nearby amenities…
Taxation est. · year 1
- Rental income
- $28,706
- − Mortgage interest
- −$17,566
- − Property taxes
- −$4,704
- − Insurance
- −$1,568
- − Repairs & maintenance
- −$2,296
- − Management
- −$2,296
- − Depreciation
- −$9,123
- Taxable loss
- −$8,847
- Est. tax savings @ 24.0%
- +$2,123
- After-tax cash flow
- $-1,205/yr
For passive investors: Depreciation is non-cash, so a rental often shows a tax loss while cash-flowing — sheltering income. Rental losses are passive: they offset passive income freely, and up to $25,000/yr can offset ordinary (W-2) income if you actively participate and your MAGI is under $100k (phasing out to $0 by $150k); unused losses carry forward. On sale, claimed depreciation is recaptured at up to 25%, and gains may owe capital-gains tax (a 1031 exchange can defer both). Figures are a year-1 estimate at your 24.0% rate — not tax advice; consult a CPA.
Schools (NCES district)
- District
- Waller ISD
- NCES district ID
- 4844430
- Math proficiency
- 30% ▼ -23.00%
- Reading proficiency
- 35% ▼ -11.00%
- Median HH income
- $58,911
- Composite
- 29.12/100
- National rank
- #6593
- State rank
- #532 of 826 in TX
Livability — Houston
- Score
- 74/100
- State rank
- #184
- US rank
- #4771
Category grades
Schools grade is shown separately in the Schools card above.
Census & demographics
- County
- Harris County · 4,702,590 people
- City population
- 3,226,434
- Metro
- Houston-The Woodlands-Sugar Land, TX
- Population (ZIP)
- 25,231
- Household income
- $116,925
- Rent vs Own
- Severe rent burden
- 265.0
Population outlook (Harris County) Hauer SSP2
- Today (2025)
- 5,571,493 people
- By 2030
- 6,089,821 · +9.3%
- By 2040
- 7,142,806 · +28.2%
- By 2050
- 8,185,864 · +46.9%
- By 2075
- 10,574,329 · +89.8%
- By 2100
- 12,109,958 · +117.4%
Race, ethnicity, and origin ACS 2023
- Neighborhood character
- Diverse neighborhood (Simpson 0.63)
- Race & ethnicity
- White 44% Hispanic / Latino 41% Two or more races 16% Black 9% Asian 1%
- Hispanic origin (detail)
- Mexican 27%
- Common ancestry
- Lithuanian 3% Slovak 1% Romanian 1%
- Foreign-born
- 15% · Canada, Jamaica, Dominican Republic
- Languages at home
- 69% English-only · Spanish 28% Other Indo-European 1% Vietnamese 1%
Political lean MEDSL · Harris
- 2024 margin
- Lean D (+5.5) · D 52.0% · R 46.4% · Other 1.6%
- 2008→2024 swing
- +3.9pp toward D · 2008: 1.6pp · 2024: 5.5pp
- All cycles
- 2024: D+5.5 2020: D+13.3 2016: D+12.4 2012: D+0.1 2008: D+1.6
Not yet ingested
- Civics
- —
Market trends
- HPI YoY
- ▼ -112.73%
- Current HPI
- 249.6969
- Rent YoY
- ▼ -1.58%
- Metro
- Houston-The Woodlands-Sugar Land, TX
- State GDP YoY
- ▲ 3.95%
- F500 in state
- 110
Industry mix (Fortune 500 HQ in TX)
| Industry | F500 HQs | Revenue |
|---|---|---|
| Energy | 16 | $1,198B |
|
||
| Technology | 5 | $198B |
|
||
| Engineering / Construction | 4 | $72B |
|
||
| Energy Services | 3 | $60B |
|
||
| Utilities | 3 | $41B |
|
||
| Healthcare | 2 | $330B |
|
||
Price history
1 event — show timeline
- 2025-07-03 Listed $300,990 Zillow
Cash-flow waterfall
monthlySold comps — $/sqft
last 12 mo · ≤1 miLoading sold comps…