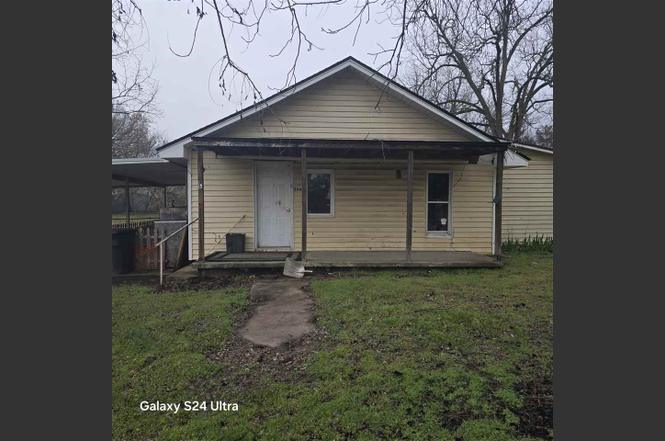
204 N Asp St · Ripley, OK
Flood risk 1/10 · Minimal
- FEMA flood zone
- X (unshaded)
- Chance of flooding over 30 yrs
- 0.0%
- Est. flood insurance / yr
- $507 – $1,088
Fire risk 5/10 · Moderate
- Est. fire insurance / yr
- $2,463 – $4,575
Heat risk 6/10 · Moderate
- Hot days now (above 109°F)
- 7 days/yr
- Hot days in 30 yrs
- 18 days/yr
Wind risk 3/10 · Minor
- Chance of severe wind over 30 yrs
- 4.0%
Air-quality risk 2/10 · Minimal
- Unhealthy air days now
- 1 days/yr
- Unhealthy air days in 30 yrs
- 1 days/yr
Risk factors via First Street. Map © Google.
Why this score? — see what drove the B+ grade
The composite is a weighted blend of 9 inputs, each scored 0–100. Each bar is that input's sub-score; the figure is the points it added to the 100-point composite (weight × sub-score).
- Cash flow +30.0/30.0
- 1% rule +10.0/10.0
- DSCR +10.0/10.0
- Appreciation +9.5/10.0
- ARV discount +7.5/15.0
- Livability +3.2/5.0
- Rent growth +2.5/5.0
- Condition / age +2.5/5.0
- Schools +1.8/10.0
$25,000
🖨 Deal sheet 📄 Offer letter ✓ Due diligence
Listing remarks
Cash only. Investment opportunity on six full lots. This property features a home in need of a full renovation or complete gut, offering a blank slate for your next project. The structure provides existing utility connections and layout, but significant repairs and updates are required throughout. With six spacious lots, the site offers ample room for expansion, new construction, additional outbuildings, or future development. Mature trees and open space provide privacy and flexibility for a variety of uses. Ideal for investors, builders, or buyers seeking a large parcel with strong potential. Property is being sold as-is, and all inspections or due diligence are the responsibility of the b
Key facts
- Open space
- Full renovation
- Six full lots
Tags
Property features AI
Exterior
- Utilities: Public water; Shared septic; Natural gas available
- Home design: Single-family residential property
- Exterior features: Composition roof; Lot approximately 0.48 acres (140 x 150); Located in the Original Townsite subdivision
Interior
- Bathrooms: One full bathroom
- Interior features: 1 full bathroom
Neighborhood map
What this means for you Summary
Snapshot
- This is a 1-bed/1.0-bath single-family listed at $25k.
Deal economics
- At list price, monthly cash flow is $487 ($6k/yr) — positive.
- The deal already cash-flows at list — no discount required.
- Meets the 1% rule at list price ($835 rent vs $25k).
- Recommended offer: $24k (6.0% below list) — sets the bar for market timing.
Location & tenants
- Location reads 63/100 on livability (#234 in OK) — a middle-class / working-renter tenant base. Strengths: cost of living A+, housing A+; Watch: schools F, crime F, amenities F.
- Ripley (rural): math 18% / reading 23% proficiency, ranked #159 of 270 in OK (top 59%) — low school quality limits family demand, transient renter base, plan for 1-2y turnover; 63% free/reduced lunch — lower-income household profile, screen leases tightly.
- Market conditions: 9 active listings in the ZIP; 182 units permitted in Payne County in 2024 (12 in 5+ unit buildings).
Forward outlook
- In year one you build about $2k of equity ($173 loan paydown + $2k appreciation (8.9% local appreciation)).
- Payne County population projected at +30% by 2050 — long-run rental-demand tailwind backs the buy-and-hold thesis.
- At projected returns (8.9% appreciation + 3.0% rent growth), your $7k cash investment doubles in ~1 year — after that, you're playing with house money.
Negotiation context
- It's been on market 74 days — a 6% lower offer ($24k) is reasonable based on typical stale-listing flexibility.
Risks & watch-outs
- Watch-outs: built in 1900 — expect roof / HVAC / electrical / plumbing capex.
- Climate carrying-cost: moderate wildfire risk; extreme-heat days projected 7→18/yr by 2055 (HVAC capex compounding) — expect insurance premiums to compound above CPI over the hold.
Questions for the listing agent
- It's been on market 74 days. Have you received any prior offers? Is the seller open to a 6% concession, seller financing, or rate buy-down credit?
- Built in 1900 — when were the roof, HVAC, electrical panel, plumbing, and water heater last replaced?
- Why hasn't it sold? Are there any deal-killer items the seller is aware of (foundation, flood, title, zoning, code violations)?
- Is there a deadline driving the sale (1031 exchange, divorce, estate, relocation)? That informs how much negotiation room exists.
- Schools are F-rated, which usually means shorter tenancies and higher turnover. Who's the typical renter profile here, and what's been the actual vacancy rate?
- Crime grade is F in this area — have there been break-ins, vandalism, or insurance claims at this property in the last 3 years? What carrier currently insures it and at what premium?
- What's the average days-on-market for RENTAL listings here right now (not sales)? A rising rental-DOM trend means longer vacancies and softer asking-rent achievability than the comps imply.
- What's the recent tenant-quality profile in this submarket — average credit score on applications, eviction rate, late-payment / NSF rate, and stable-employment percentage? A property-management company in the area should have these aggregated.
- How much new for-sale + rental construction is in the pipeline within 1–3 miles? Heavy new supply typically softens prices + rents 12–24 months out; constrained supply supports both.
Investment metrics
- 1% rule
- 3.34% ✓
- Cap rate
- 29.66%
- Cash-on-cash
- 83.47%
- DSCR
- 4.71
- GRM
- 2.5
CMA / ARV
No comps found within radius.
Projected returns pro-forma
8.94% appreciation · 3.0% rent growth · sell at horizon
- IRR
- 92.3%
- Equity multiple
- 7.12×
- Total profit
- $42,848
- Equity at exit
- $20,618
- IRR
- 87.9%
- Equity multiple
- 15.49×
- Total profit
- $101,463
- Equity at exit
- $42,582
Cash invested: $7,000 (down + closing). Projections, not guarantees.
Landlord ↔ Tenant lean methodology
- Overall (STATE)
- 83 Strongly Landlord-Friendly
- State Oklahoma
- 83 Strongly Landlord-Friendly · R+20
- County
- — inherits STATE
- City
- — inherits STATE
ZIP-level market 74062
- Home prices YoY
- 2.3%
- Active inventory
- 9
- Price-to-rent
- 2.5×
Monthly cashflow live
- Estimated rent
- $835 medium interval (Pro) →
- Mortgage (P&I)
- −$131
- Tax est. 1.5%
- −$31 /mo · $375/yr
- Insurance
- −$10
- HOA
- −$0
- Vacancy / Maint / Mgmt
- −$175
- Net cashflow
- $487
Break-even live
UW: 25.0% down · 7.5% · 30yr · 1.5% tax · 5.0% vac · 8.0% maint · 8.0% mgmt
Financing live
Cash to close
- Down payment
- $6,250
- Closing costs
- $750
- Reserves months
- —
- Total cash needed
- —
Loan-product check · same deal, 3 products live
Conventional
25% down · 7.5% · 30yr
- Down + closing
- —
- Monthly P&I
- —
- Monthly cashflow
- —
- DSCR
- —
- Eligible?
- —
Personal DTI + credit; lowest rate.
DSCR
20% down · 8.5% · 30yr
- Down + closing
- —
- Monthly P&I
- —
- Monthly cashflow
- —
- DSCR
- —
- Eligible?
- —
No personal income docs; deal must DSCR.
Hard money
10% down · 12.0% · 12mo
- Down + closing
- —
- Monthly P&I
- —
- Monthly cashflow
- —
- DSCR
- —
- Eligible?
- —
Short-term bridge; refi at stabilization.
Listing history 4 events
-
2026-05-21status Pending
-
2026-04-12price $25,000
-
2026-04-01price $27,000
-
2026-03-09$30,000 Active
ⓘ Source: listings_history table (triggers on properties + properties_extension) + one-shot
backfill from property_details.listing_events for pre-trigger history.
Climate risk First Street
- Flood 1/10 Low FEMA zone X (unshaded) · 0% chance over 30 yrs
- Wildfire 5/10 Major
- Heat 6/10 Major 7 d/yr ≥109°F today · 18 d/yr by 30 yrs out
- Wind 3/10 Moderate 4% chance of damaging wind over 30 yrs
- Air quality 2/10 Low 1 unhealthy d/yr today · 1 by 30 yrs out
Nearby sold comps map
Loading sold comps map…
Walkable amenities ~0.75 mi
Loading nearby amenities…
Taxation est. · year 1
- Rental income
- $10,020
- − Mortgage interest
- −$1,400
- − Property taxes
- −$375
- − Insurance
- −$125
- − Repairs & maintenance
- −$802
- − Management
- −$802
- − Depreciation
- −$727
- Taxable income
- $5,789
- Est. tax owed @ 24.0%
- −$1,389
- After-tax cash flow
- $4,453/yr
For passive investors: Depreciation is non-cash, so a rental often shows a tax loss while cash-flowing — sheltering income. Rental losses are passive: they offset passive income freely, and up to $25,000/yr can offset ordinary (W-2) income if you actively participate and your MAGI is under $100k (phasing out to $0 by $150k); unused losses carry forward. On sale, claimed depreciation is recaptured at up to 25%, and gains may owe capital-gains tax (a 1031 exchange can defer both). Figures are a year-1 estimate at your 24.0% rate — not tax advice; consult a CPA.
Schools (NCES district)
- District
- Ripley
- NCES district ID
- 4025950
- Math proficiency
- 18% ▼ -6.00%
- Reading proficiency
- 23% ▼ -14.00%
- Median HH income
- $49,717
- Composite
- 18.28/100
- National rank
- #8958
- State rank
- #159 of 270 in OK
Livability — Ripley
- Score
- 63/100
- State rank
- #234
- US rank
- #15997
Category grades
Schools grade is shown separately in the Schools card above.
Census & demographics
- Census place
- Ripley, OK
- Population (ZIP)
- 770
Population outlook (Payne County) Hauer SSP2
- Today (2025)
- 88,499 people
- By 2030
- 93,490 · +5.6%
- By 2040
- 103,326 · +16.8%
- By 2050
- 114,840 · +29.8%
- By 2075
- 150,048 · +69.5%
- By 2100
- 179,424 · +102.7%
Race, ethnicity, and origin ACS 2023
- Neighborhood character
- Predominantly White (78%)
- Race & ethnicity
- White 78% Two or more races 18% Hispanic / Latino 6% Native American 1%
- Hispanic origin (detail)
- Mexican 5%
- Common ancestry
- Slovak 5% Romanian 4% Lithuanian 3%
- Foreign-born
- 1% · Canada
- Languages at home
- 98% English-only · Spanish 2%
Political lean MEDSL · Payne
- 2024 margin
- Strong R (+25.3) · D 36.1% · R 61.4% · Other 2.6%
- 2008→2024 swing
- +1.7pp toward D · 2008: -27.0pp · 2024: -25.3pp
- All cycles
- 2024: R+25.3 2020: R+23.3 2016: R+28.3 2012: R+28.3 2008: R+27.0
Not yet ingested
- Civics
- —
Market trends
- HPI YoY
- ▲ 8.94%
- Current HPI
- 398.4051
- Rent YoY
- —
- Metro
- —
- State GDP YoY
- ▲ 1.55%
- F500 in state
- 6
Industry mix (Fortune 500 HQ in OK)
| Industry | F500 HQs | Revenue |
|---|---|---|
| Energy | 3 | $48B |
|
||
Price history
-16.7% since first listed4 events — show timeline
- 2026-05-21 Pending — SBOR
- 2026-04-12 Price Changed $25,000 SBOR
- 2026-04-01 Price Changed $27,000 SBOR
- 2026-03-09 Listed $30,000 SBOR
Cash-flow waterfall
monthlySold comps — $/sqft
last 12 mo · ≤1 miLoading sold comps…