 Multi-family
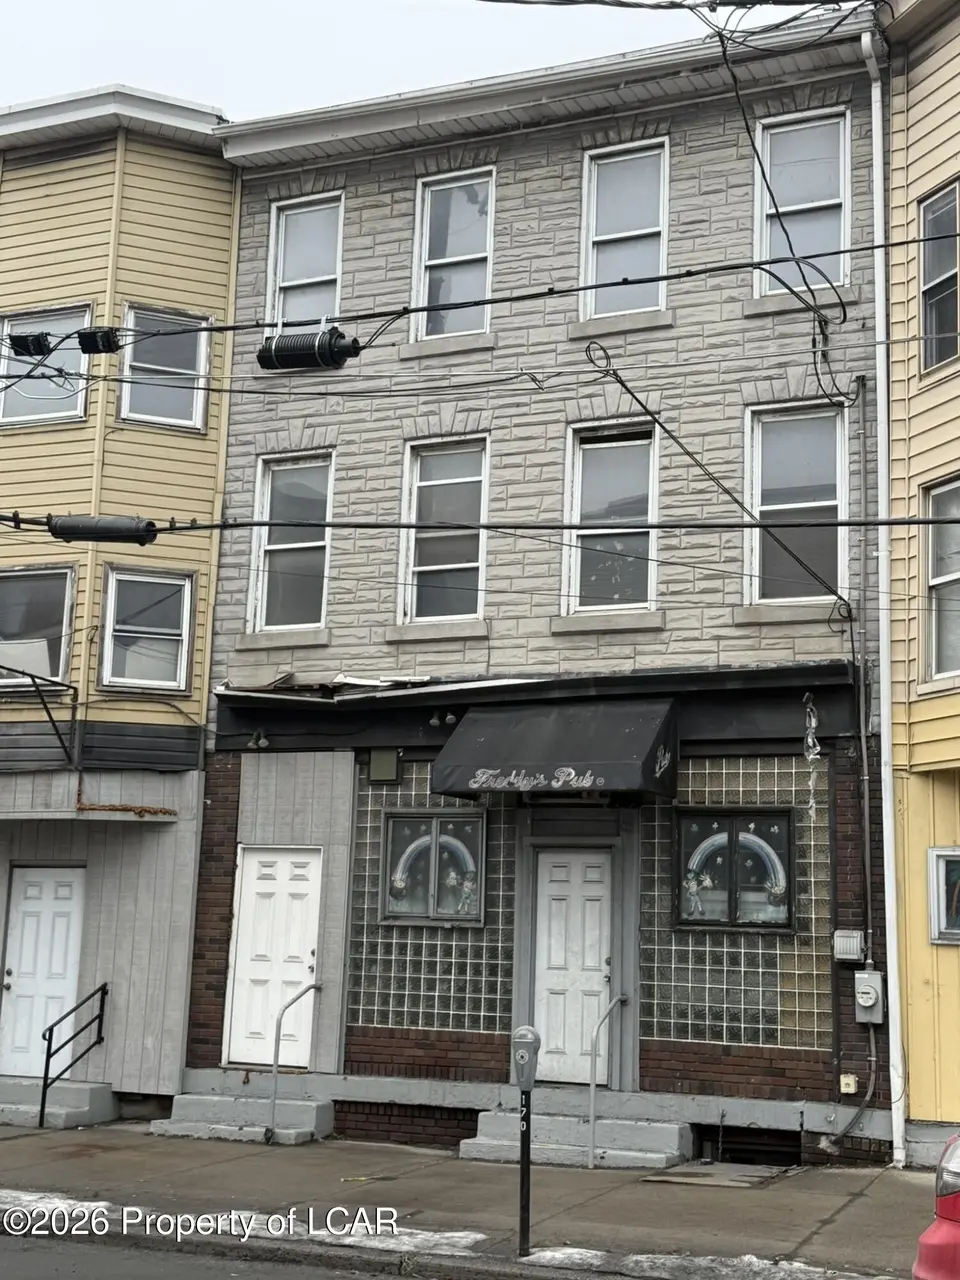
16 Mauch Chunk St · Tamaqua, PA
Flood risk No data
- FEMA flood zone
- —
- Chance of flooding over 30 yrs
- —
- Est. flood insurance / yr
- —
Fire risk No data
- Est. fire insurance / yr
- —
Heat risk No data
- Hot days now (above threshold)
- —
- Hot days in 30 yrs
- —
Wind risk No data
- Chance of severe wind over 30 yrs
- —
Air-quality risk No data
- Unhealthy air days now
- —
- Unhealthy air days in 30 yrs
- —
Risk factors via First Street. Map © Google.
Why this score? — see what drove the B- grade
The composite is a weighted blend of 9 inputs, each scored 0–100. Each bar is that input's sub-score; the figure is the points it added to the 100-point composite (weight × sub-score).
- Cash flow +28.9/30.0
- DSCR +10.0/10.0
- 1% rule +8.0/10.0
- ARV discount +7.5/15.0
- Livability +4.0/5.0
- Schools +3.6/10.0
- Rent growth +2.5/5.0
- Condition / age +1.0/5.0
- Appreciation +0.0/10.0
$99,900
🖨 Deal sheet (PDF) 📄 Offer letter ✓ Due diligence
Multi-family units
County records classify this as Multi-Family (2-4 Unit). Listing-text estimate: 1 unit. estimate disagrees with records
Listing remarks MLS
Commercial zoned building ready for a full renovation at the high-traffic 5-points intersection of Routes 209 & 309 in Tamaqua. Zoned GC with many commercial uses allowed. Features a commercial space previously used as a bar plus potential for apartments with zoning approval. Strong visibility, downtown location, and close to shops, dining, and local amenities including the Tamaqua Train Station.
Key facts
- Commercial space
- Full renovation
- Zoned gc
Tags
Neighborhood map
What this means for you Summary
Snapshot
- This is a 2-bed/2.0-bath multifamily listed at $100k. Condition is rated poor.
Deal economics
- At list price, monthly cash flow is $338 ($4k/yr) — positive.
- The deal already cash-flows at list — no discount required.
- Meets the 1% rule at list price ($1k rent vs $100k).
- Recommended offer: $94k (6.0% below list) — sets the bar for market timing.
- Cap rate 10.4% vs local median 6.8% in Tamaqua — top-decile yield for the area; either an underpriced asset or a hidden risk that comps aren't pricing in. Stress-test before assuming the spread holds.
Location & tenants
- Location reads 80/100 on livability (#209 in PA, #1,844 nationally) — a professional / high-income tenant draw. Strengths: amenities A+, cost of living A+, housing A+; Watch: commute D+, employment F.
- Tamaqua Area SD (rural): math 31% / reading 53% proficiency, ranked #331 of 539 in PA (top 61%) — families likely to look elsewhere, expect single-tenant / working-renter base with shorter leases.
- Market conditions: 75 active listings in the ZIP; 169 units permitted in Schuylkill County in 2024 (0 in 5+ unit buildings).
Forward outlook
- Local home prices are declining (-3.0%/yr); year-one equity from $691 of loan paydown is wiped out by about $3k of value loss. Plan a longer hold.
- Schuylkill County population projected at -16% by 2050 — secular population decline; favor cash flow + early exit over multi-decade hold.
- At projected returns (-3.0% appreciation + 3.0% rent growth), your $28k cash investment doubles in ~9 years — after that, you're playing with house money.
Negotiation context
- It's been on market 70 days — a 6% lower offer ($94k) is reasonable based on typical stale-listing flexibility.
Questions for the listing agent
- It's been on market 70 days. Have you received any prior offers? Is the seller open to a 6% concession, seller financing, or rate buy-down credit?
- Have any recent inspections been done? Can we get a copy of the seller's disclosures and any deferred-maintenance estimates?
- Why hasn't it sold? Are there any deal-killer items the seller is aware of (foundation, flood, title, zoning, code violations)?
- Is there a deadline driving the sale (1031 exchange, divorce, estate, relocation)? That informs how much negotiation room exists.
- What's the average days-on-market for RENTAL listings here right now (not sales)? A rising rental-DOM trend means longer vacancies and softer asking-rent achievability than the comps imply.
- What's the recent tenant-quality profile in this submarket — average credit score on applications, eviction rate, late-payment / NSF rate, and stable-employment percentage? A property-management company in the area should have these aggregated.
- How much new apartment / multifamily construction is in the pipeline within 1–3 miles? Heavy new supply (>2% of stock underway) typically softens rents 12–24 months out; light construction supports rent growth.
Investment metrics
- 1% rule
- 1.30% ✓
- Cap rate
- 10.36%
- Cash-on-cash
- 14.51%
- DSCR
- 1.65
- GRM
- 6.4
CMA / ARV
- ARV (median comp)
- $214,451
- List price
- $99,900
- Delta
- -53.42%
- Verdict
- UNDERPRICED
- Comps
- 14 within 1.0 mi
Projected returns pro-forma
-3.0% appreciation · 3.0% rent growth · sell at horizon
- IRR
- 5.0%
- Equity multiple
- 1.19×
- Total profit
- $5,377
- Equity at exit
- $14,895
- IRR
- 14.4%
- Equity multiple
- 2.16×
- Total profit
- $32,505
- Equity at exit
- $8,638
Cash invested: $27,972 (down + closing). Projections, not guarantees.
Landlord ↔ Tenant lean methodology
- Overall (STATE)
- 62 Landlord-Friendly
- State Pennsylvania
- 62 Landlord-Friendly · EVEN
- County
- — inherits STATE
- City
- — inherits STATE
ZIP-level market 18252
- Home prices YoY
- -15.4%
- Active inventory
- 75
- Price-to-rent
- 6.4×
Monthly cashflow live
- Estimated rent
- $1,302 medium interval (Pro) →
- Mortgage (P&I)
- −$524
- Tax est. 1.5%
- −$125 /mo · $1,498/yr
- Insurance
- −$42
- HOA
- −$0
- Vacancy / Maint / Mgmt
- −$273
- Net cashflow
- $338
Break-even live
Sensitivity live
| Price | -10% $407 | -5% $373 | +0% $338 | +5% $304 | +10% $269 |
|---|---|---|---|---|---|
| Rent | -10% $235 | -5% $287 | +0% $338 | +5% $390 | +10% $441 |
| Rate | -1.0pp $389 | -0.5pp $364 | base $338 | +0.5pp $312 | +1.0pp $286 |
UW: 25.0% down · 7.5% · 30yr · 1.5% tax · 5.0% vac · 8.0% maint · 8.0% mgmt
Financing live
Cash to close
- Down payment
- $24,975
- Closing costs
- $2,997
- Reserves months
- —
- Total cash needed
- —
Loan-product check · same deal, 3 products live
Conventional
25% down · 7.5% · 30yr
- Down + closing
- —
- Monthly P&I
- —
- Monthly cashflow
- —
- DSCR
- —
- Eligible?
- —
Personal DTI + credit; lowest rate.
DSCR
20% down · 8.5% · 30yr
- Down + closing
- —
- Monthly P&I
- —
- Monthly cashflow
- —
- DSCR
- —
- Eligible?
- —
No personal income docs; deal must DSCR.
Hard money
10% down · 12.0% · 12mo
- Down + closing
- —
- Monthly P&I
- —
- Monthly cashflow
- —
- DSCR
- —
- Eligible?
- —
Short-term bridge; refi at stabilization.
Listing history 15 events
-
2026-06-18days on market $99,900 Active 70 DOM
-
2026-06-17days on market $99,900 Active 69 DOM
-
2026-06-16days on market $99,900 Active 68 DOM
-
2026-06-15days on market $99,900 Active 67 DOM
-
2026-06-13days on market $99,900 Active 65 DOM
-
2026-06-12days on market $99,900 Active 64 DOM
-
2026-06-09days on market $99,900 Active 61 DOM
-
2026-06-08days on market $99,900 Active 60 DOM
-
2026-06-08days on market $99,900 Active 59 DOM
-
2026-06-07days on market $99,900 Active 58 DOM
-
2026-06-04days on market $99,900 Active 55 DOM
-
2026-06-02days on market $99,900 Active 54 DOM
-
2026-06-01days on market $99,900 Active 53 DOM
-
2026-05-31days on market $99,900 Active 52 DOM
-
2026-04-09$99,900 Active 405-char remark
Show marketing remark (405 chars)
Commercial zoned building ready for a full renovation at the high-traffic 5-points intersection of Routes 209 & 309 in Tamaqua. Zoned GC with many commercial uses allowed. Features a commercial space previously used as a bar plus potential for apartments with zoning approval. Strong visibility, downtown location, and close to shops, dining, and local amenities including the Tamaqua Train Station.
ⓘ Source: listings_history table (triggers on properties + properties_extension) + one-shot
backfill from property_details.listing_events for pre-trigger history.
Nearby sold comps map
Loading sold comps map…
Walkable amenities ~0.75 mi
Loading nearby amenities…
Taxation est. · year 1
- Rental income
- $15,625
- − Mortgage interest
- −$5,596
- − Property taxes
- −$1,498
- − Insurance
- −$500
- − Repairs & maintenance
- −$1,250
- − Management
- −$1,250
- − Depreciation
- −$2,906
- Taxable income
- $2,625
- Est. tax owed @ 24.0%
- −$630
- After-tax cash flow
- $3,429/yr
For passive investors: Depreciation is non-cash, so a rental often shows a tax loss while cash-flowing — sheltering income. Rental losses are passive: they offset passive income freely, and up to $25,000/yr can offset ordinary (W-2) income if you actively participate and your MAGI is under $100k (phasing out to $0 by $150k); unused losses carry forward. On sale, claimed depreciation is recaptured at up to 25%, and gains may owe capital-gains tax (a 1031 exchange can defer both). Figures are a year-1 estimate at your 24.0% rate — not tax advice; consult a CPA.
Condition & rehab AI · 14 photos
This property is in a state of disrepair and requires extensive rehabilitation. The most immediate needs are to address the exposed plumbing, subflooring, and exterior siding, as well as repainting the interior walls. Once these issues are addressed, the property has the potential to be a strong investment opportunity.
Repairs flagged
- Major Exposed plumbing in kitchen — Exposed plumbing indicates potential water damage or structural issues that need to be addressed.
- Major Exposed plumbing in bathrooms — Exposed plumbing indicates potential water damage or structural issues that need to be addressed.
- Major Peeling exterior siding — Peeling siding indicates potential structural issues and a need for repainting or replacement.
- Major Exposed subflooring in multiple rooms — Exposed subflooring indicates potential water damage or structural issues that need to be addressed.
- Major Paint peeling on interior walls — Paint peeling indicates potential structural issues and a need for repainting.
Value-add opportunities
- Resale Painting the exterior siding — Painting the exterior siding will improve the curb appeal and make the property more attractive to potential buyers.
- Both Rehabilitating the plumbing and subflooring — Rehabilitating the plumbing and subflooring will address the underlying issues and improve the structural integrity of the property, making it more attractive to both buyers and renters.
- Resale Repainting the interior walls — Repainting the interior walls will improve the appearance of the property and make it more attractive to potential buyers.
Renovation cost estimate screening
| Repair item | Severity | Est. cost |
|---|---|---|
| Exposed plumbing in kitchen · Exposed plumbing indicates potential water damage or structural issues that need to be addressed. | Major | $15,000–50,000 |
| Exposed plumbing in bathrooms · Exposed plumbing indicates potential water damage or structural issues that need to be addressed. | Major | $15,000–50,000 |
| Peeling exterior siding · Peeling siding indicates potential structural issues and a need for repainting or replacement. | Major | $15,000–50,000 |
| Exposed subflooring in multiple rooms · Exposed subflooring indicates potential water damage or structural issues that need to be addressed. | Major | $15,000–50,000 |
| Paint peeling on interior walls · Paint peeling indicates potential structural issues and a need for repainting. | Major | $15,000–50,000 |
| Total estimated repair cost · 5 items | $75,000–250,000 |
Value-add ROI direction
- Resale Painting the exterior siding — Painting the exterior siding will improve the curb appeal and make the property more attractive to potential buyers. ↑
- Both Rehabilitating the plumbing and subflooring — Rehabilitating the plumbing and subflooring will address the underlying issues and improve the structural integrity of the property, making it more attractive to both buyers and renters. ↑
- Resale Repainting the interior walls — Repainting the interior walls will improve the appearance of the property and make it more attractive to potential buyers. ↑
ⓘ Cost ranges are severity-bucket heuristics (US national rule-of-thumb). Get contractor quotes + a written scope before underwriting a rehab budget.
Schools (NCES district)
- District
- Tamaqua Area SD
- NCES district ID
- 4223220
- Math proficiency
- 31% ▼ -9.00%
- Reading proficiency
- 53% ▼ -8.00%
- Median HH income
- $45,184
- Composite
- 35.61/100
- National rank
- #4893
- State rank
- #331 of 539 in PA
Livability — Tamaqua
- Score
- 80/100
- State rank
- #209
- US rank
- #1844
Category grades
Schools grade is shown separately in the Schools card above.
Census & demographics
- Census place
- Tamaqua, PA
- Population (ZIP)
- 11,065
Population outlook (Schuylkill County) Hauer SSP2
- Today (2025)
- 137,447 people
- By 2030
- 133,121 · -3.1%
- By 2040
- 124,172 · -9.7%
- By 2050
- 115,611 · -15.9%
- By 2075
- 100,796 · -26.7%
- By 2100
- 86,667 · -36.9%
Race, ethnicity, and origin ACS 2023
- Neighborhood character
- Predominantly White (87%)
- Race & ethnicity
- White 87% Hispanic / Latino 9% Two or more races 8%
- Hispanic origin (detail)
- Mexican 3% Puerto Rican 3% Salvadoran 2%
- Common ancestry
- Romanian 11% Iranian 3% Polish 2%
- Foreign-born
- 2% · Canada, Dominican Republic
- Languages at home
- 97% English-only · Spanish 2%
Political lean MEDSL · Schuylkill
- 2024 margin
- Solid R (+42.1) · D 28.5% · R 70.6%
- 2008→2024 swing
- -33.4pp toward R · 2008: -8.7pp · 2024: -42.1pp
- All cycles
- 2024: R+42.1 2020: R+39.9 2016: R+43.4 2012: R+13.4 2008: R+8.7
Not yet ingested
- Civics
- —
Market trends
- HPI YoY
- ▼ -35.53%
- Current HPI
- 194.8976
- Rent YoY
- —
- Metro
- —
- State GDP YoY
- ▲ 1.68%
- F500 in state
- 34
Industry mix (Fortune 500 HQ in PA)
| Industry | F500 HQs | Revenue |
|---|---|---|
| Healthcare | 2 | $309B |
|
||
| Insurance | 2 | $27B |
|
||
| Telecommunications / Media | 1 | $124B |
|
||
| Industrial Distribution | 1 | $22B |
|
||
| Financial Services | 1 | $20B |
|
||
| Chemicals / Materials | 1 | $18B |
|
||
Price history
1 event — show timeline
- 2026-04-09 Listed $99,900 LCAR
Cash-flow waterfall
monthlySold comps — $/sqft
last 12 mo · ≤1 miLoading sold comps…