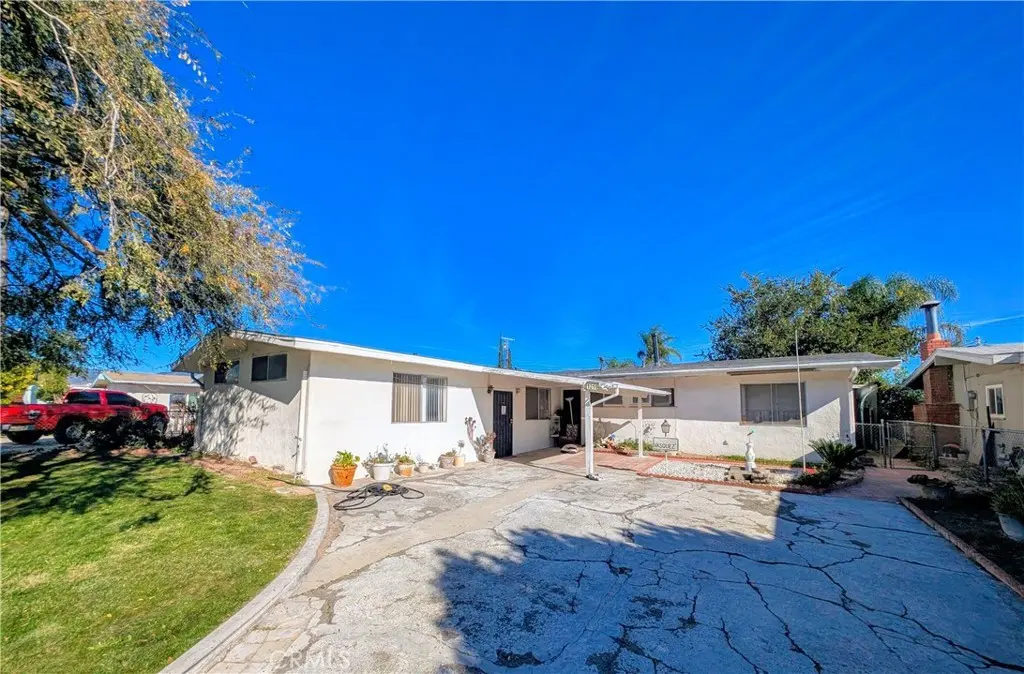
1210 Tejon · Colton, CA
Flood risk 1/10 · Minimal
- FEMA flood zone
- X (unshaded)
- Chance of flooding over 30 yrs
- 0.0%
- Est. flood insurance / yr
- $507 – $1,088
Fire risk 1/10 · Minimal
- Est. fire insurance / yr
- $659 – $1,223
Heat risk 8/10 · Major
- Hot days now (above 102°F)
- 6 days/yr
- Hot days in 30 yrs
- 19 days/yr
Wind risk 1/10 · Minimal
- Chance of severe wind over 30 yrs
- —
Air-quality risk 10/10 · Severe
- Unhealthy air days now
- 25 days/yr
- Unhealthy air days in 30 yrs
- 31 days/yr
Risk factors via First Street. Map © Google.
Why this score? — see what drove the D- grade
The composite is a weighted blend of 9 inputs, each scored 0–100. Each bar is that input's sub-score; the figure is the points it added to the 100-point composite (weight × sub-score).
- ARV discount +15.0/15.0
- Cash flow +8.9/30.0
- Rent growth +3.1/5.0
- Livability +2.8/5.0
- DSCR +2.5/10.0
- Condition / age +2.5/5.0
- Schools +2.4/10.0
- 1% rule +1.5/10.0
- Appreciation +0.0/10.0
$435,580
🖨 Deal sheet (PDF) 📄 Offer letter ✓ Due diligence
Listing remarks MLS
Near Schools, Single Story and Colton Love ready for some upgrades to make it your ideal next home or investment purchase. A short jaunt to Colton Middle School to the east, or an extra block over to the north and west to Paul Rogers Elementary, or a quick jog down to Colton High School the value in location is difficult to defeat. Property lives as a 4 Bedrooms, 2 Bathrooms, with Backyard Views of all three of the major peaks of the Inland Empire-- From San Jacinto, to San Gorgonio/San Bernardino to San Antonio/Mt. Baldy -- Established trees, and a charming citrus tree (Tangerine) to make summer scents and winter fruits to continue this home's proud colton heritage. Alley access and gate can provide extra parking for vehicles, wheeled toys or a future expansion of the living quarters on the parcel. 4th Bedroom added along with breezeway extension to expand the footprint of the property-- we recommend buyer's to verify to own satisfaction. Per Owner- Roof has been replaced 3 years ago Public Images have been edited to remove furniture with 3D tour available to view (link IN MLS) True to Life images are Also Available in Listing
Key facts
- 8,580 sq ft lot
- 4 parking spots
- Built 1954
Neighborhood map
What this means for you Summary
Snapshot
- This is a 3-bed/2.0-bath single-family listed at $436k.
Deal economics
- At list price, monthly cash flow is $-352 ($-4k/yr) — negative.
- To cash-flow at today's rent, offer at most $373k (14.3% below list).
- To meet the 1% rule (rent ≥ 1% of price), the offer needs to be $285k (34.6% below list).
- Recommended offer: $285k (34.6% below list) — sets the bar for 1% rule.
- Cap rate 5.3% vs local median 3.5% in Colton — top-decile yield for the area; either an underpriced asset or a hidden risk that comps aren't pricing in. Stress-test before assuming the spread holds.
Location & tenants
- Location reads 56/100 on livability (#817 in CA) — a working-class tenant base; expect higher turnover. Strengths: housing A+; Watch: employment C-, crime D, amenities F.
- Colton Joint Unified (suburban): math 16% / reading 38% proficiency, ranked #373 of 517 in CA (top 72%) — low school quality limits family demand, transient renter base, plan for 1-2y turnover; 70% free/reduced lunch — lower-income household profile, screen leases tightly.
- Zoned schools: Paul Rogers Elementary (637 students, 92% FRL); Colton Middle (math 11% / reading 32%, grade F, #400 of 498 statewide, top 82%, 835 students, 86% FRL); Colton High (math 18% / reading 46%, grade F, #674 of 1,170 statewide, top 59%, 1,800 students, 83% FRL) — zoned schools average 87% FRL vs 70% district-wide (17 pts higher); higher-poverty schools than district average — tighter screening recommended.
- Market conditions: Rents rising (+2.5%/yr); 105 active listings in the ZIP; 17 comparable units currently listed for rent nearby; rentals at typical pace (median 22d on market — plan ~3-4 weeks tenant-placement turnaround); 5,458 units permitted in San Bernardino County in 2024 (1,500 in 5+ unit buildings).
- At $2,847/mo this rent would consume 48% of the median local household income ($71k/yr) (locally 2195% of renters already pay >50% of income on rent) — very limited rent-growth headroom before tenants either downsize or default.
Forward outlook
- Local home prices are declining (-3.0%/yr); year-one equity from $3k of loan paydown is wiped out by about $13k of value loss. Plan a longer hold.
- San Bernardino County population projected at +15% by 2050 — modest demand growth; plan on rents tracking national, not racing it.
Negotiation context
- It's been on market 125 days — a 12% lower offer ($383k) is reasonable based on typical stale-listing flexibility.
- 2 sale attempts with the ask held roughly flat each time — persistent listings suggest the price (not the market) is what's stuck; bring a comps-based counter.
Risks & watch-outs
- Watch-outs: built in 1954 — expect roof / HVAC / electrical / plumbing capex.
- Climate carrying-cost: extreme-heat days projected 6→19/yr by 2055 (HVAC capex compounding) — expect insurance premiums to compound above CPI over the hold.
Questions for the listing agent
- What do current leases actually rent for vs. the listed asking? Can we see a recent rent roll and the last 12 months of T-12 income?
- It's been on market 125 days. Have you received any prior offers? Is the seller open to a 35% concession, seller financing, or rate buy-down credit?
- Built in 1954 — when were the roof, HVAC, electrical panel, plumbing, and water heater last replaced?
- Why hasn't it sold? Are there any deal-killer items the seller is aware of (foundation, flood, title, zoning, code violations)?
- Is there a deadline driving the sale (1031 exchange, divorce, estate, relocation)? That informs how much negotiation room exists.
- Schools are F-rated, which usually means shorter tenancies and higher turnover. Who's the typical renter profile here, and what's been the actual vacancy rate?
- Crime grade is D in this area — have there been break-ins, vandalism, or insurance claims at this property in the last 3 years? What carrier currently insures it and at what premium?
- The area grade is low — what's the realistic commute time and amenity access for the typical tenant pool here? Any planned neighborhood developments (good or bad) we should know about?
- What's the average days-on-market for RENTAL listings here right now (not sales)? A rising rental-DOM trend means longer vacancies and softer asking-rent achievability than the comps imply.
- What's the recent tenant-quality profile in this submarket — average credit score on applications, eviction rate, late-payment / NSF rate, and stable-employment percentage? A property-management company in the area should have these aggregated.
- How much new for-sale + rental construction is in the pipeline within 1–3 miles? Heavy new supply typically softens prices + rents 12–24 months out; constrained supply supports both.
Investment metrics
- 1% rule
- 0.65% ✗
- Cap rate
- 5.32%
- Cash-on-cash
- -3.46%
- DSCR
- 0.85
- GRM
- 12.8
CMA / ARV
- ARV (median comp)
- $539,385
- List price
- $435,580
- Delta
- -19.25%
- Verdict
- UNDERPRICED
- Comps
- 20 within 1.0 mi
Show comp detail 12 sales within ~0.75 mi
| Address | Dist | Beds/Ba | Sqft | Sold | Price | $/sf | Match |
|---|---|---|---|---|---|---|---|
| 938 W Laurel | 0.17mi | 3/2.0 | 1,598 (+5%) | 1mo | $680,000 | $426 | 82 |
| 1150 N 2nd | 0.25mi | 3/2.0 | 1,637 (+8%) | 1mo | $562,750 | $344 | 75 |
| 951 W C St W | 0.43mi | 3/2.0 | 1,452 (-5%) | 6mo | $522,000 | $360 | 67 |
| 1063 W Long Beach Dr | 0.41mi | 3/2.5 | 1,587 (+4%) | 7mo | $574,450 | $362 | 66 |
| 941 W F St | 0.55mi | 3/1.5 | 1,600 (+5%) | 3mo | $699,000 | $437 | 62 |
| 610 W Olive | 0.29mi | 3/1.5 | 1,744 (+15%) | 1mo | $575,000 | $330 | 59 |
| 1844 Alston Ave | 0.67mi | 4/2.0 (+1) | 1,487 (-2%) | 2mo | $565,000 | $380 | 58 |
| 1075 Leslie Ct | 0.54mi | 3/2.0 | 1,379 (-9%) | 2mo | $600,000 | $435 | 58 |
| 1705 N Jeryl Ave | 0.53mi | 3/2.0 | 1,638 (+8%) | 8mo | $560,000 | $342 | 56 |
| 464 W E St | 0.66mi | 3/2.5 | 1,405 (-8%) | 4mo | $499,999 | $356 | 51 |
| 1666 Bryn Mawr | 0.63mi | 4/2.0 (+1) | 1,366 (-10%) | 7mo | $550,000 | $403 | 42 |
| 743 Roberta Ct | 0.68mi | 4/2.0 (+1) | 1,363 (-10%) | 9mo | $547,500 | $402 | 38 |
Match score weights: distance 35% · size 25% · config 20% · recency 20%. Top-matched comps best support the ARV.
Projected returns pro-forma
-3.0% appreciation · 2.5% rent growth · sell at horizon
- IRR
- -22.6%
- Equity multiple
- 0.22×
- Total profit
- $-94,632
- Equity at exit
- $64,946
- IRR
- -18.2%
- Equity multiple
- 0.03×
- Total profit
- $-117,904
- Equity at exit
- $37,661
Cash invested: $121,962 (down + closing). Projections, not guarantees.
Landlord ↔ Tenant lean methodology
- Overall (STATE)
- 18 Strongly Tenant-Friendly
- State California
- 18 Strongly Tenant-Friendly · D+13
- County
- — inherits STATE
- City
- — inherits STATE
ZIP-level market 92324
- Rents YoY
- 2.5%
- Active inventory
- 105
- Price-to-rent
- 12.8×
Monthly cashflow live
- Estimated rent
- $2,847 high interval (Pro) →
- Mortgage (P&I)
- −$2,284
- Tax from tax record
- −$135 /mo · $1,621/yr
- Insurance
- −$181
- HOA
- −$0
- Vacancy / Maint / Mgmt
- −$598
- Net cashflow
- $-352
Break-even live
Sensitivity live
| Price | -10% $-105 | -5% $-229 | +0% $-352 | +5% $-475 | +10% $-599 |
|---|---|---|---|---|---|
| Rent | -10% $-577 | -5% $-464 | +0% $-352 | +5% $-240 | +10% $-127 |
| Rate | -1.0pp $-133 | -0.5pp $-241 | base $-352 | +0.5pp $-465 | +1.0pp $-580 |
UW: 25.0% down · 7.5% · 30yr · 1.5% tax · 5.0% vac · 8.0% maint · 8.0% mgmt
Financing live
Cash to close
- Down payment
- $108,895
- Closing costs
- $13,067
- Reserves months
- —
- Total cash needed
- —
Loan-product check · same deal, 3 products live
Conventional
25% down · 7.5% · 30yr
- Down + closing
- —
- Monthly P&I
- —
- Monthly cashflow
- —
- DSCR
- —
- Eligible?
- —
Personal DTI + credit; lowest rate.
DSCR
20% down · 8.5% · 30yr
- Down + closing
- —
- Monthly P&I
- —
- Monthly cashflow
- —
- DSCR
- —
- Eligible?
- —
No personal income docs; deal must DSCR.
Hard money
10% down · 12.0% · 12mo
- Down + closing
- —
- Monthly P&I
- —
- Monthly cashflow
- —
- DSCR
- —
- Eligible?
- —
Short-term bridge; refi at stabilization.
Rent comps 17 comps
| Address | Beds | Baths | Sqft | Rent | $/sqft | DOM | Units | Dist |
|---|---|---|---|---|---|---|---|---|
| 943 W C St Colton, CA | 3.0 | 2.0 | 1150 | $3,300 | $2.87 | 20d | 1 | 0.47mi |
| 1327 N Pennsylvania Ave Unit 1327 Colton, CA | 3.0 | 2.0 | 1200 | $2,640 | $2.20 | 26d | 1 | 0.51mi |
| 1417 Pennsylvania Ave Colton, CA | 3.0 | 2.0 | 1300 | $2,395 | $1.84 | 45d | 1 | 0.53mi |
| 535 Jackson St Colton, CA | 4.0 | 3.0 | 1500 | $3,300 | $2.20 | 22d | 1 | 0.67mi |
| 2262 W Mill St San Bernardino, CA | 3.0 | 2.5 | 1696 | $3,300 | $1.95 | 45d | 1 | 0.89mi |
| 404 N 7th St Unit F Colton, CA | 2.0 | 1.0 | 1100 | $2,050 | $1.86 | 26d | 1 | 0.96mi |
| 1163 Bent Rail Cir Colton, CA | 3.0 | 2.0 | 1248 | $2,795 | $2.24 | 45d | 1 | 1.02mi |
| 291 E C St Unit A Colton, CA | 3.0 | 1.0 | 1284 | $2,500 | $1.95 | 26d | 1 | 1.03mi |
| 291 E C St Colton, CA | 3.0 | 1.0 | 1284 | $2,500 | $1.95 | 45d | 1 | 1.03mi |
| 410 E B St Colton, CA | 2.0 | 1.0 | 1064 | $2,300 | $2.16 | 1d | 1 | 1.13mi |
| 501 Villa Way Colton, CA | 3.0 | 2.5 | 1708 | $3,300 | $1.93 | 20d | 1 | 1.25mi |
| 145 W M St Colton, CA | 4.0 | 2.0 | 1520 | $3,200 | $2.11 | 20d | 1 | 1.33mi |
| 1351 Christobal Ln Colton, CA | 4.0 | 2.5 | 1726 | $3,300 | $1.91 | 3d | 1 | 1.41mi |
| 1351 Christobal Ln Colton, CA | 4.0 | 2.5 | 1726 | $3,300 | $1.91 | 0d | 1 | 1.41mi |
| 162 E M St Unit 162 Colton, CA | 3.0 | 1.0 | 1200 | $2,345 | $1.95 | 17d | 1 | 1.42mi |
| 443 S Tamarisk Ave Rialto, CA | 4.0 | 2.0 | 1574 | $3,700 | $2.35 | 45d | 1 | 1.48mi |
| 114 N Lassen Ave San Bernardino, CA | 3.0 | 2.5 | 1561 | $3,225 | $2.07 | 12d | 1 | 1.50mi |
Listing history 18 events
-
2026-06-21days on market $435,580 Active 125 DOM
-
2026-06-18days on market $435,580 Active 122 DOM
-
2026-06-17days on market $435,580 Active 121 DOM
-
2026-06-16days on market $435,580 Active 120 DOM
-
2026-06-15days on market $435,580 Active 119 DOM
-
2026-06-13days on market $435,580 Active 117 DOM
-
2026-06-13days on market $435,580 Active 116 DOM
-
2026-06-09days on market $435,580 Active 113 DOM
-
2026-06-08days on market $435,580 Active 112 DOM
-
2026-06-07days on market $435,580 Active 111 DOM
-
2026-06-04days on market $435,580 Active 108 DOM
-
2026-06-03days on market $435,580 Active 107 DOM
-
2026-06-02days on market $435,580 Active 106 DOM
-
2026-06-01days on market $435,580 Active 105 DOM
-
2026-05-31days on market $435,580 Active 104 DOM
-
2026-03-18status Active 1146-char remark
Show marketing remark (1146 chars)
Near Schools, Single Story and Colton Love ready for some upgrades to make it your ideal next home or investment purchase. A short jaunt to Colton Middle School to the east, or an extra block over to the north and west to Paul Rogers Elementary, or a quick jog down to Colton High School the value in location is difficult to defeat. Property lives as a 4 Bedrooms, 2 Bathrooms, with Backyard Views of all three of the major peaks of the Inland Empire-- From San Jacinto, to San Gorgonio/San Bernardino to San Antonio/Mt. Baldy -- Established trees, and a charming citrus tree (Tangerine) to make summer scents and winter fruits to continue this home's proud colton heritage. Alley access and gate can provide extra parking for vehicles, wheeled toys or a future expansion of the living quarters on the parcel. 4th Bedroom added along with breezeway extension to expand the footprint of the property-- we recommend buyer's to verify to own satisfaction. Per Owner- Roof has been replaced 3 years ago Public Images have been edited to remove furniture with 3D tour available to view (link IN MLS) True to Life images are Also Available in Listing
-
2026-01-25$435,580 Active 1146-char remark
Show marketing remark (1146 chars)
Near Schools, Single Story and Colton Love ready for some upgrades to make it your ideal next home or investment purchase. A short jaunt to Colton Middle School to the east, or an extra block over to the north and west to Paul Rogers Elementary, or a quick jog down to Colton High School the value in location is difficult to defeat. Property lives as a 4 Bedrooms, 2 Bathrooms, with Backyard Views of all three of the major peaks of the Inland Empire-- From San Jacinto, to San Gorgonio/San Bernardino to San Antonio/Mt. Baldy -- Established trees, and a charming citrus tree (Tangerine) to make summer scents and winter fruits to continue this home's proud colton heritage. Alley access and gate can provide extra parking for vehicles, wheeled toys or a future expansion of the living quarters on the parcel. 4th Bedroom added along with breezeway extension to expand the footprint of the property-- we recommend buyer's to verify to own satisfaction. Per Owner- Roof has been replaced 3 years ago Public Images have been edited to remove furniture with 3D tour available to view (link IN MLS) True to Life images are Also Available in Listing
-
2026-01-23historical $435,580 1146-char remark
Show marketing remark (1146 chars)
Near Schools, Single Story and Colton Love ready for some upgrades to make it your ideal next home or investment purchase. A short jaunt to Colton Middle School to the east, or an extra block over to the north and west to Paul Rogers Elementary, or a quick jog down to Colton High School the value in location is difficult to defeat. Property lives as a 4 Bedrooms, 2 Bathrooms, with Backyard Views of all three of the major peaks of the Inland Empire-- From San Jacinto, to San Gorgonio/San Bernardino to San Antonio/Mt. Baldy -- Established trees, and a charming citrus tree (Tangerine) to make summer scents and winter fruits to continue this home's proud colton heritage. Alley access and gate can provide extra parking for vehicles, wheeled toys or a future expansion of the living quarters on the parcel. 4th Bedroom added along with breezeway extension to expand the footprint of the property-- we recommend buyer's to verify to own satisfaction. Per Owner- Roof has been replaced 3 years ago Public Images have been edited to remove furniture with 3D tour available to view (link IN MLS) True to Life images are Also Available in Listing
ⓘ Source: listings_history table (triggers on properties + properties_extension) + one-shot
backfill from property_details.listing_events for pre-trigger history.
Tax reassessment forecast CA · Resets to sale price
- Current annual tax
- $1,621 · $135/mo
- Projected year-2 tax
- $3,310 · $276/mo
- Expected delta
- +$1,689/yr (+$141/mo · 104.2%)
ⓘ Screening estimate from a state-policy table — verify with the county assessor before closing.
Climate risk First Street
- Flood 1/10 Low FEMA zone X (unshaded) · 0% chance over 30 yrs
- Wildfire 1/10 Low
- Heat 8/10 Severe 6 d/yr ≥102°F today · 19 d/yr by 30 yrs out
- Wind 1/10 Low
- Air quality 10/10 Extreme 25 unhealthy d/yr today · 31 by 30 yrs out
Nearby sold comps map
Loading sold comps map…
Walkable amenities ~0.75 mi
Loading nearby amenities…
Taxation est. · year 1
- Rental income
- $34,160
- − Mortgage interest
- −$24,399
- − Property taxes
- −$1,621
- − Insurance
- −$2,178
- − Repairs & maintenance
- −$2,733
- − Management
- −$2,733
- − Depreciation
- −$12,671
- Taxable loss
- −$12,175
- Est. tax savings @ 24.0%
- +$2,922
- After-tax cash flow
- $-1,301/yr
For passive investors: Depreciation is non-cash, so a rental often shows a tax loss while cash-flowing — sheltering income. Rental losses are passive: they offset passive income freely, and up to $25,000/yr can offset ordinary (W-2) income if you actively participate and your MAGI is under $100k (phasing out to $0 by $150k); unused losses carry forward. On sale, claimed depreciation is recaptured at up to 25%, and gains may owe capital-gains tax (a 1031 exchange can defer both). Figures are a year-1 estimate at your 24.0% rate — not tax advice; consult a CPA.
Schools (NCES district)
- District
- Colton Joint Unified
- NCES district ID
- 0609390
- Math proficiency
- 16% ▼ -9.00%
- Reading proficiency
- 38% ▼ -1.00%
- Median HH income
- $51,178
- Composite
- 23.74/100
- National rank
- #7820
- State rank
- #373 of 517 in CA
Livability — Colton
- Score
- 56/100
- State rank
- #817
- US rank
- #23005
Category grades
Schools grade is shown separately in the Schools card above.
Census & demographics
- Census place
- Colton, CA
- County
- San Bernardino County · 2,030,291 people
- City population
- 57,365
- Metro
- Riverside-San Bernardino-Ontario, CA
- Population (ZIP)
- 57,365
- Household income
- $71,078
- Rent vs Own
- Severe rent burden
- 2195.0
Population outlook (San Bernardino County) Hauer SSP2
- Today (2025)
- 2,300,329 people
- By 2030
- 2,378,907 · +3.4%
- By 2040
- 2,523,137 · +9.7%
- By 2050
- 2,642,388 · +14.9%
- By 2075
- 2,880,769 · +25.2%
- By 2100
- 2,909,436 · +26.5%
Race, ethnicity, and origin ACS 2023
- Neighborhood character
- Predominantly Hispanic (74%)
- Race & ethnicity
- Hispanic / Latino 74% Two or more races 24% White 11% Black 8% Asian 4% Native American 1%
- Hispanic origin (detail)
- Mexican 69%
- Common ancestry
- Lithuanian 1%
- Foreign-born
- 24% · Canada, Vietnam
- Languages at home
- 47% English-only · Spanish 49% Tagalog/Filipino 1% Other Indo-European 1%
Political lean MEDSL · San Bernardino
- 2024 margin
- Toss-up / Even · D 47.5% · R 49.7% · Other 2.8%
- 2008→2024 swing
- -8.5pp toward R · 2008: 6.3pp · 2024: -2.1pp
- All cycles
- 2024: R+2.1 2020: D+10.7 2016: D+9.8 2012: D+5.4 2008: D+6.3
Not yet ingested
- Civics
- —
Market trends
- HPI YoY
- ▼ -270.99%
- Current HPI
- 451.2973
- Rent YoY
- ▲ 2.50%
- Metro
- Riverside-San Bernardino-Ontario, CA
- State GDP YoY
- ▲ 3.21%
- F500 in state
- 116
Industry mix (Fortune 500 HQ in CA)
| Industry | F500 HQs | Revenue |
|---|---|---|
| Technology | 27 | $1,492B |
|
||
| Financial Services | 3 | $174B |
|
||
| Retail | 3 | $44B |
|
||
| Insurance | 3 | $26B |
|
||
| Media / Entertainment | 2 | $115B |
|
||
| Pharmaceuticals / Biotech | 2 | $62B |
|
||
Price history
+0.0% since first listed3 events — show timeline
- 2026-03-18 Relisted — CRMLS
- 2026-01-25 Listed $435,580 CRMLS
- 2026-01-23 Coming Soon $435,580 CRMLS
Property tax history
+7.7%/yrLatest (2025): $1,621 · +4.8% YoY. Source: county tax records.
Cash-flow waterfall
monthlySold comps — $/sqft
last 12 mo · ≤1 miLoading sold comps…