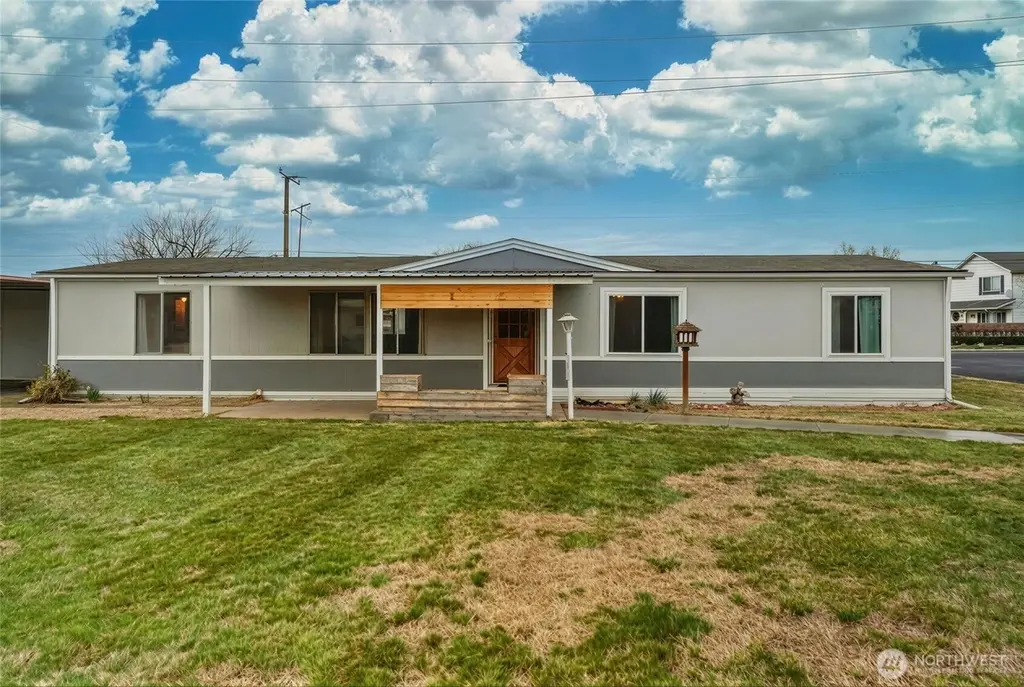
806 SE Mockingbird Dr · College Place, WA
Flood risk 5/10 · Moderate
- FEMA flood zone
- X
- Chance of flooding over 30 yrs
- 0.24%
- Est. flood insurance / yr
- $507 – $1,088
Fire risk 1/10 · Minimal
- Est. fire insurance / yr
- $604 – $1,122
Heat risk 4/10 · Minor
- Hot days now (above 98°F)
- 7 days/yr
- Hot days in 30 yrs
- 15 days/yr
Wind risk 1/10 · Minimal
- Chance of severe wind over 30 yrs
- —
Air-quality risk 8/10 · Major
- Unhealthy air days now
- 10 days/yr
- Unhealthy air days in 30 yrs
- 13 days/yr
Risk factors via First Street. Map © Google.
Why this score? — see what drove the B+ grade
The composite is a weighted blend of 9 inputs, each scored 0–100. Each bar is that input's sub-score; the figure is the points it added to the 100-point composite (weight × sub-score).
- Cash flow +30.0/30.0
- ARV discount +13.2/15.0
- 1% rule +10.0/10.0
- DSCR +10.0/10.0
- Schools +4.2/10.0
- Livability +4.1/5.0
- Rent growth +2.5/5.0
- Condition / age +2.5/5.0
- Appreciation +0.0/10.0
$110,000
🖨 Deal sheet (PDF) 📄 Offer letter ✓ Due diligence
Listing remarks
Nestled in one of College Place's most sought-after vibrant 55+ communities, this beautifully appointed 3-bedroom, 2-bath home offers the perfect blend of comfort and lifestyle. New carpet throughout, newer exterior paint and new vinyl flooring in guest bath. The spacious primary suite provides a peaceful retreat, while a flexible bonus room adapts effortlessly as a second living space or formal dining room. Situated on a generous corner lot, the property features a double carport, additional front parking, and a large storage shed/workshop. Enjoy exclusive amenities including a clubhouse and sparkling pool, all just steps from your door.
Key facts
- Clubhouse
- New carpet
- Double carport
Tags
Neighborhood map
What this means for you Summary
Snapshot
- This is a 3-bed/2.0-bath manufactured listed at $110k.
Deal economics
- At list price, monthly cash flow is $723 ($9k/yr) — positive.
- The deal already cash-flows at list — no discount required.
- Meets the 1% rule at list price ($2k rent vs $110k).
- Recommended offer: $103k (6.0% below list) — sets the bar for market timing.
- Cap rate 14.2% vs local median 2.5% in College Place — top-decile yield for the area; either an underpriced asset or a hidden risk that comps aren't pricing in. Stress-test before assuming the spread holds.
Location & tenants
- Location reads 82/100 on livability (#71 in WA, #1,277 nationally) — a professional / high-income tenant draw. Strengths: commute A+, housing A+, health & safety A+; Watch: employment D, amenities D-.
- College Place School District (suburban): math 41% / reading 53% proficiency, ranked #170 of 291 in WA (top 58%) — families likely to look elsewhere, expect single-tenant / working-renter base with shorter leases.
- Market conditions: 104 active listings in the ZIP; 15 comparable units currently listed for rent nearby; rentals lingering (median 45d on market — plan ~5-8 weeks vacancy on turnover, expect pricing pressure); 100% of comp listings sitting > 30 days — soft ceiling on asking rent; 206 units permitted in Walla Walla County in 2024 (50 in 5+ unit buildings).
- This rent runs 35% of the median local income ($63k/yr) — at the standard rent-burdened threshold; future hikes will face affordability resistance.
Forward outlook
- Local home prices are declining (-3.0%/yr); year-one equity from $761 of loan paydown is wiped out by about $3k of value loss. Plan a longer hold.
- Walla Walla County population projected at +8% by 2050 — modest demand growth; plan on rents tracking national, not racing it.
- At projected returns (-3.0% appreciation + 3.0% rent growth), your $31k cash investment doubles in ~5 years — after that, you're playing with house money.
Negotiation context
- It's been on market 64 days — a 6% lower offer ($103k) is reasonable based on typical stale-listing flexibility.
Risks & watch-outs
- Climate carrying-cost: moderate flood risk — expect insurance premiums to compound above CPI over the hold.
Questions for the listing agent
- It's been on market 64 days. Have you received any prior offers? Is the seller open to a 6% concession, seller financing, or rate buy-down credit?
- Built in 1976 — when were the roof, HVAC, electrical panel, plumbing, and water heater last replaced?
- Why hasn't it sold? Are there any deal-killer items the seller is aware of (foundation, flood, title, zoning, code violations)?
- Is there a deadline driving the sale (1031 exchange, divorce, estate, relocation)? That informs how much negotiation room exists.
- What's the average days-on-market for RENTAL listings here right now (not sales)? A rising rental-DOM trend means longer vacancies and softer asking-rent achievability than the comps imply.
- What's the recent tenant-quality profile in this submarket — average credit score on applications, eviction rate, late-payment / NSF rate, and stable-employment percentage? A property-management company in the area should have these aggregated.
- How much new for-sale + rental construction is in the pipeline within 1–3 miles? Heavy new supply typically softens prices + rents 12–24 months out; constrained supply supports both.
Investment metrics
- 1% rule
- 1.65% ✓
- Cap rate
- 14.19%
- Cash-on-cash
- 28.19%
- DSCR
- 2.25
- GRM
- 5.0
CMA / ARV
- ARV (median comp)
- $126,011
- List price
- $110,000
- Delta
- -12.71%
- Verdict
- UNDERPRICED
- Comps
- 10 within 1.0 mi
Show comp detail 10 sales within ~0.75 mi
| Address | Dist | Beds/Ba | Sqft | Sold | Price | $/sf | Match |
|---|---|---|---|---|---|---|---|
| 826 SE Scenic View Dr | 0.11mi | 2/2.0 (-1) | 1,436 (+0%) | 3mo | $87,400 | $61 | 87 |
| 1458 SE Sandpiper Ln | 0.04mi | 3/2.0 | 1,340 (-6%) | 2mo | $85,320 | $64 | 86 |
| 829 SE Mockingbird Dr | 0.05mi | 3/2.0 | 1,621 (+13%) | 7mo | $110,000 | $68 | 70 |
| 1444 SE Osprey Ln | 0.15mi | 3/2.0 | 1,603 (+12%) | 5mo | $120,000 | $75 | 68 |
| 1402 Samuel Dr | 0.14mi | 3/2.0 | 1,280 (-11%) | 10mo | $175,000 | $137 | 67 |
| 1496 Osprey Ln | 0.22mi | 3/2.0 | 1,620 (+13%) | 2mo | $136,500 | $84 | 66 |
| 981 SE Scenic View Dr | 0.20mi | 3/2.0 | 1,579 (+10%) | 13mo | $195,000 | $123 | 63 |
| 877 SE Mockingbird Dr | 0.17mi | 3/2.0 | 1,340 (-6%) | 23mo | $100,000 | $75 | 62 |
| 961 SE Scenic View Dr | 0.18mi | 2/2.0 (-1) | 1,244 (-13%) | 13mo | $90,000 | $72 | 54 |
| 127 SE Pepperidge Pl | 0.41mi | 3/2.0 | 1,304 (-9%) | 22mo | $250,000 | $192 | 48 |
Match score weights: distance 35% · size 25% · config 20% · recency 20%. Top-matched comps best support the ARV.
Projected returns pro-forma
-3.0% appreciation · 3.0% rent growth · sell at horizon
- IRR
- 22.4%
- Equity multiple
- 1.92×
- Total profit
- $28,252
- Equity at exit
- $16,401
- IRR
- 30.4%
- Equity multiple
- 3.73×
- Total profit
- $83,930
- Equity at exit
- $9,511
Cash invested: $30,800 (down + closing). Projections, not guarantees.
Landlord ↔ Tenant lean methodology
- Overall (STATE)
- 28 Tenant-Leaning
- State Washington
- 28 Tenant-Leaning · D+8
- County
- — inherits STATE
- City
- — inherits STATE
ZIP-level market 99324
- Home prices YoY
- -17.6%
- Active inventory
- 104
- Price-to-rent
- 5.0×
Monthly cashflow live
- Estimated rent
- $1,819 high interval (Pro) →
- Mortgage (P&I)
- −$577
- Tax from tax record
- −$91 /mo · $1,092/yr
- Insurance
- −$46
- HOA
- −$0
- Vacancy / Maint / Mgmt
- −$382
- Net cashflow
- $723
Break-even live
Sensitivity live
| Price | -10% $786 | -5% $755 | +0% $723 | +5% $692 | +10% $661 |
|---|---|---|---|---|---|
| Rent | -10% $580 | -5% $652 | +0% $723 | +5% $795 | +10% $867 |
| Rate | -1.0pp $779 | -0.5pp $751 | base $723 | +0.5pp $695 | +1.0pp $666 |
UW: 25.0% down · 7.5% · 30yr · 1.5% tax · 5.0% vac · 8.0% maint · 8.0% mgmt
Financing live
Cash to close
- Down payment
- $27,500
- Closing costs
- $3,300
- Reserves months
- —
- Total cash needed
- —
Loan-product check · same deal, 3 products live
Conventional
25% down · 7.5% · 30yr
- Down + closing
- —
- Monthly P&I
- —
- Monthly cashflow
- —
- DSCR
- —
- Eligible?
- —
Personal DTI + credit; lowest rate.
DSCR
20% down · 8.5% · 30yr
- Down + closing
- —
- Monthly P&I
- —
- Monthly cashflow
- —
- DSCR
- —
- Eligible?
- —
No personal income docs; deal must DSCR.
Hard money
10% down · 12.0% · 12mo
- Down + closing
- —
- Monthly P&I
- —
- Monthly cashflow
- —
- DSCR
- —
- Eligible?
- —
Short-term bridge; refi at stabilization.
Rent comps 15 comps
| Address | Beds | Baths | Sqft | Rent | $/sqft | DOM | Units | Dist |
|---|---|---|---|---|---|---|---|---|
| 1005 SW Puff Ln College Place, WA | 2.0 | 1.0 | 890 | $1,100 | $1.24 | 45d | 1 | 0.66mi |
| 806 S College Ave College Place, WA | 1.0–2.0 | 1.0–2.0 | 738 | $1,750 | $2.37 | 45d | 3 | 0.71mi |
| 103 SW 9th St College Place, WA | 4.0 | 2.5 | 1616 | $2,095 | $1.30 | 45d | 1 | 0.72mi |
| 512 S College Ave #1 College Place, WA | 3.0 | 1.0 | 1328 | $1,785 | $1.34 | 45d | 1 | 0.84mi |
| 310 SE 3rd St Unit 4 College Place, WA | 2.0 | 1.0 | 1300 | $1,300 | $1.00 | 45d | 1 | 0.84mi |
| 24 SE 4th St College Place, WA | 3.0 | 1.0 | 1270 | $2,045 | $1.61 | 45d | 1 | 0.85mi |
| 309 SW 6th St Apt 1 College Place, WA | 4.0 | 2.0 | 1350 | $1,739 | $1.29 | 45d | 1 | 0.93mi |
| 218 E Whitman Dr Unit 1 College Place, WA | 4.0 | 2.5 | 1485 | $2,240 | $1.51 | 45d | 1 | 1.03mi |
| 22 NE Hadley Way #1 College Place, WA | 2.0 | 2.5 | 1150 | $2,095 | $1.82 | 45d | 1 | 1.06mi |
| 418 SW 4th St Unit C College Place, WA | 2.0 | 1.5 | 1150 | $1,595 | $1.39 | 45d | 1 | 1.13mi |
| 255 Elder Pl #3 College Place, WA | 2.0 | 1.0 | 889 | $1,415 | $1.59 | 45d | 1 | 1.22mi |
| 23 NW Earl Ln College Place, WA | 3.0 | 2.5 | 1600 | $1,845 | $1.15 | 45d | 1 | 1.28mi |
| 942 NE Spitzenburg St Apt B104 College Place, WA | 2.0 | 1.5 | 975 | $1,530 | $1.57 | 45d | 1 | 1.30mi |
| 623 W Whitman Dr Unit 623 Whitman College Place, WA | 2.0 | 1.5 | 900 | $1,575 | $1.75 | 45d | 1 | 1.36mi |
| 70 NE Rose St Unit B College Place, WA | 3.0 | 1.0 | 1500 | $1,300 | $0.87 | 45d | 1 | 1.39mi |
Listing history 2 events
-
2026-05-01price $110,000
-
2026-03-17$120,000 Active
ⓘ Source: listings_history table (triggers on properties + properties_extension) + one-shot
backfill from property_details.listing_events for pre-trigger history.
Tax reassessment forecast WA · Resets to sale price
- Current annual tax
- $1,092 · $91/mo
- Projected year-2 tax
- $1,092 · $91/mo
- Expected delta
- $0/yr ($0/mo · 0.0%)
ⓘ Screening estimate from a state-policy table — verify with the county assessor before closing.
Climate risk First Street
- Flood 5/10 Major FEMA zone X · 24% chance over 30 yrs
- Wildfire 1/10 Low
- Heat 4/10 Moderate 7 d/yr ≥98°F today · 15 d/yr by 30 yrs out
- Wind 1/10 Low
- Air quality 8/10 Severe 10 unhealthy d/yr today · 13 by 30 yrs out
Nearby sold comps map
Loading sold comps map…
Walkable amenities ~0.75 mi
Loading nearby amenities…
Taxation est. · year 1
- Rental income
- $21,830
- − Mortgage interest
- −$6,162
- − Property taxes
- −$1,092
- − Insurance
- −$550
- − Repairs & maintenance
- −$1,746
- − Management
- −$1,746
- − Depreciation
- −$3,200
- Taxable income
- $7,334
- Est. tax owed @ 24.0%
- −$1,760
- After-tax cash flow
- $6,922/yr
For passive investors: Depreciation is non-cash, so a rental often shows a tax loss while cash-flowing — sheltering income. Rental losses are passive: they offset passive income freely, and up to $25,000/yr can offset ordinary (W-2) income if you actively participate and your MAGI is under $100k (phasing out to $0 by $150k); unused losses carry forward. On sale, claimed depreciation is recaptured at up to 25%, and gains may owe capital-gains tax (a 1031 exchange can defer both). Figures are a year-1 estimate at your 24.0% rate — not tax advice; consult a CPA.
Schools (NCES district)
- District
- College Place School District
- NCES district ID
- 5301470
- Math proficiency
- 41% ▲ 2.00%
- Reading proficiency
- 53% ▬ 0.00%
- Median HH income
- $48,045
- Composite
- 42.23/100
- National rank
- #6997
- State rank
- #170 of 291 in WA
Livability — College Place
- Score
- 82/100
- State rank
- #71
- US rank
- #1277
Category grades
Schools grade is shown separately in the Schools card above.
Census & demographics
- Census place
- College Place, WA
- County
- Walla Walla County · 52,990 people
- City population
- 10,137
- Metro
- Walla Walla, WA
- Population (ZIP)
- 10,137
- Household income
- $62,839
- Rent vs Own
- Severe rent burden
- 400.0
Population outlook (Walla Walla County) Hauer SSP2
- Today (2025)
- 63,088 people
- By 2030
- 64,417 · +2.1%
- By 2040
- 66,563 · +5.5%
- By 2050
- 68,337 · +8.3%
- By 2075
- 73,235 · +16.1%
- By 2100
- 74,878 · +18.7%
Race, ethnicity, and origin ACS 2023
- Neighborhood character
- Predominantly White (72%)
- Race & ethnicity
- White 72% Hispanic / Latino 20% Two or more races 8% Asian 3%
- Hispanic origin (detail)
- Mexican 16%
- Common ancestry
- Italian 6% Lithuanian 4% Portuguese 4%
- Foreign-born
- 9% · Canada, China
- Languages at home
- 84% English-only · Spanish 12% French/Haitian/Cajun 1% Other Asian/Pacific 1%
Political lean MEDSL · Walla Walla
- 2024 margin
- Lean R (+8.1) · D 44.6% · R 52.7% · Other 2.7%
- 2008→2024 swing
- +8.5pp toward D · 2008: -16.6pp · 2024: -8.1pp
- All cycles
- 2024: R+8.1 2020: R+8.7 2016: R+16.4 2012: R+22.3 2008: R+16.6
Not yet ingested
- Civics
- —
Market trends
- HPI YoY
- ▼ -69.73%
- Current HPI
- 326.0923
- Rent YoY
- —
- Metro
- Walla Walla, WA
- State GDP YoY
- ▲ 4.65%
- F500 in state
- 22
Industry mix (Fortune 500 HQ in WA)
| Industry | F500 HQs | Revenue |
|---|---|---|
| Retail | 2 | $269B |
|
||
| Technology / Retail | 1 | $638B |
|
||
| Technology | 1 | $245B |
|
||
| Telecommunications | 1 | $38B |
|
||
| Food / Beverage | 1 | $36B |
|
||
| Automotive / Trucks | 1 | $34B |
|
||
Price history
-8.3% since first listed2 events — show timeline
- 2026-05-01 Price Changed $110,000 NWMLS as Distributed by MLS Grid
- 2026-03-17 Listed $120,000 NWMLS as Distributed by MLS Grid
Property tax history
+8.4%/yrLatest (2026): $1,092 · -1.7% YoY. Source: county tax records.
Cash-flow waterfall
monthlySold comps — $/sqft
last 12 mo · ≤1 miLoading sold comps…