234 Coastline Rd · Monroe, PA
Flood risk 1/10 · Minimal
- FEMA flood zone
- X (unshaded)
- Chance of flooding over 30 yrs
- 0.0%
- Est. flood insurance / yr
- $473 – $860
Fire risk 3/10 · Minor
- Est. fire insurance / yr
- $511 – $949
Heat risk 3/10 · Minor
- Hot days now (above 95°F)
- 7 days/yr
- Hot days in 30 yrs
- 15 days/yr
Wind risk 2/10 · Minimal
- Chance of severe wind over 30 yrs
- 1.0%
Air-quality risk 1/10 · Minimal
- Unhealthy air days now
- 0 days/yr
- Unhealthy air days in 30 yrs
- 0 days/yr
Risk factors via First Street. Map © Google.
Why this score? — see what drove the D grade
The composite is a weighted blend of 9 inputs, each scored 0–100. Each bar is that input's sub-score; the figure is the points it added to the 100-point composite (weight × sub-score).
- Appreciation +10.0/10.0
- Cash flow +7.5/30.0
- ARV discount +7.5/15.0
- Schools +3.5/10.0
- Livability +3.2/5.0
- Rent growth +2.5/5.0
- Condition / age +2.5/5.0
- 1% rule +2.2/10.0
- DSCR +1.6/10.0
$200,000
🖨 Deal sheet 📄 Offer letter ✓ Due diligence
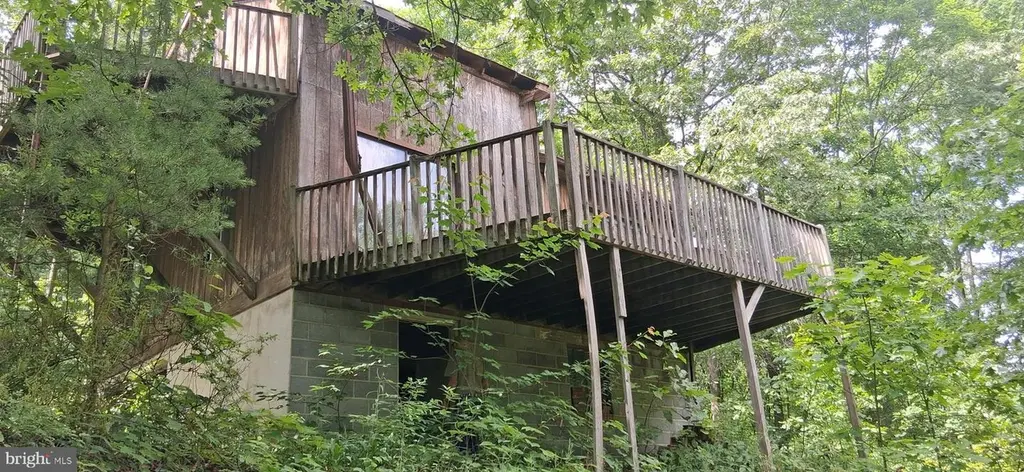
Listing remarks
Welcome to Coastline Rd. Nestled 0n 16.39 wooded acres, this 2000-built home offers incredible potential. The home includes three bedrooms and 1 full bath unfinished, along with a beautiful brick fireplace. While the home is unfinished and needs repair-requiring a heating system, bathroom, and kitchen completion- it already has electrical wiring run and ducts installed. Plus, a well is in place, awaiting a septic solution. This is a perfect canvas to create your dream retreat!
Key facts
- Electrical wiring
- Brick fireplace
- Wooded acres
Tags
Property features AI
Exterior
- Parking: Other parking
- Utilities: Well water; Underground utilities; No septic system; No municipal trash service
- Home design: Fee simple ownership; Below average property condition; Shingle roof
- Construction: Masonry construction; Building not winterized; Pets allowed (cats and dogs)
- Exterior features: Not in a federal flood zone; Ground rent paid annually; Above grade other structures
Interior
- Bedrooms: 3 bedrooms on the main level
- Bathrooms: 1 full bathroom (main level)
- Interior features: Estimated living area; Brick fireplace
Neighborhood map
What this means for you Summary
Snapshot
- This is a 3-bed/1.0-bath single-family listed at $200k.
Deal economics
- At list price, monthly cash flow is $-249 ($-3k/yr) — negative.
- To cash-flow at today's rent, offer at most $164k (18.0% below list).
- To meet the 1% rule (rent ≥ 1% of price), the offer needs to be $143k (28.3% below list).
- Recommended offer: $143k (28.3% below list) — sets the bar for 1% rule.
Location & tenants
- Location reads 65/100 on livability (#1,161 in PA) — a middle-class / working-renter tenant base. Strengths: cost of living A+, housing A+, employment B; Watch: schools D, amenities F, commute F.
- Everett Area SD (rural): math 32% / reading 52% proficiency, ranked #337 of 539 in PA (top 62%) — families likely to look elsewhere, expect single-tenant / working-renter base with shorter leases.
- Market conditions: 61 active listings in the ZIP; 54 units permitted in Bedford County in 2024 (0 in 5+ unit buildings).
Forward outlook
- In year one you build about $21k of equity ($1k loan paydown + $20k appreciation (10.0% local appreciation)).
- Bedford County population projected at -25% by 2050 — secular population decline; favor cash flow + early exit over multi-decade hold.
- By year 2, paydown + projected appreciation supports a ~$34k cash-out refi (75% LTV) — recoverable capital for the next deal without selling this one.
Negotiation context
- Only 7 days on market — expect competitive offers; lowballing is unlikely to land.
Questions for the listing agent
- What do current leases actually rent for vs. the listed asking? Can we see a recent rent roll and the last 12 months of T-12 income?
- Is there a deadline driving the sale (1031 exchange, divorce, estate, relocation)? That informs how much negotiation room exists.
- Schools are D-rated, which usually means shorter tenancies and higher turnover. Who's the typical renter profile here, and what's been the actual vacancy rate?
- The area grade is low — what's the realistic commute time and amenity access for the typical tenant pool here? Any planned neighborhood developments (good or bad) we should know about?
- What's the average days-on-market for RENTAL listings here right now (not sales)? A rising rental-DOM trend means longer vacancies and softer asking-rent achievability than the comps imply.
- What's the recent tenant-quality profile in this submarket — average credit score on applications, eviction rate, late-payment / NSF rate, and stable-employment percentage? A property-management company in the area should have these aggregated.
- How much new for-sale + rental construction is in the pipeline within 1–3 miles? Heavy new supply typically softens prices + rents 12–24 months out; constrained supply supports both.
Investment metrics
- 1% rule
- 0.72% ✗
- Cap rate
- 4.80%
- Cash-on-cash
- -5.33%
- DSCR
- 0.76
- GRM
- 11.6
CMA / ARV
No comps found within radius.
Projected returns pro-forma
10.0% appreciation · 3.0% rent growth · sell at horizon
- IRR
- 20.5%
- Equity multiple
- 2.66×
- Total profit
- $93,105
- Equity at exit
- $180,176
- IRR
- 18.7%
- Equity multiple
- 6.12×
- Total profit
- $286,680
- Equity at exit
- $388,556
Cash invested: $56,000 (down + closing). Projections, not guarantees.
Landlord ↔ Tenant lean methodology
- Overall (STATE)
- 62 Landlord-Friendly
- State Pennsylvania
- 62 Landlord-Friendly · EVEN
- County
- — inherits STATE
- City
- — inherits STATE
ZIP-level market 15537
- Home prices YoY
- 17.3%
- Active inventory
- 61
- Price-to-rent
- 11.6×
Monthly cashflow live
- Estimated rent
- $1,435 medium interval (Pro) →
- Mortgage (P&I)
- −$1,049
- Tax est. 1.5%
- −$250 /mo · $3,000/yr
- Insurance
- −$83
- HOA
- −$0
- Vacancy / Maint / Mgmt
- −$301
- Net cashflow
- $-249
Break-even live
UW: 25.0% down · 7.5% · 30yr · 1.5% tax · 5.0% vac · 8.0% maint · 8.0% mgmt
Financing live
Cash to close
- Down payment
- $50,000
- Closing costs
- $6,000
- Reserves months
- —
- Total cash needed
- —
Loan-product check · same deal, 3 products live
Conventional
25% down · 7.5% · 30yr
- Down + closing
- —
- Monthly P&I
- —
- Monthly cashflow
- —
- DSCR
- —
- Eligible?
- —
Personal DTI + credit; lowest rate.
DSCR
20% down · 8.5% · 30yr
- Down + closing
- —
- Monthly P&I
- —
- Monthly cashflow
- —
- DSCR
- —
- Eligible?
- —
No personal income docs; deal must DSCR.
Hard money
10% down · 12.0% · 12mo
- Down + closing
- —
- Monthly P&I
- —
- Monthly cashflow
- —
- DSCR
- —
- Eligible?
- —
Short-term bridge; refi at stabilization.
Listing history 7 events
-
2026-06-18days on market $200,000 Active 7 DOM
-
2026-06-17days on market $200,000 Active 6 DOM
-
2026-06-16days on market $200,000 Active 5 DOM
-
2026-06-15days on market $200,000 Active 4 DOM
-
2026-06-13days on market $200,000 Active 2 DOM
-
2026-06-12remarks 481-char remark
-
2026-06-12$200,000 Active 1 DOM
ⓘ Source: listings_history table (triggers on properties + properties_extension) + one-shot
backfill from property_details.listing_events for pre-trigger history.
Climate risk First Street
- Flood 1/10 Low FEMA zone X (unshaded) · 0% chance over 30 yrs
- Wildfire 3/10 Moderate
- Heat 3/10 Moderate 7 d/yr ≥95°F today · 15 d/yr by 30 yrs out
- Wind 2/10 Low 100% chance of damaging wind over 30 yrs
- Air quality 1/10 Low 0 unhealthy d/yr today · 0 by 30 yrs out
Nearby sold comps map
Loading sold comps map…
Walkable amenities ~0.75 mi
Loading nearby amenities…
Taxation est. · year 1
- Rental income
- $17,217
- − Mortgage interest
- −$11,203
- − Property taxes
- −$3,000
- − Insurance
- −$1,000
- − Repairs & maintenance
- −$1,377
- − Management
- −$1,377
- − Depreciation
- −$5,818
- Taxable loss
- −$6,559
- Est. tax savings @ 24.0%
- +$1,574
- After-tax cash flow
- $-1,411/yr
For passive investors: Depreciation is non-cash, so a rental often shows a tax loss while cash-flowing — sheltering income. Rental losses are passive: they offset passive income freely, and up to $25,000/yr can offset ordinary (W-2) income if you actively participate and your MAGI is under $100k (phasing out to $0 by $150k); unused losses carry forward. On sale, claimed depreciation is recaptured at up to 25%, and gains may owe capital-gains tax (a 1031 exchange can defer both). Figures are a year-1 estimate at your 24.0% rate — not tax advice; consult a CPA.
Schools (NCES district)
- District
- Everett Area SD
- NCES district ID
- 4209360
- Math proficiency
- 32% ▼ -10.00%
- Reading proficiency
- 52% ▼ -9.00%
- Median HH income
- $41,322
- Composite
- 35.24/100
- National rank
- #4979
- State rank
- #337 of 539 in PA
Livability — Monroe
- Score
- 65/100
- State rank
- #1161
- US rank
- #13436
Category grades
Schools grade is shown separately in the Schools card above.
Census & demographics
- Population (ZIP)
- 8,272
Population outlook (Bedford County) Hauer SSP2
- Today (2025)
- 45,395 people
- By 2030
- 43,353 · -4.5%
- By 2040
- 38,858 · -14.4%
- By 2050
- 34,162 · -24.7%
- By 2075
- 24,868 · -45.2%
- By 2100
- 16,910 · -62.7%
Race, ethnicity, and origin ACS 2023
- Neighborhood character
- Predominantly White (95%)
- Race & ethnicity
- White 95% Two or more races 3% Hispanic / Latino 2%
- Common ancestry
- Lithuanian 6% Italian 2% Iranian 2%
- Foreign-born
- 2% · Canada
- Languages at home
- 98% English-only · Spanish 1%
Political lean MEDSL · Bedford
- 2024 margin
- Solid R (+68.6) · D 15.4% · R 84.0%
- 2008→2024 swing
- -23.8pp toward R · 2008: -44.8pp · 2024: -68.6pp
- All cycles
- 2024: R+68.6 2020: R+67.7 2016: R+67.4 2012: R+54.9 2008: R+44.8
Not yet ingested
- Civics
- —
Market trends
- HPI YoY
- ▲ 37.19%
- Current HPI
- 252.292
- Rent YoY
- —
- Metro
- —
- State GDP YoY
- ▲ 1.68%
- F500 in state
- 34
Industry mix (Fortune 500 HQ in PA)
| Industry | F500 HQs | Revenue |
|---|---|---|
| Healthcare | 2 | $309B |
|
||
| Insurance | 2 | $27B |
|
||
| Telecommunications / Media | 1 | $124B |
|
||
| Industrial Distribution | 1 | $22B |
|
||
| Financial Services | 1 | $20B |
|
||
| Chemicals / Materials | 1 | $18B |
|
||
Price history
1 event — show timeline
- 2026-06-11 Listed $200,000 BRIGHT MLS
Cash-flow waterfall
monthlySold comps — $/sqft
last 12 mo · ≤1 miLoading sold comps…