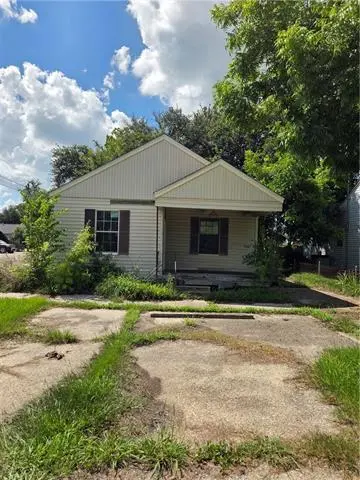
1000 Main St · Laplace, LA
Flood risk 8/10 · Major
- FEMA flood zone
- X (shaded)
- Chance of flooding over 30 yrs
- 0.99%
- Est. flood insurance / yr
- $507 – $1,088
Fire risk 1/10 · Minimal
- Est. fire insurance / yr
- $1,269 – $2,357
Heat risk 9/10 · Severe
- Hot days now (above 108°F)
- 7 days/yr
- Hot days in 30 yrs
- 21 days/yr
Wind risk 9/10 · Severe
- Chance of severe wind over 30 yrs
- 99.0%
Air-quality risk 3/10 · Minor
- Unhealthy air days now
- 2 days/yr
- Unhealthy air days in 30 yrs
- 3 days/yr
Risk factors via First Street. Map © Google.
Why this score? — see what drove the C+ grade
The composite is a weighted blend of 9 inputs, each scored 0–100. Each bar is that input's sub-score; the figure is the points it added to the 100-point composite (weight × sub-score).
- Cash flow +29.0/30.0
- DSCR +10.0/10.0
- 1% rule +8.1/10.0
- ARV discount +7.5/15.0
- Livability +3.5/5.0
- Rent growth +2.5/5.0
- Condition / age +2.5/5.0
- Schools +1.7/10.0
- Appreciation +0.0/10.0
$100,000
🖨 Deal sheet 📄 Offer letter ✓ Due diligence
Listing remarks MLS
Potential! Home ready to be finished with your personal touch! One bedroom, one bath, single family home boasts vaulted ceilings, recessed lighting! Property in succession and was in mid renovation waiting to be finished. Sold as is, succession to make no repairs.
Key facts
- 3 parking spots
- Built 1950
- Listed 7 days
Property features AI
Exterior
- Parking: Off-street parking with three or more spaces
- Utilities: Public water; Public sewer
- Home design: Single-story; Raised foundation; Property is in poor condition
- Construction: Wood siding; Asphalt shingle roof
- Exterior features: City lot; Rectangular lot; Lot dimensions approximately 50 x 150
Interior
- Bathrooms: 1 full bathroom
- Interior features: Cathedral ceilings; Vaulted ceilings; High ceilings
Neighborhood map
What this means for you Summary
Snapshot
- This is a 1-bed/1.0-bath single-family listed at $100k.
Deal economics
- At list price, monthly cash flow is $275 ($3k/yr) — positive.
- The deal already cash-flows at list — no discount required.
- Meets the 1% rule at list price ($1k rent vs $100k).
- Cap rate 10.4% vs local median 4.8% in Laplace — top-decile yield for the area; either an underpriced asset or a hidden risk that comps aren't pricing in. Stress-test before assuming the spread holds.
Location & tenants
- Location reads 70/100 on livability (#61 in LA) — a middle-class / working-renter tenant base. Strengths: cost of living A+, housing A+, health & safety A+; Watch: crime F, amenities F, commute F.
- St. John The Baptist Parish (suburban): math 13% / reading 25% proficiency, ranked #68 of 98 in LA (top 69%) — low school quality limits family demand, transient renter base, plan for 1-2y turnover; 82% free/reduced lunch — lower-income household profile, screen leases tightly.
- Market conditions: 180 active listings in the ZIP; 61 units permitted in St. John the Baptist Parish in 2024 (0 in 5+ unit buildings).
Forward outlook
- Local home prices are declining (-3.0%/yr); year-one equity from $691 of loan paydown is wiped out by about $3k of value loss. Plan a longer hold.
- St. John the Baptist County population projected at -20% by 2050 — secular population decline; favor cash flow + early exit over multi-decade hold.
- At projected returns (-3.0% appreciation + 3.0% rent growth), your $28k cash investment doubles in ~10 years — after that, you're playing with house money.
Negotiation context
- Only 8 days on market — expect competitive offers; lowballing is unlikely to land.
- 2 sale attempts with the ask held roughly flat each time — persistent listings suggest the price (not the market) is what's stuck; bring a comps-based counter.
Risks & watch-outs
- Watch-outs: flood insurance adds $66/mo; built in 1950 — expect roof / HVAC / electrical / plumbing capex.
- Climate carrying-cost: severe flood risk; severe wind risk, 99% chance of damaging wind over 30y; extreme-heat days projected 7→21/yr by 2055 (HVAC capex compounding) — expect insurance premiums to compound above CPI over the hold.
Questions for the listing agent
- Built in 1950 — when were the roof, HVAC, electrical panel, plumbing, and water heater last replaced?
- What's the actual annual flood-insurance premium (NFIP or private), and is the property in a SFHA with mandatory coverage?
- Is there a deadline driving the sale (1031 exchange, divorce, estate, relocation)? That informs how much negotiation room exists.
- Crime grade is F in this area — have there been break-ins, vandalism, or insurance claims at this property in the last 3 years? What carrier currently insures it and at what premium?
- What's the average days-on-market for RENTAL listings here right now (not sales)? A rising rental-DOM trend means longer vacancies and softer asking-rent achievability than the comps imply.
- What's the recent tenant-quality profile in this submarket — average credit score on applications, eviction rate, late-payment / NSF rate, and stable-employment percentage? A property-management company in the area should have these aggregated.
- How much new for-sale + rental construction is in the pipeline within 1–3 miles? Heavy new supply typically softens prices + rents 12–24 months out; constrained supply supports both.
Investment metrics
- 1% rule
- 1.31% ✓
- Cap rate
- 10.39%
- Cash-on-cash
- 14.64%
- DSCR
- 1.65
- GRM
- 6.4
CMA / ARV
- ARV (on-the-fly)
- $49,400
- Comps found
- 1
Show comp detail 1 sale within ~0.75 mi
| Address | Dist | Beds/Ba | Sqft | Sold | Price | $/sf | Match |
|---|---|---|---|---|---|---|---|
| 813 Robin St | 0.35mi | 2/1.0 (+1) | 969 (+2%) | 18mo | $50,000 | $52 | 60 |
Match score weights: distance 35% · size 25% · config 20% · recency 20%. Top-matched comps best support the ARV.
Projected returns pro-forma
-3.0% appreciation · 3.0% rent growth · sell at horizon
- IRR
- 1.3%
- Equity multiple
- 1.05×
- Total profit
- $1,379
- Equity at exit
- $14,910
- IRR
- 11.0%
- Equity multiple
- 1.86×
- Total profit
- $24,011
- Equity at exit
- $8,646
Cash invested: $28,000 (down + closing). Projections, not guarantees.
Landlord ↔ Tenant lean methodology
- Overall (STATE)
- 90 Strongly Landlord-Friendly
- State Louisiana
- 90 Strongly Landlord-Friendly · R+12
- County
- — inherits STATE
- City
- — inherits STATE
ZIP-level market 70068
- Home prices YoY
- -20.1%
- Active inventory
- 180
- Price-to-rent
- 6.4×
Monthly cashflow live
- Estimated rent
- $1,307 medium interval (Pro) →
- Mortgage (P&I)
- −$524
- Tax est. 1.5%
- −$125 /mo · $1,500/yr
- Insurance
- −$42
- Flood insurance flood zone
- −$66 /mo · $798/yr
- HOA
- −$0
- Vacancy / Maint / Mgmt
- −$275
- Net cashflow
- $275
Break-even live
UW: 25.0% down · 7.5% · 30yr · 1.5% tax · 5.0% vac · 8.0% maint · 8.0% mgmt
Financing live
Cash to close
- Down payment
- $25,000
- Closing costs
- $3,000
- Reserves months
- —
- Total cash needed
- —
Loan-product check · same deal, 3 products live
Conventional
25% down · 7.5% · 30yr
- Down + closing
- —
- Monthly P&I
- —
- Monthly cashflow
- —
- DSCR
- —
- Eligible?
- —
Personal DTI + credit; lowest rate.
DSCR
20% down · 8.5% · 30yr
- Down + closing
- —
- Monthly P&I
- —
- Monthly cashflow
- —
- DSCR
- —
- Eligible?
- —
No personal income docs; deal must DSCR.
Hard money
10% down · 12.0% · 12mo
- Down + closing
- —
- Monthly P&I
- —
- Monthly cashflow
- —
- DSCR
- —
- Eligible?
- —
Short-term bridge; refi at stabilization.
Listing history 8 events
-
2026-06-19days on market $100,000 Active 8 DOM
-
2026-06-18days on market $100,000 Active 7 DOM
-
2026-06-17days on market $100,000 Active 6 DOM
-
2026-06-16days on market $100,000 Active 5 DOM
-
2026-06-15days on market $100,000 Active 4 DOM
-
2026-06-14days on market $100,000 Active 2 DOM
-
2026-06-13remarks 264-char remark
-
2026-06-13$100,000 Active 1 DOM
ⓘ Source: listings_history table (triggers on properties + properties_extension) + one-shot
backfill from property_details.listing_events for pre-trigger history.
Climate risk First Street
- Flood 8/10 Severe FEMA zone X (shaded) · 99% chance over 30 yrs
- Wildfire 1/10 Low
- Heat 9/10 Extreme 7 d/yr ≥108°F today · 21 d/yr by 30 yrs out
- Wind 9/10 Extreme 99% chance of damaging wind over 30 yrs
- Air quality 3/10 Moderate 2 unhealthy d/yr today · 3 by 30 yrs out
Nearby sold comps map
Loading sold comps map…
Walkable amenities ~0.75 mi
Loading nearby amenities…
Taxation est. · year 1
- Rental income
- $15,686
- − Mortgage interest
- −$5,602
- − Property taxes
- −$1,500
- − Insurance
- −$1,298
- − Repairs & maintenance
- −$1,255
- − Management
- −$1,255
- − Depreciation
- −$2,909
- Taxable income
- $1,868
- Est. tax owed @ 24.0%
- −$448
- After-tax cash flow
- $2,853/yr
For passive investors: Depreciation is non-cash, so a rental often shows a tax loss while cash-flowing — sheltering income. Rental losses are passive: they offset passive income freely, and up to $25,000/yr can offset ordinary (W-2) income if you actively participate and your MAGI is under $100k (phasing out to $0 by $150k); unused losses carry forward. On sale, claimed depreciation is recaptured at up to 25%, and gains may owe capital-gains tax (a 1031 exchange can defer both). Figures are a year-1 estimate at your 24.0% rate — not tax advice; consult a CPA.
Schools (NCES district)
- District
- St. John The Baptist Parish
- NCES district ID
- 2201530
- Math proficiency
- 13% ▼ -42.00%
- Reading proficiency
- 25% ▼ -39.00%
- Median HH income
- $50,280
- Composite
- 17.07/100
- National rank
- #9120
- State rank
- #68 of 98 in LA
Livability — Laplace
- Score
- 70/100
- State rank
- #61
- US rank
- #7898
Category grades
Schools grade is shown separately in the Schools card above.
Census & demographics
- Census place
- Laplace, LA
- County
- Saint John the Baptist Parish · 32,720 people
- Metro
- New Orleans-Metairie, LA
- Population (ZIP)
- 32,720
- Household income
- $68,459
- Rent vs Own
- Severe rent burden
- 750.0
Population outlook (St. John the Baptist County) Hauer SSP2
- Today (2025)
- 40,972 people
- By 2030
- 39,295 · -4.1%
- By 2040
- 35,902 · -12.4%
- By 2050
- 32,988 · -19.5%
- By 2075
- 28,661 · -30.0%
- By 2100
- 26,456 · -35.4%
Race, ethnicity, and origin ACS 2023
- Neighborhood character
- Diverse neighborhood (Simpson 0.62)
- Race & ethnicity
- Black 51% White 34% Hispanic / Latino 9% Two or more races 5% Asian 1%
- Hispanic origin (detail)
- Puerto Rican 1%
- Common ancestry
- Lithuanian 11%
- Foreign-born
- 5% · Canada
- Languages at home
- 91% English-only · Spanish 6% Tagalog/Filipino 1%
Political lean MEDSL · St. John the Baptist
- 2024 margin
- Strong D (+29.1) · D 64.0% · R 34.8% · Other 1.2%
- 2008→2024 swing
- +12.9pp toward D · 2008: 16.2pp · 2024: 29.1pp
- All cycles
- 2024: D+29.1 2020: D+28.2 2016: D+24.5 2012: D+26.3 2008: D+16.2
Not yet ingested
- Civics
- —
Market trends
- HPI YoY
- ▼ -60.04%
- Current HPI
- 239.1429
- Rent YoY
- —
- Metro
- New Orleans-Metairie, LA
- State GDP YoY
- ▲ 3.29%
- F500 in state
- 10
Industry mix (Fortune 500 HQ in LA)
| Industry | F500 HQs | Revenue |
|---|---|---|
| Telecommunications | 2 | $23B |
|
||
| Utilities | 1 | $12B |
|
||
| Wholesale / Distribution | 1 | $5B |
|
||
| Advertising | 1 | $2B |
|
||
Price history
+0.0% since first listed2 events — show timeline
- 2026-06-09 Listed $100,000 AcadianaMLS
- 2026-06-09 Listed $100,000 GSREIN
Property tax history
-31.7%/yrLatest (2025): $13 · +0.0% YoY. Source: county tax records.
Cash-flow waterfall
monthlySold comps — $/sqft
last 12 mo · ≤1 miLoading sold comps…