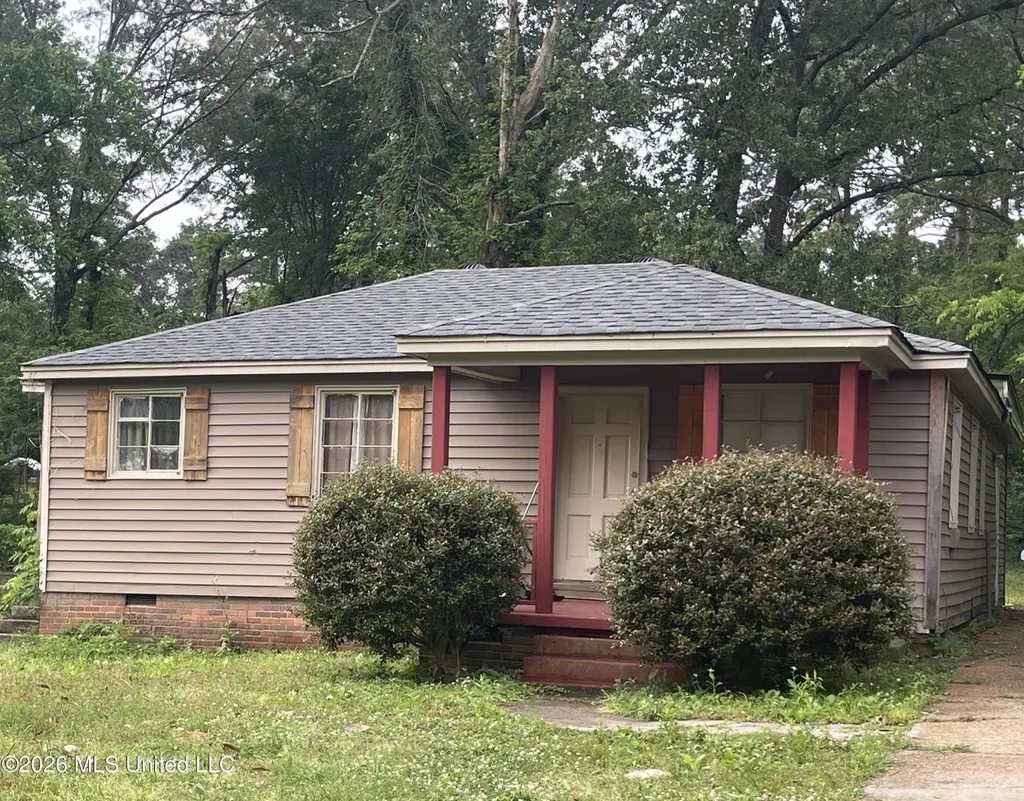
825 Combs St · Jackson, MS
Flood risk 1/10 · Minimal
- FEMA flood zone
- X (unshaded)
- Chance of flooding over 30 yrs
- 0.0%
- Est. flood insurance / yr
- $507 – $1,088
Fire risk 1/10 · Minimal
- Est. fire insurance / yr
- $1,241 – $2,305
Heat risk 6/10 · Moderate
- Hot days now (above 108°F)
- 6 days/yr
- Hot days in 30 yrs
- 17 days/yr
Wind risk 8/10 · Major
- Chance of severe wind over 30 yrs
- 80.0%
Air-quality risk 1/10 · Minimal
- Unhealthy air days now
- 0 days/yr
- Unhealthy air days in 30 yrs
- 0 days/yr
Risk factors via First Street. Map © Google.
Why this score? — see what drove the B+ grade
The composite is a weighted blend of 9 inputs, each scored 0–100. Each bar is that input's sub-score; the figure is the points it added to the 100-point composite (weight × sub-score).
- Cash flow +30.0/30.0
- 1% rule +10.0/10.0
- DSCR +10.0/10.0
- Appreciation +10.0/10.0
- ARV discount +7.5/15.0
- Rent growth +5.0/5.0
- Livability +3.4/5.0
- Condition / age +2.5/5.0
- Schools +1.1/10.0
$79,000
🖨 Deal sheet 📄 Offer letter ✓ Due diligence
Listing remarks MLS
PRIME INVESTMENT OPPORTUNITY Welcome to your next smart investment! This property has been well maintained, and is a golden opportunity for new or savvy investors. With little to no work needed, this gem offers both immediate returns and long-term potential. Don't miss out on this fantastic opportunity call your Realtor for a private tour.
Key facts
- Central air and heat
- Backyard
- 0.32 acre lot
Tags
Property features AI
Exterior
- Parking: Driveway
- Utilities: Public water; Public sewer; Electricity available
- Home design: Single family residence (house); One level
- Construction: Vinyl exterior; Architectural shingle roof; Conventional foundation; Built in public records (year built from public records)
- Exterior features: Front porch
Interior
- Kitchen: Free-standing electric range; Water heater
- Bathrooms: 2 bathrooms
- Heating & cooling: Central heating; Fireplace heating; Central air conditioning (electric)
- Interior features: Has fireplace located in the den; Move-in ready
- Laundry & utility: Washer hookup; Electric dryer hookup
Neighborhood map
What this means for you Summary
Snapshot
- This is a 3-bed/2.0-bath single-family listed at $79k.
Deal economics
- At list price, monthly cash flow is $441 ($5k/yr) — positive.
- The deal already cash-flows at list — no discount required.
- Meets the 1% rule at list price ($1k rent vs $79k).
- Recommended offer: $77k (3.0% below list) — sets the bar for market timing.
- Cap rate 13.0% vs local median 9.9% in Jackson — top-decile yield for the area; either an underpriced asset or a hidden risk that comps aren't pricing in. Stress-test before assuming the spread holds.
Location & tenants
- Location reads 68/100 on livability (#66 in MS) — a middle-class / working-renter tenant base. Strengths: commute A+, cost of living A+, housing A+; Watch: amenities F, employment F, health & safety F.
- Jackson Public School District (urban): math 9% / reading 18% proficiency, ranked #112 of 130 in MS (top 86%) — low school quality limits family demand, transient renter base, plan for 1-2y turnover; 88% free/reduced lunch — lower-income household profile, screen leases tightly.
- Zoned schools: Oak Forest Elementary School (math 2% / reading 12%, grade F, #337 of 375 statewide, top 94%, 318 students, 100% FRL); Whitten Middle School (math 4% / reading 11%, grade F, #168 of 179 statewide, top 94%, 338 students, 100% FRL); Wingfield High School (math 7% / reading 12%, grade F, #179 of 197 statewide, top 92%, 608 students, 100% FRL).
- Market conditions: Rents rising fast (+13.6%/yr); 121 active listings in the ZIP; 37 comparable units currently listed for rent nearby; rentals at typical pace (median 24d on market — plan ~3-4 weeks tenant-placement turnaround); lower-income renter base — watch delinquency; 167 units permitted in Hinds County in 2024 (0 in 5+ unit buildings).
Forward outlook
- In year one you build about $8k of equity ($546 loan paydown + $8k appreciation (10.0% local appreciation)).
- Hinds County population projected to shrink 6% by 2050 — rents likely to lag national; underwrite the cash flow, not the appreciation.
- At projected returns (10.0% appreciation + 8.0% rent growth), your $22k cash investment doubles in ~2 years — after that, you're playing with house money.
- By year 5, paydown + projected appreciation supports a ~$39k cash-out refi (75% LTV) — recoverable capital for the next deal without selling this one.
Negotiation context
- It's been on market 48 days — a 3% lower offer ($77k) is reasonable based on typical stale-listing flexibility.
- 4 sale attempts since 16y ago; this cycle's ask has dropped $6k (7%) from the opening price — seller is motivated, your offer sets the floor, not the list.
Risks & watch-outs
- Watch-outs: built in 1950 — expect roof / HVAC / electrical / plumbing capex.
- Climate carrying-cost: severe wind risk, 80% chance of damaging wind over 30y; extreme-heat days projected 6→17/yr by 2055 (HVAC capex compounding) — expect insurance premiums to compound above CPI over the hold.
Questions for the listing agent
- It's been on market 48 days. Have you received any prior offers? Is the seller open to a 3% concession, seller financing, or rate buy-down credit?
- Built in 1950 — when were the roof, HVAC, electrical panel, plumbing, and water heater last replaced?
- Is there a deadline driving the sale (1031 exchange, divorce, estate, relocation)? That informs how much negotiation room exists.
- Schools are F-rated, which usually means shorter tenancies and higher turnover. Who's the typical renter profile here, and what's been the actual vacancy rate?
- What's the average days-on-market for RENTAL listings here right now (not sales)? A rising rental-DOM trend means longer vacancies and softer asking-rent achievability than the comps imply.
- What's the recent tenant-quality profile in this submarket — average credit score on applications, eviction rate, late-payment / NSF rate, and stable-employment percentage? A property-management company in the area should have these aggregated.
- How much new for-sale + rental construction is in the pipeline within 1–3 miles? Heavy new supply typically softens prices + rents 12–24 months out; constrained supply supports both.
Investment metrics
- 1% rule
- 1.58% ✓
- Cap rate
- 12.99%
- Cash-on-cash
- 23.91%
- DSCR
- 2.06
- GRM
- 5.3
CMA / ARV
- ARV (median comp)
- $34,174
- List price
- $79,000
- Delta
- 131.17%
- Verdict
- OVERPRICED
- Comps
- 20 within 1.0 mi
Show comp detail 12 sales within ~0.75 mi
| Address | Dist | Beds/Ba | Sqft | Sold | Price | $/sf | Match |
|---|---|---|---|---|---|---|---|
| 837 Combs St | 0.04mi | 4/2.0 (+1) | 1,408 (-11%) | 1mo | $15,500 | $11 | 74 |
| 2555 Belvedere Dr | 0.32mi | 4/1.5 (+1) | 1,523 (-4%) | 3mo | $19,000 | $12 | 69 |
| 751 Dorgan St | 0.11mi | 3/2.0 | 1,400 (-12%) | 9mo | $39,000 | $28 | 68 |
| 1945 Camellia Ln | 0.49mi | 3/2.0 | 1,525 (-4%) | 5mo | $62,900 | $41 | 66 |
| 1136 Killarney St | 0.60mi | 4/2.0 (+1) | 1,608 (+1%) | 2mo | $45,500 | $28 | 64 |
| 1939 Shamrock Dr | 0.49mi | 4/2.0 (+1) | 1,554 (-2%) | 7mo | $45,000 | $29 | 63 |
| 2261 Paden St | 0.28mi | 3/2.0 | 1,369 (-14%) | 3mo | $70,000 | $51 | 62 |
| 931 Stuart St | 0.26mi | 3/2.0 | 1,363 (-14%) | 3mo | $32,500 | $24 | 62 |
| 2662 Key St | 0.57mi | 3/2.5 | 1,680 (+6%) | 1mo | $35,000 | $21 | 61 |
| 1941 Catalina Dr | 0.56mi | 3/1.5 | 1,458 (-8%) | 1mo | $85,000 | $58 | 58 |
| 2081 Shady Lane Dr | 0.55mi | 3/2.0 | 1,420 (-11%) | 4mo | $12,000 | $8 | 54 |
| 2232 Breckinridge Rd | 0.53mi | 3/2.0 | 1,794 (+13%) | 9mo | $85,000 | $47 | 46 |
Match score weights: distance 35% · size 25% · config 20% · recency 20%. Top-matched comps best support the ARV.
Projected returns pro-forma
10.0% appreciation · 8.0% rent growth · sell at horizon
- IRR
- 45.1%
- Equity multiple
- 4.51×
- Total profit
- $77,718
- Equity at exit
- $71,169
- IRR
- 41.2%
- Equity multiple
- 11.09×
- Total profit
- $223,192
- Equity at exit
- $153,480
Cash invested: $22,120 (down + closing). Projections, not guarantees.
Landlord ↔ Tenant lean methodology
- Overall (STATE)
- 90 Strongly Landlord-Friendly
- State Mississippi
- 90 Strongly Landlord-Friendly · R+11
- County
- — inherits STATE
- City
- — inherits STATE
ZIP-level market 39204
- Home prices YoY
- 8.0%
- Rents YoY
- 13.6%
- Active inventory
- 121
- Price-to-rent
- 5.3×
Monthly cashflow live
- Estimated rent
- $1,250 high interval (Pro) →
- Mortgage (P&I)
- −$414
- Tax from tax record
- −$99 /mo · $1,192/yr
- Insurance
- −$33
- HOA
- −$0
- Vacancy / Maint / Mgmt
- −$262
- Net cashflow
- $441
Break-even live
UW: 25.0% down · 7.5% · 30yr · 1.5% tax · 5.0% vac · 8.0% maint · 8.0% mgmt
Financing live
Cash to close
- Down payment
- $19,750
- Closing costs
- $2,370
- Reserves months
- —
- Total cash needed
- —
Loan-product check · same deal, 3 products live
Conventional
25% down · 7.5% · 30yr
- Down + closing
- —
- Monthly P&I
- —
- Monthly cashflow
- —
- DSCR
- —
- Eligible?
- —
Personal DTI + credit; lowest rate.
DSCR
20% down · 8.5% · 30yr
- Down + closing
- —
- Monthly P&I
- —
- Monthly cashflow
- —
- DSCR
- —
- Eligible?
- —
No personal income docs; deal must DSCR.
Hard money
10% down · 12.0% · 12mo
- Down + closing
- —
- Monthly P&I
- —
- Monthly cashflow
- —
- DSCR
- —
- Eligible?
- —
Short-term bridge; refi at stabilization.
Rent comps 37 comps
| Address | Beds | Baths | Sqft | Rent | $/sqft | DOM | Units | Dist |
|---|---|---|---|---|---|---|---|---|
| 843 Reaves St Jackson, MS | 3.0 | 2.0 | 1408 | $1,084 | $0.77 | 44d | 1 | 0.25mi |
| 2401 Coronet Pl Jackson, MS | 3.0 | 1.0 | 1200 | $1,400 | $1.17 | 23d | 1 | 0.30mi |
| 2242 Castle Hill Dr Jackson, MS | 4.0 | 2.0 | 1500 | $1,475 | $0.98 | 14d | 1 | 0.58mi |
| 2242 Castle Hill Dr Jackson, MS | 4.0 | 2.0 | 1500 | $1,475 | $0.98 | 23d | 1 | 0.58mi |
| 1848 Willaneel Dr Jackson, MS | 4.0 | 2.0 | 1623 | $1,100 | $0.68 | 14d | 1 | 0.63mi |
| 1126 Barbara Ann Dr Jackson, MS | 3.0 | 1.0 | 1343 | $1,000 | $0.74 | 14d | 1 | 0.72mi |
| 1126 Barbara Ann Dr Jackson, MS | 3.0 | 1.0 | 1343 | $1,000 | $0.74 | 44d | 1 | 0.72mi |
| 2729 Carleton St Jackson, MS | 4.0 | 2.0 | 1666 | $1,575 | $0.95 | 14d | 1 | 0.74mi |
| 245 Shady Cir Jackson, MS | 3.0 | 2.0 | 1510 | $1,100 | $0.73 | 23d | 1 | 0.86mi |
| 2694 Woodside Dr Jackson, MS | 3.0 | 1.0 | 1509 | $1,075 | $0.71 | 14d | 1 | 0.88mi |
| 2694 Woodside Dr Jackson, MS | 3.0 | 1.0 | 1509 | $1,075 | $0.71 | 23d | 1 | 0.88mi |
| 2732 Woodside Dr Jackson, MS | 4.0 | 2.0 | 1566 | $1,050 | $0.67 | 23d | 1 | 0.90mi |
| 201 W Santa Clair St Jackson, MS | 2.0 | 1.0 | 1182 | $950 | $0.80 | 14d | 1 | 0.93mi |
| 201 W Santa Clair St Jackson, MS | 2.0 | 1.0 | 1182 | $950 | $0.80 | 23d | 1 | 0.93mi |
| 1513 Maria Dr Jackson, MS | 3.0 | 2.0 | 1120 | $1,200 | $1.07 | 23d | 1 | 0.95mi |
| 1513 Maria Dr Jackson, MS | 3.0 | 2.0 | 1120 | $1,200 | $1.07 | 14d | 1 | 0.95mi |
| 2873 Teresa Dr Jackson, MS | 3.0 | 1.0 | 1100 | $1,100 | $1.00 | 44d | 1 | 0.97mi |
| 1645 Camellia Ln Jackson, MS | 3.0 | 2.0 | 1268 | $1,200 | $0.95 | 14d | 1 | 1.04mi |
| 3147 Bilgray Dr Jackson, MS | 3.0 | 2.0 | 1850 | $1,306 | $0.71 | 44d | 1 | 1.06mi |
| 316 Woody Dr Jackson, MS | 3.0 | 1.0 | 1185 | $1,250 | $1.05 | 14d | 1 | 1.06mi |
| 316 Woody Dr Jackson, MS | 3.0 | 1.0 | 1185 | $1,250 | $1.05 | 44d | 1 | 1.06mi |
| 3152 Bilgray Dr Jackson, MS | 3.0 | 1.5 | 1200 | $1,100 | $0.92 | 14d | 1 | 1.06mi |
| 1223 Marydale Dr Jackson, MS | 3.0 | 1.0 | 1300 | $950 | $0.73 | 44d | 1 | 1.07mi |
| 267 Woody Dr Jackson, MS | 3.0 | 1.5 | 1165 | $1,100 | $0.94 | 44d | 1 | 1.10mi |
| 125 Wingfield Ct Unit NA Jackson, MS | 4.0 | 2.0 | 1797 | $1,650 | $0.92 | 23d | 1 | 1.13mi |
| 3030 Oak Forest Dr Jackson, MS | 3.0 | 1.5 | 1200 | $1,100 | $0.92 | 44d | 1 | 1.23mi |
| 3030 Oak Forest Dr Jackson, MS | 3.0 | 2.0 | 1200 | $1,100 | $0.92 | 14d | 1 | 1.23mi |
| 427 McDowell Park Cir Jackson, MS | 3.0 | 1.5 | 1308 | $1,200 | $0.92 | 14d | 1 | 1.24mi |
| 3147 Shirley Dr Jackson, MS | 4.0 | 2.0 | 2137 | $1,425 | $0.67 | 44d | 1 | 1.31mi |
| 3147 Shirley Dr Jackson, MS | 4.0 | 2.0 | 2137 | $1,425 | $0.67 | 14d | 1 | 1.31mi |
| 3151 Shirley Dr Jackson, MS | 4.0 | 2.0 | 1474 | $1,306 | $0.89 | 14d | 1 | 1.32mi |
| 3122 Oak Forest Dr Jackson, MS | 3.0 | 2.0 | 1421 | $1,100 | $0.77 | 44d | 1 | 1.34mi |
| 360 Cooper Rd Jackson, MS | 4.0 | 2.0 | 1624 | $1,575 | $0.97 | 14d | 1 | 1.34mi |
| 3020 Lakewood Dr Jackson, MS | 4.0 | 2.0 | 1600 | $1,150 | $0.72 | 23d | 1 | 1.35mi |
| 2904 Marwood Dr Jackson, MS | 3.0 | 2.0 | 1554 | $1,250 | $0.80 | 23d | 1 | 1.38mi |
| 3162 Oak Forest Dr Jackson, MS | 3.0 | 1.5 | 1280 | $1,236 | $0.97 | 44d | 1 | 1.39mi |
| 3049 Lakewood Dr Jackson, MS | 3.0 | 1.0 | 1200 | $975 | $0.81 | 44d | 1 | 1.42mi |
Listing history 29 events
-
2026-06-18days on market $79,000 Active 48 DOM
-
2026-06-17days on market $79,000 Active 47 DOM
-
2026-06-16days on market $79,000 Active 46 DOM
-
2026-06-15days on market $79,000 Active 45 DOM
-
2026-06-14days on market $79,000 Active 43 DOM
-
2026-06-13days on market $79,000 Active 42 DOM
-
2026-06-10days on market $79,000 Active 40 DOM
-
2026-06-09days on market $79,000 Active 39 DOM
-
2026-06-08days on market $79,000 Active 38 DOM
-
2026-06-07days on market $79,000 Active 37 DOM
-
2026-06-05days on market $79,000 Active 34 DOM
-
2026-06-03days on market $79,000 Active 33 DOM
-
2026-06-02days on market $79,000 Active 32 DOM
-
2026-06-01pricedays on market $79,000 Active 31 DOM
-
2026-05-31days on market $85,000 Active 30 DOM
-
2026-05-30days on market $85,000 Active 29 DOM
-
2026-05-01$85,000 Active 1578-char remark
-
2023-11-02soldstatus Closed 342-char remark
Show marketing remark (342 chars)
PRIME INVESTMENT OPPORTUNITY Welcome to your next smart investment! This property has been well maintained, and is a golden opportunity for new or savvy investors. With little to no work needed, this gem offers both immediate returns and long-term potential. Don't miss out on this fantastic opportunity call your Realtor for a private tour.
-
2023-10-30soldstatus
-
2023-10-24status Pending 342-char remark
Show marketing remark (342 chars)
PRIME INVESTMENT OPPORTUNITY Welcome to your next smart investment! This property has been well maintained, and is a golden opportunity for new or savvy investors. With little to no work needed, this gem offers both immediate returns and long-term potential. Don't miss out on this fantastic opportunity call your Realtor for a private tour.
-
2023-10-20historical $725
Show marketing remark (342 chars)
PRIME INVESTMENT OPPORTUNITY Welcome to your next smart investment! This property has been well maintained, and is a golden opportunity for new or savvy investors. With little to no work needed, this gem offers both immediate returns and long-term potential. Don't miss out on this fantastic opportunity call your Realtor for a private tour.
-
2023-10-20$18,000 Active 342-char remark
Show marketing remark (342 chars)
PRIME INVESTMENT OPPORTUNITY Welcome to your next smart investment! This property has been well maintained, and is a golden opportunity for new or savvy investors. With little to no work needed, this gem offers both immediate returns and long-term potential. Don't miss out on this fantastic opportunity call your Realtor for a private tour.
-
2023-10-11$725
-
2011-06-08soldstatus
-
2011-04-20soldstatus
Show marketing remark (124 chars)
This 2 Bedroom 2 Bath home features: Living room, separate Den w/fireplace, Dining room, single garage and a Large Backyard.
-
2010-12-16$7,290
Show marketing remark (124 chars)
This 2 Bedroom 2 Bath home features: Living room, separate Den w/fireplace, Dining room, single garage and a Large Backyard.
-
2010-08-25soldstatus
-
1997-11-24soldstatus
-
1995-08-29soldstatus
ⓘ Source: listings_history table (triggers on properties + properties_extension) + one-shot
backfill from property_details.listing_events for pre-trigger history.
Tax reassessment forecast MS · Resets to sale price
- Current annual tax
- $1,192 · $99/mo
- Projected year-2 tax
- $1,192 · $99/mo
- Expected delta
- $0/yr ($0/mo · 0.0%)
ⓘ Screening estimate from a state-policy table — verify with the county assessor before closing.
Climate risk First Street
- Flood 1/10 Low FEMA zone X (unshaded) · 0% chance over 30 yrs
- Wildfire 1/10 Low
- Heat 6/10 Major 6 d/yr ≥108°F today · 17 d/yr by 30 yrs out
- Wind 8/10 Severe 80% chance of damaging wind over 30 yrs
- Air quality 1/10 Low 0 unhealthy d/yr today · 0 by 30 yrs out
Nearby sold comps map
Loading sold comps map…
Walkable amenities ~0.75 mi
Loading nearby amenities…
Taxation est. · year 1
- Rental income
- $14,996
- − Mortgage interest
- −$4,425
- − Property taxes
- −$1,192
- − Insurance
- −$395
- − Repairs & maintenance
- −$1,200
- − Management
- −$1,200
- − Depreciation
- −$2,298
- Taxable income
- $4,286
- Est. tax owed @ 24.0%
- −$1,029
- After-tax cash flow
- $4,260/yr
For passive investors: Depreciation is non-cash, so a rental often shows a tax loss while cash-flowing — sheltering income. Rental losses are passive: they offset passive income freely, and up to $25,000/yr can offset ordinary (W-2) income if you actively participate and your MAGI is under $100k (phasing out to $0 by $150k); unused losses carry forward. On sale, claimed depreciation is recaptured at up to 25%, and gains may owe capital-gains tax (a 1031 exchange can defer both). Figures are a year-1 estimate at your 24.0% rate — not tax advice; consult a CPA.
Schools (NCES district)
- District
- Jackson Public School District
- NCES district ID
- 2802190
- Math proficiency
- 9% ▼ -14.00%
- Reading proficiency
- 18% ▼ -7.00%
- Median HH income
- $33,234
- Composite
- 10.89/100
- National rank
- #9755
- State rank
- #112 of 130 in MS
Livability — Jackson
- Score
- 68/100
- State rank
- #66
- US rank
- #9695
Category grades
Schools grade is shown separately in the Schools card above.
Census & demographics
- Census place
- Jackson, MS
- County
- Hinds County · 167,040 people
- City population
- 140,204
- Metro
- Jackson, MS
- Population (ZIP)
- 13,249
- Household income
- $30,237
- Rent vs Own
- Severe rent burden
- 1099.0
Population outlook (Hinds County) Hauer SSP2
- Today (2025)
- 242,528 people
- By 2030
- 241,113 · -0.6%
- By 2040
- 235,557 · -2.9%
- By 2050
- 226,946 · -6.4%
- By 2075
- 199,995 · -17.5%
- By 2100
- 164,165 · -32.3%
Race, ethnicity, and origin ACS 2023
- Neighborhood character
- Predominantly Black (90%)
- Race & ethnicity
- Black 90% White 5% Two or more races 4% Hispanic / Latino 3%
- Foreign-born
- 2% · Canada
- Languages at home
- 97% English-only · Spanish 2%
Political lean MEDSL · Hinds
- 2024 margin
- Solid D (+46.1) · D 72.4% · R 26.3% · Other 1.4%
- 2008→2024 swing
- +7.1pp toward D · 2008: 39.0pp · 2024: 46.1pp
- All cycles
- 2024: D+46.1 2020: D+48.3 2016: D+43.7 2012: D+45.1 2008: D+39.0
Not yet ingested
- Civics
- —
Market trends
- HPI YoY
- ▲ 17.25%
- Current HPI
- 233.9061
- Rent YoY
- ▲ 13.56%
- Metro
- Jackson, MS
- State GDP YoY
- —
- F500 in state
- 0
Price history
+983.7% since first listed14 events — show timeline
- 2026-06-01 Price Changed $79,000 MLSU
- 2026-05-01 Listed $85,000 MLSU
- 2023-11-02 Sold (MLS) — MLSU
- 2023-10-30 Sold (Public Records) — Public Records
- 2023-10-24 Pending — MLSU
- 2023-10-20 Rental Removed $725 BUILDIUM
- 2023-10-20 Listed $18,000 MLSU
- 2023-10-11 Listed for Rent $725 BUILDIUM
- 2011-06-08 Sold (Public Records) — Public Records
- 2011-04-20 Sold (MLS) — MLSU
- 2010-12-16 Listed $7,290 MLSU
- 2010-08-25 Sold (Public Records) — Public Records
- 1997-11-24 Sold (Public Records) — Public Records
- 1995-08-29 Sold (Public Records) — Public Records
Property tax history
+0.5%/yrLatest (2025): $1,192 · +1.1% YoY. Source: county tax records.
Cash-flow waterfall
monthlySold comps — $/sqft
last 12 mo · ≤1 miLoading sold comps…