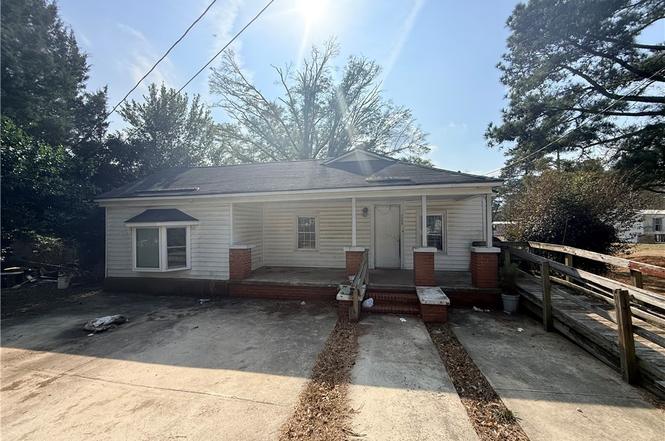
4205 Dwight Cir · Fayetteville, NC
Flood risk 1/10 · Minimal
- FEMA flood zone
- X (unshaded)
- Chance of flooding over 30 yrs
- 0.0%
- Est. flood insurance / yr
- $473 – $860
Fire risk 5/10 · Moderate
- Est. fire insurance / yr
- $906 – $1,684
Heat risk 7/10 · Major
- Hot days now (above 106°F)
- 7 days/yr
- Hot days in 30 yrs
- 16 days/yr
Wind risk 6/10 · Moderate
- Chance of severe wind over 30 yrs
- 74.0%
Air-quality risk 2/10 · Minimal
- Unhealthy air days now
- 0 days/yr
- Unhealthy air days in 30 yrs
- 1 days/yr
Risk factors via First Street. Map © Google.
Why this score? — see what drove the B grade
The composite is a weighted blend of 9 inputs, each scored 0–100. Each bar is that input's sub-score; the figure is the points it added to the 100-point composite (weight × sub-score).
- Cash flow +30.0/30.0
- 1% rule +10.0/10.0
- DSCR +10.0/10.0
- ARV discount +7.5/15.0
- Livability +3.8/5.0
- Rent growth +3.2/5.0
- Schools +3.1/10.0
- Condition / age +2.5/5.0
- Appreciation +0.0/10.0
$55,000
🖨 Deal sheet (PDF) 📄 Offer letter ✓ Due diligence
Listing remarks
Don't miss out on this hidden gem with over 3/4 acres. This ranch style home and storage building is awaiting your vision. This home located within 10 minutes of fayetteville State University and 15 minutes of Fort Bragg could become a showpiece for a personal residence or investment property. This is a blank slate at a price you wont want to miss. Home not habitable and needs repair… * * * AS IS/ SELLER WILL MAKE NO REPAIRS * * *
Key facts
- Built 1945
- Listed 112 days
Property features AI
Exterior
- Utilities: Other water source; Other sewer
- Home design: Single-family residence; One story
- Construction: Frame construction
- Exterior features: Subdivision: NONE; GPS directions accurate to the home
Interior
- Bedrooms: 6 total rooms (bedrooms not itemized)
- Flooring: Other flooring
- Bathrooms: 1 full bathroom
- Heating & cooling: Has heating; Other heating type
- Interior features: No fireplace; Other flooring
Neighborhood map
What this means for you Summary
Snapshot
- This is a 3-bed/1.0-bath single-family listed at $55k.
Deal economics
- At list price, monthly cash flow is $688 ($8k/yr) — positive.
- The deal already cash-flows at list — no discount required.
- Meets the 1% rule at list price ($1k rent vs $55k).
- Recommended offer: $50k (9.0% below list) — sets the bar for market timing.
- Cap rate 21.3% vs local median 4.8% in Fayetteville — top-decile yield for the area; either an underpriced asset or a hidden risk that comps aren't pricing in. Stress-test before assuming the spread holds.
Location & tenants
- Location reads 75/100 on livability (#45 in NC, #4,031 nationally) — a middle-class / working-renter tenant base. Strengths: commute A+, cost of living A+, housing A+; Watch: schools C-, crime F, employment D-.
- Cumberland County Schools (urban): math 32% / reading 41% proficiency, ranked #126 of 178 in NC (top 71%) — families likely to look elsewhere, expect single-tenant / working-renter base with shorter leases.
- Market conditions: Rents rising (+2.8%/yr); 362 active listings in the ZIP; 28 comparable units currently listed for rent nearby; rentals at typical pace (median 25d on market — plan ~3-4 weeks tenant-placement turnaround); 1,125 units permitted in Cumberland County in 2024 (104 in 5+ unit buildings).
Forward outlook
- Local home prices are declining (-3.0%/yr); year-one equity from $380 of loan paydown is wiped out by about $2k of value loss. Plan a longer hold.
- At projected returns (-3.0% appreciation + 2.8% rent growth), your $15k cash investment doubles in ~3 years — after that, you're playing with house money.
Negotiation context
- It's been on market 113 days — a 9% lower offer ($50k) is reasonable based on typical stale-listing flexibility.
- Current owner paid $33k; list at $55k implies a 67% gain — meaningful room to come down on a strong offer.
Risks & watch-outs
- Watch-outs: property tax is 2.9% of price; built in 1945 — expect roof / HVAC / electrical / plumbing capex.
- Climate carrying-cost: major wind risk, 74% chance of damaging wind over 30y; moderate wildfire risk; extreme-heat days projected 7→16/yr by 2055 (HVAC capex compounding) — expect insurance premiums to compound above CPI over the hold.
Questions for the listing agent
- It's been on market 113 days. Have you received any prior offers? Is the seller open to a 9% concession, seller financing, or rate buy-down credit?
- Built in 1945 — when were the roof, HVAC, electrical panel, plumbing, and water heater last replaced?
- Property tax is high relative to price — has the assessment been appealed recently, and will the sale trigger a re-assessment?
- Why hasn't it sold? Are there any deal-killer items the seller is aware of (foundation, flood, title, zoning, code violations)?
- Is there a deadline driving the sale (1031 exchange, divorce, estate, relocation)? That informs how much negotiation room exists.
- Crime grade is F in this area — have there been break-ins, vandalism, or insurance claims at this property in the last 3 years? What carrier currently insures it and at what premium?
- What's the average days-on-market for RENTAL listings here right now (not sales)? A rising rental-DOM trend means longer vacancies and softer asking-rent achievability than the comps imply.
- What's the recent tenant-quality profile in this submarket — average credit score on applications, eviction rate, late-payment / NSF rate, and stable-employment percentage? A property-management company in the area should have these aggregated.
- How much new for-sale + rental construction is in the pipeline within 1–3 miles? Heavy new supply typically softens prices + rents 12–24 months out; constrained supply supports both.
Investment metrics
- 1% rule
- 2.61% ✓
- Cap rate
- 21.31%
- Cash-on-cash
- 53.63%
- DSCR
- 3.39
- GRM
- 3.2
CMA / ARV
- ARV (on-the-fly)
- $169,360
- Comps found
- 9
Show comp detail 9 sales within ~0.75 mi
| Address | Dist | Beds/Ba | Sqft | Sold | Price | $/sf | Match |
|---|---|---|---|---|---|---|---|
| 1661 Veanna Dr | 0.66mi | 3/2.0 | 1,163 (+0%) | 3mo | $145,000 | $125 | 63 |
| 2558 Sourwood Dr | 0.71mi | 3/2.0 | 1,137 (-2%) | 2mo | $193,000 | $170 | 58 |
| 5212 Delco St | 0.70mi | 3/1.5 | 1,095 (-6%) | 1mo | $174,000 | $159 | 55 |
| 1713 Veanna Dr | 0.64mi | 3/2.0 | 1,212 (+4%) | 10mo | $185,000 | $153 | 51 |
| 1600 Veanna Dr | 0.73mi | 3/2.0 | 1,266 (+9%) | 10mo | $185,000 | $146 | 39 |
| 1677 Veanna Dr | 0.62mi | 3/2.0 | 1,331 (+15%) | 7mo | $192,000 | $144 | 37 |
| 205 Waddell Dr | 0.69mi | 3/1.0 | 990 (-15%) | 10mo | $125,500 | $127 | 35 |
| 5200 Delco Dr | 0.65mi | 3/2.0 | 1,040 (-10%) | 19mo | $181,500 | $175 | 33 |
| 217 Waddell Dr | 0.73mi | 3/1.0 | 1,000 (-14%) | 24mo | $102,000 | $102 | 23 |
Match score weights: distance 35% · size 25% · config 20% · recency 20%. Top-matched comps best support the ARV.
Projected returns pro-forma
-3.0% appreciation · 2.82% rent growth · sell at horizon
- IRR
- 51.6%
- Equity multiple
- 3.25×
- Total profit
- $34,721
- Equity at exit
- $8,201
- IRR
- 56.8%
- Equity multiple
- 6.58×
- Total profit
- $85,862
- Equity at exit
- $4,755
Cash invested: $15,400 (down + closing). Projections, not guarantees.
Landlord ↔ Tenant lean methodology
- Overall (STATE)
- 85 Strongly Landlord-Friendly
- State North Carolina
- 85 Strongly Landlord-Friendly · R+3
- County
- — inherits STATE
- City
- — inherits STATE
ZIP-level market 28311
- Home prices YoY
- -18.4%
- Rents YoY
- 2.8%
- Active inventory
- 362
- Price-to-rent
- 3.2×
Monthly cashflow live
- Estimated rent
- $1,433 high interval (Pro) →
- Mortgage (P&I)
- −$288
- Tax from tax record
- −$132 /mo · $1,588/yr
- Insurance
- −$23
- HOA
- −$0
- Vacancy / Maint / Mgmt
- −$301
- Net cashflow
- $688
Break-even live
Sensitivity live
| Price | -10% $719 | -5% $704 | +0% $688 | +5% $673 | +10% $657 |
|---|---|---|---|---|---|
| Rent | -10% $575 | -5% $632 | +0% $688 | +5% $745 | +10% $801 |
| Rate | -1.0pp $716 | -0.5pp $702 | base $688 | +0.5pp $674 | +1.0pp $659 |
UW: 25.0% down · 7.5% · 30yr · 1.5% tax · 5.0% vac · 8.0% maint · 8.0% mgmt
Financing live
Cash to close
- Down payment
- $13,750
- Closing costs
- $1,650
- Reserves months
- —
- Total cash needed
- —
Loan-product check · same deal, 3 products live
Conventional
25% down · 7.5% · 30yr
- Down + closing
- —
- Monthly P&I
- —
- Monthly cashflow
- —
- DSCR
- —
- Eligible?
- —
Personal DTI + credit; lowest rate.
DSCR
20% down · 8.5% · 30yr
- Down + closing
- —
- Monthly P&I
- —
- Monthly cashflow
- —
- DSCR
- —
- Eligible?
- —
No personal income docs; deal must DSCR.
Hard money
10% down · 12.0% · 12mo
- Down + closing
- —
- Monthly P&I
- —
- Monthly cashflow
- —
- DSCR
- —
- Eligible?
- —
Short-term bridge; refi at stabilization.
Rent comps 28 comps
| Address | Beds | Baths | Sqft | Rent | $/sqft | DOM | Units | Dist |
|---|---|---|---|---|---|---|---|---|
| 1216 Superior Pointe Pl Fayetteville, NC | 3.0 | 2.5 | 1288 | $1,450 | $1.13 | 24d | 1 | 0.65mi |
| 3613 Pine Lake Dr Fayetteville, NC | 1.0–3.0 | 1.0–2.0 | 1116 | $1,645 | $1.47 | 15d | 31 | 0.78mi |
| 3446 Sandystone Cir Fayetteville, NC | 3.0 | 2.5 | 1489 | $1,700 | $1.14 | 24d | 1 | 0.92mi |
| 1907 Eichelberger Dr Fayetteville, NC | 3.0 | 2.0 | 1463 | $1,650 | $1.13 | 24d | 1 | 0.94mi |
| 848 Tamarack Dr Fayetteville, NC | 1.0–2.0 | 1.0 | 705 | $1,171 | $1.66 | 15d | 49 | 0.94mi |
| 1404 Hibiscus Rd Fayetteville, NC | 3.0 | 1.5 | 1418 | $1,350 | $0.95 | 22d | 1 | 0.95mi |
| 927 Fiske Dr Fayetteville, NC | 3.0 | 1.0 | 926 | $1,200 | $1.30 | 24d | 1 | 0.96mi |
| 1014 Enclave Dr Fayetteville, NC | 1.0–3.0 | 1.0–2.0 | 1112 | $1,685 | $1.52 | 15d | 19 | 0.98mi |
| 5523 Livingston Dr Fayetteville, NC | 4.0 | 1.5 | 1305 | $1,600 | $1.23 | 24d | 1 | 1.00mi |
| 1615 Morehead Ave Fayetteville, NC | 3.0 | 2.0 | 1073 | $1,400 | $1.30 | 24d | 1 | 1.01mi |
| 1350 Shaw Rd Fayetteville, NC | 3.0 | 2.0 | 1339 | $1,399 | $1.04 | 15d | 1 | 1.02mi |
| 4310 Coolidge St Fayetteville, NC | 3.0 | 1.5 | 1212 | $1,250 | $1.03 | 15d | 1 | 1.14mi |
| 3523 Rosehill Rd Fayetteville, NC | 4.0 | 1.0 | 1448 | $1,450 | $1.00 | 15d | 1 | 1.14mi |
| 1156 Acorn St Fayetteville, NC | 2.0 | 1.0 | 800 | $1,000 | $1.25 | 24d | 1 | 1.15mi |
| 5745 Holland St Fayetteville, NC | 3.0 | 1.0 | 1140 | $1,650 | $1.45 | 24d | 1 | 1.16mi |
| 715 Ashburton Dr Fayetteville, NC | 3.0 | 2.0 | 1278 | $1,600 | $1.25 | 24d | 1 | 1.18mi |
| 4206 S Dowfield Dr Fayetteville, NC | 2.0 | 1.0 | 900 | $895 | $0.99 | 24d | 1 | 1.18mi |
| 4202 S Dowfield Dr Fayetteville, NC | 2.0 | 1.0 | 800 | $930 | $1.16 | 24d | 1 | 1.18mi |
| 1808 Tryon Dr Fayetteville, NC | 2.0 | 2.0 | 1066 | $995 | $0.93 | 24d | 1 | 1.19mi |
| 733 Ashburton Dr Fayetteville, NC | 3.0 | 1.5 | 1118 | $1,300 | $1.16 | 24d | 1 | 1.20mi |
| 844 Anita Rd Fayetteville, NC | 2.0 | 1.0 | 850 | $850 | $1.00 | 15d | 1 | 1.26mi |
| 1882 Tryon Dr #4 Fayetteville, NC | 2.0 | 2.0 | 1063 | $1,100 | $1.03 | 15d | 1 | 1.28mi |
| 1861 Tryon Dr Unit 3 Fayetteville, NC | 2.0 | 2.0 | 1050 | $995 | $0.95 | 24d | 1 | 1.28mi |
| 1849 Tryon Dr Fayetteville, NC | 2.0 | 2.0 | 1061 | $998 | $0.94 | 24d | 2 | 1.34mi |
| 3963 Loufield Dr Fayetteville, NC | 3.0 | 2.0 | 1446 | $1,500 | $1.04 | 24d | 1 | 1.36mi |
| 1909 Tryon Dr #7 Fayetteville, NC | 2.0 | 2.0 | 1060 | $1,050 | $0.99 | 24d | 1 | 1.40mi |
| 4420 Blanton Rd Unit 4420-H Fayetteville, NC | 2.0 | 1.5 | 990 | $1,025 | $1.04 | 15d | 1 | 1.40mi |
| 3318 Rogers Dr Fayetteville, NC | 3.0 | 2.0 | 1392 | $1,750 | $1.26 | 15d | 1 | 1.49mi |
Listing history 21 events
-
2026-06-21days on market $55,000 Active 113 DOM
-
2026-06-18days on market $55,000 Active 110 DOM
-
2026-06-17days on market $55,000 Active 109 DOM
-
2026-06-16days on market $55,000 Active 108 DOM
-
2026-06-15days on market $55,000 Active 107 DOM
-
2026-06-14days on market $55,000 Active 105 DOM
-
2026-06-13days on market $55,000 Active 104 DOM
-
2026-06-10days on market $55,000 Active 102 DOM
-
2026-06-09days on market $55,000 Active 101 DOM
-
2026-06-08days on market $55,000 Active 100 DOM
-
2026-06-07days on market $55,000 Active 99 DOM
-
2026-06-03days on market $55,000 Active 95 DOM
-
2026-06-02days on market $55,000 Active 94 DOM
-
2026-06-01days on market $55,000 Active 93 DOM
-
2026-05-31days on market $55,000 Active 92 DOM
-
2026-05-30days on market $55,000 Active 91 DOM
-
2026-05-16price $55,000
-
2026-04-16price $64,995
-
2026-02-27$65,000 Active
-
2002-04-03soldstatus $33,000
-
1993-02-15soldstatus $9,000
ⓘ Source: listings_history table (triggers on properties + properties_extension) + one-shot
backfill from property_details.listing_events for pre-trigger history.
Tax reassessment forecast NC · Resets to sale price
- Current annual tax
- $1,588 · $132/mo
- Projected year-2 tax
- $1,588 · $132/mo
- Expected delta
- $0/yr ($0/mo · 0.0%)
ⓘ Screening estimate from a state-policy table — verify with the county assessor before closing.
Climate risk First Street
- Flood 1/10 Low FEMA zone X (unshaded) · 0% chance over 30 yrs
- Wildfire 5/10 Major
- Heat 7/10 Severe 7 d/yr ≥106°F today · 16 d/yr by 30 yrs out
- Wind 6/10 Major 74% chance of damaging wind over 30 yrs
- Air quality 2/10 Low 0 unhealthy d/yr today · 1 by 30 yrs out
Nearby sold comps map
Loading sold comps map…
Walkable amenities ~0.75 mi
Loading nearby amenities…
Taxation est. · year 1
- Rental income
- $17,193
- − Mortgage interest
- −$3,081
- − Property taxes
- −$1,588
- − Insurance
- −$275
- − Repairs & maintenance
- −$1,375
- − Management
- −$1,375
- − Depreciation
- −$1,600
- Taxable income
- $7,898
- Est. tax owed @ 24.0%
- −$1,896
- After-tax cash flow
- $6,363/yr
For passive investors: Depreciation is non-cash, so a rental often shows a tax loss while cash-flowing — sheltering income. Rental losses are passive: they offset passive income freely, and up to $25,000/yr can offset ordinary (W-2) income if you actively participate and your MAGI is under $100k (phasing out to $0 by $150k); unused losses carry forward. On sale, claimed depreciation is recaptured at up to 25%, and gains may owe capital-gains tax (a 1031 exchange can defer both). Figures are a year-1 estimate at your 24.0% rate — not tax advice; consult a CPA.
Schools (NCES district)
- District
- Cumberland County Schools
- NCES district ID
- 3700011
- Math proficiency
- 32% ▼ -2.00%
- Reading proficiency
- 41% ▼ -1.00%
- Median HH income
- $44,168
- Composite
- 31.0/100
- National rank
- #6096
- State rank
- #126 of 178 in NC
Livability — Fayetteville
- Score
- 75/100
- State rank
- #45
- US rank
- #4031
Category grades
Schools grade is shown separately in the Schools card above.
Census & demographics
- Census place
- Fayetteville, NC
- County
- Cumberland County · 265,314 people
- City population
- 226,118
- Metro
- Fayetteville, NC
- Population (ZIP)
- 36,629
- Household income
- $62,170
- Rent vs Own
- Severe rent burden
- 1645.0
Population outlook (Cumberland County) Hauer SSP2
- Today (2025)
- 330,855 people
- By 2030
- 333,523 · +0.8%
- By 2040
- 335,583 · +1.4%
- By 2050
- 335,325 · +1.4%
- By 2075
- 342,853 · +3.6%
- By 2100
- 340,698 · +3.0%
Race, ethnicity, and origin ACS 2023
- Neighborhood character
- Diverse neighborhood (Simpson 0.67)
- Race & ethnicity
- Black 42% White 38% Hispanic / Latino 9% Two or more races 8% Asian 3% Native American 1%
- Hispanic origin (detail)
- Mexican 3% Puerto Rican 4%
- Common ancestry
- Slovak 1% Lithuanian 1% Italian 1%
- Foreign-born
- 7% · Canada, South Korea, Jamaica
- Languages at home
- 89% English-only · Spanish 6% German/W. Germanic 1% Other Indo-European 1%
Political lean MEDSL · Cumberland
- 2024 margin
- D (+13.4) · D 56.1% · R 42.7% · Other 1.2%
- 2008→2024 swing
- -4.3pp toward R · 2008: 17.7pp · 2024: 13.4pp
- All cycles
- 2024: D+13.4 2020: D+16.6 2016: D+16.0 2012: D+19.7 2008: D+17.7
Not yet ingested
- Civics
- —
Market trends
- HPI YoY
- ▼ -45.88%
- Current HPI
- 203.0731
- Rent YoY
- ▲ 2.82%
- Metro
- Fayetteville, NC
- State GDP YoY
- ▲ 3.28%
- F500 in state
- 26
Industry mix (Fortune 500 HQ in NC)
| Industry | F500 HQs | Revenue |
|---|---|---|
| Financial Services | 2 | $213B |
|
||
| Retail | 2 | $95B |
|
||
| Industrial Conglomerate | 1 | $38B |
|
||
| Metals / Steel | 1 | $35B |
|
||
| Utilities | 1 | $30B |
|
||
| Industrial Machinery | 1 | $19B |
|
||
Price history
+511.1% since first listed5 events — show timeline
- 2026-05-16 Price Changed $55,000 LPRMLS
- 2026-04-16 Price Changed $64,995 LPRMLS
- 2026-02-27 Listed $65,000 LPRMLS
- 2002-04-03 Sold (Public Records) $33,000 Public Records
- 1993-02-15 Sold (Public Records) $9,000 Public Records
Property tax history
+5.5%/yrLatest (2025): $1,588 · +18.0% YoY. Source: county tax records.
Cash-flow waterfall
monthlySold comps — $/sqft
last 12 mo · ≤1 miLoading sold comps…