 Duplex
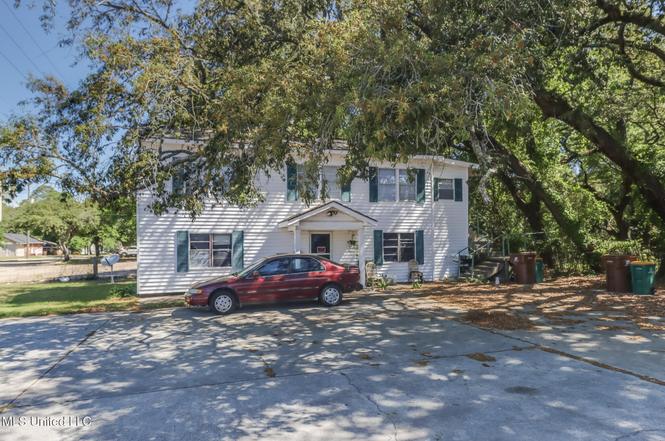
308 Rodenberg Ave · Biloxi, MS
Flood risk 1/10 · Minimal
- FEMA flood zone
- X (unshaded)
- Chance of flooding over 30 yrs
- 0.0%
- Est. flood insurance / yr
- $507 – $1,088
Fire risk 1/10 · Minimal
- Est. fire insurance / yr
- $1,241 – $2,305
Heat risk 10/10 · Severe
- Hot days now (above 106°F)
- 7 days/yr
- Hot days in 30 yrs
- 22 days/yr
Wind risk 9/10 · Severe
- Chance of severe wind over 30 yrs
- 99.0%
Air-quality risk 2/10 · Minimal
- Unhealthy air days now
- 1 days/yr
- Unhealthy air days in 30 yrs
- 2 days/yr
Risk factors via First Street. Map © Google.
Why this score? — see what drove the B grade
The composite is a weighted blend of 9 inputs, each scored 0–100. Each bar is that input's sub-score; the figure is the points it added to the 100-point composite (weight × sub-score).
- Cash flow +30.0/30.0
- 1% rule +10.0/10.0
- DSCR +10.0/10.0
- ARV discount +7.5/15.0
- Schools +4.5/10.0
- Livability +4.0/5.0
- Rent growth +2.5/5.0
- Condition / age +2.5/5.0
- Appreciation +0.0/10.0
$120,000
🖨 Deal sheet 📄 Offer letter ✓ Due diligence
Multi-family units
County records classify this as Multi-Family (2-4 Unit). Listing-text estimate: 2 units. confirmed
Listing remarks MLS
Investment Property, cash cow, located near Keesler Air Force Base, excellent location!! Each unit currently rents for $425 per month per unit, with paying tenants. Tenant pays electric, cable, trash, and owner pays water. Property is north of HW 90 and north of RR tracks. Sold as is where is.
Key facts
- Fully leased duplex
- 3,484 sq ft lot
- Built 1969
Tags
Neighborhood map
What this means for you Summary
Snapshot
- This is a 2 × 1-bed/1.0-bath units multifamily listed at $120k.
Deal economics
- At list price, monthly cash flow is $893 ($11k/yr) — positive. Per door: $446/mo.
- The deal already cash-flows at list — no discount required.
- Meets the 1% rule at list price ($2k rent vs $120k).
- Recommended offer: $106k (12.0% below list) — sets the bar for market timing.
- Cap rate 15.2% vs local median 3.5% in Biloxi — top-decile yield for the area; either an underpriced asset or a hidden risk that comps aren't pricing in. Stress-test before assuming the spread holds.
Location & tenants
- Location reads 79/100 on livability (#6 in MS, #2,141 nationally) — a middle-class / working-renter tenant base. Strengths: crime A+, cost of living A+, housing A+; Watch: commute D+, amenities F, employment D-.
- Biloxi Public School District (urban): math 60% / reading 48% proficiency, ranked #7 of 130 in MS (top 5%) — acceptable for families but not a draw, mixed tenant base, ~2y average lease.
- Market conditions: Rents flat; 201 active listings in the ZIP; 16 comparable units currently listed for rent nearby; rentals at typical pace (median 21d on market — plan ~3-4 weeks tenant-placement turnaround); 2,194 units permitted in Harrison County in 2024 (0 in 5+ unit buildings).
- At $2,066/mo this rent would consume 46% of the median local household income ($54k/yr) (locally 1110% of renters already pay >50% of income on rent) — very limited rent-growth headroom before tenants either downsize or default.
Forward outlook
- Local home prices are declining (-3.0%/yr); year-one equity from $830 of loan paydown is wiped out by about $4k of value loss. Plan a longer hold.
- Harrison County population projected at +27% by 2050 — long-run rental-demand tailwind backs the buy-and-hold thesis.
- At projected returns (-3.0% appreciation + 0.1% rent growth), your $34k cash investment doubles in ~5 years — after that, you're playing with house money.
Negotiation context
- It's been on market 291 days — a 12% lower offer ($106k) is reasonable based on typical stale-listing flexibility.
- 4 sale attempts since 14y ago; this cycle's ask has dropped $35k (23%) from the opening price — seller is motivated, your offer sets the floor, not the list.
Risks & watch-outs
- Climate carrying-cost: severe wind risk, 99% chance of damaging wind over 30y; extreme-heat days projected 7→22/yr by 2055 (HVAC capex compounding) — expect insurance premiums to compound above CPI over the hold.
Questions for the listing agent
- It's been on market 291 days. Have you received any prior offers? Is the seller open to a 12% concession, seller financing, or rate buy-down credit?
- Can we see the unit-by-unit rent roll, current vacancy, and any below-market leases? What's the average tenancy length?
- What capital expenditures (roof, boiler, parking lot, exteriors) have been made in the last 5 years, and what's planned in the next 2?
- Built in 1969 — when were the roof, HVAC, electrical panel, plumbing, and water heater last replaced?
- Why hasn't it sold? Are there any deal-killer items the seller is aware of (foundation, flood, title, zoning, code violations)?
- Is there a deadline driving the sale (1031 exchange, divorce, estate, relocation)? That informs how much negotiation room exists.
- What's the average days-on-market for RENTAL listings here right now (not sales)? A rising rental-DOM trend means longer vacancies and softer asking-rent achievability than the comps imply.
- What's the recent tenant-quality profile in this submarket — average credit score on applications, eviction rate, late-payment / NSF rate, and stable-employment percentage? A property-management company in the area should have these aggregated.
- How much new apartment / multifamily construction is in the pipeline within 1–3 miles? Heavy new supply (>2% of stock underway) typically softens rents 12–24 months out; light construction supports rent growth.
Investment metrics
- 1% rule
- 1.72% ✓
- Cap rate
- 15.22%
- Cash-on-cash
- 31.88%
- DSCR
- 2.42
- GRM
- 4.8
CMA / ARV
No comps found within radius.
Projected returns pro-forma
-3.0% appreciation · 0.05% rent growth · sell at horizon
- IRR
- 23.6%
- Equity multiple
- 1.94×
- Total profit
- $31,419
- Equity at exit
- $17,892
- IRR
- 29.7%
- Equity multiple
- 3.30×
- Total profit
- $77,415
- Equity at exit
- $10,375
Cash invested: $33,600 (down + closing). Projections, not guarantees.
Landlord ↔ Tenant lean methodology
- Overall (STATE)
- 90 Strongly Landlord-Friendly
- State Mississippi
- 90 Strongly Landlord-Friendly · R+11
- County
- — inherits STATE
- City
- — inherits STATE
ZIP-level market 39531
- Home prices YoY
- -13.0%
- Rents YoY
- 0.1%
- Active inventory
- 201
- Price-to-rent
- 9.7×
Monthly cashflow live
- Estimated rent
- $2,066 medium interval (Pro) →
- Mortgage (P&I)
- −$629
- Tax from tax record
- −$60 /mo · $724/yr
- Insurance
- −$50
- HOA
- −$0
- Vacancy / Maint / Mgmt
- −$434
- Net cashflow
- $893
Break-even live
2-unit breakdown (identical units grouped — click to expand)
| Units | Beds | Baths | Est. rent |
|---|---|---|---|
| 2× units | 1 | 1 | $2,066 |
| #1 | 1 | 1 | $1,033 |
| #2 | 1 | 1 | $1,033 |
| Total (2 units) | $2,066 | ||
UW: 25.0% down · 7.5% · 30yr · 1.5% tax · 5.0% vac · 8.0% maint · 8.0% mgmt
Financing live
Cash to close
- Down payment
- $30,000
- Closing costs
- $3,600
- Reserves months
- —
- Total cash needed
- —
Loan-product check · same deal, 3 products live
Conventional
25% down · 7.5% · 30yr
- Down + closing
- —
- Monthly P&I
- —
- Monthly cashflow
- —
- DSCR
- —
- Eligible?
- —
Personal DTI + credit; lowest rate.
DSCR
20% down · 8.5% · 30yr
- Down + closing
- —
- Monthly P&I
- —
- Monthly cashflow
- —
- DSCR
- —
- Eligible?
- —
No personal income docs; deal must DSCR.
Hard money
10% down · 12.0% · 12mo
- Down + closing
- —
- Monthly P&I
- —
- Monthly cashflow
- —
- DSCR
- —
- Eligible?
- —
Short-term bridge; refi at stabilization.
Rent comps 16 comps
| Address | Beds | Baths | Sqft | Rent | $/sqft | DOM | Units | Dist |
|---|---|---|---|---|---|---|---|---|
| 1616 Gordon Ave Biloxi, MS | 3.0 | 1.0 | 900 | $1,425 | $1.58 | 21d | 1 | 0.22mi |
| 1702 Stevens St Biloxi, MS | 1.0 | 1.0 | 800 | $750 | $0.94 | 43d | 1 | 0.36mi |
| 1713 Stevens St Unit A Biloxi, MS | 3.0 | 2.0 | 1100 | $1,300 | $1.18 | 21d | 1 | 0.39mi |
| 245 Mc Donnell Ave Unit E-131 Biloxi, MS | 2.0 | 1.0 | 745 | $995 | $1.34 | 43d | 1 | 0.49mi |
| 245 Mc Donnell Ave Unit I-164 Biloxi, MS | 2.0 | 1.0 | 745 | $1,195 | $1.60 | 43d | 1 | 0.49mi |
| 245 Mc Donnell Ave Unit G-147 Biloxi, MS | 1.0 | 1.0 | 608 | $1,500 | $2.47 | 21d | 1 | 0.49mi |
| 245 Mc Donnell Ave Biloxi, MS | 2.0 | 1.0 | 775 | $1,595 | $2.06 | 21d | 1 | 0.54mi |
| 1664 Beach Blvd Biloxi, MS | 1.0–2.0 | 1.0–1.5 | 801 | $2,100 | $2.62 | 13d | 2 | 0.56mi |
| 1667 Irish Hill Dr Biloxi, MS | 1.0–2.0 | 1.0–1.5 | 862 | $1,049 | $1.22 | 13d | 1 | 0.57mi |
| 1664 Beach Blvd Biloxi, MS | 2.0 | 1.5 | 985 | $2,295 | $2.33 | 43d | 1 | 0.57mi |
| 122 Coral Breeze Dr Biloxi, MS | 3.0 | 1.5 | 1000 | $2,700 | $2.70 | 43d | 1 | 0.59mi |
| 118 Coral Breeze Dr Biloxi, MS | 3.0 | 1.5 | 1000 | $2,800 | $2.80 | 13d | 1 | 0.67mi |
| 150 Pat Harrison St Biloxi, MS | 2.0 | 1.0 | 673 | $1,025 | $1.52 | 43d | 1 | 0.81mi |
| 1496 Beach Blvd Biloxi, MS | 2.0 | 1.5 | 1100 | $1,450 | $1.32 | 13d | 1 | 0.94mi |
| 1910 Southern Ave Biloxi, MS | 1.0–2.0 | 1.0–1.5 | 725 | $1,200 | $1.66 | 13d | 2 | 0.99mi |
| 330 Belvedere Dr Biloxi, MS | 3.0 | 1.0 | 1000 | $1,200 | $1.20 | 13d | 1 | 1.10mi |
Listing history 11 events
-
2026-03-21status Pending
-
2026-03-06price $120,000
-
2025-12-05status Active
-
2025-12-05price $135,000
-
2025-11-06historical
-
2025-05-05$155,000 Active
-
2017-07-18soldstatus
-
2014-02-07soldstatus 294-char remark
Show marketing remark (294 chars)
Investment Property, cash cow, located near Keesler Air Force Base, excellent location!! Each unit currently rents for $425 per month per unit, with paying tenants. Tenant pays electric, cable, trash, and owner pays water. Property is north of HW 90 and north of RR tracks. Sold as is where is.
-
2013-11-05historical
-
2013-10-30$55,900 294-char remark
Show marketing remark (294 chars)
Investment Property, cash cow, located near Keesler Air Force Base, excellent location!! Each unit currently rents for $425 per month per unit, with paying tenants. Tenant pays electric, cable, trash, and owner pays water. Property is north of HW 90 and north of RR tracks. Sold as is where is.
-
2012-09-18$50,000
ⓘ Source: listings_history table (triggers on properties + properties_extension) + one-shot
backfill from property_details.listing_events for pre-trigger history.
Tax reassessment forecast MS · Resets to sale price
- Current annual tax
- $724 · $60/mo
- Projected year-2 tax
- $948 · $79/mo
- Expected delta
- +$224/yr (+$19/mo · 30.9%)
ⓘ Screening estimate from a state-policy table — verify with the county assessor before closing.
Climate risk First Street
- Flood 1/10 Low FEMA zone X (unshaded) · 0% chance over 30 yrs
- Wildfire 1/10 Low
- Heat 10/10 Extreme 7 d/yr ≥106°F today · 22 d/yr by 30 yrs out
- Wind 9/10 Extreme 99% chance of damaging wind over 30 yrs
- Air quality 2/10 Low 1 unhealthy d/yr today · 2 by 30 yrs out
Nearby sold comps map
Loading sold comps map…
Walkable amenities ~0.75 mi
Loading nearby amenities…
Taxation est. · year 1
- Rental income
- $24,792
- − Mortgage interest
- −$6,722
- − Property taxes
- −$724
- − Insurance
- −$600
- − Repairs & maintenance
- −$1,983
- − Management
- −$1,983
- − Depreciation
- −$3,491
- Taxable income
- $9,288
- Est. tax owed @ 24.0%
- −$2,229
- After-tax cash flow
- $8,481/yr
For passive investors: Depreciation is non-cash, so a rental often shows a tax loss while cash-flowing — sheltering income. Rental losses are passive: they offset passive income freely, and up to $25,000/yr can offset ordinary (W-2) income if you actively participate and your MAGI is under $100k (phasing out to $0 by $150k); unused losses carry forward. On sale, claimed depreciation is recaptured at up to 25%, and gains may owe capital-gains tax (a 1031 exchange can defer both). Figures are a year-1 estimate at your 24.0% rate — not tax advice; consult a CPA.
Schools (NCES district)
- District
- Biloxi Public School District
- NCES district ID
- 2800630
- Math proficiency
- 60% ▼ -7.00%
- Reading proficiency
- 48% ▼ -3.00%
- Median HH income
- $40,608
- Composite
- 45.26/100
- National rank
- #2657
- State rank
- #7 of 130 in MS
Livability — Biloxi
- Score
- 79/100
- State rank
- #6
- US rank
- #2141
Category grades
Schools grade is shown separately in the Schools card above.
Census & demographics
- Census place
- Biloxi, MS
- County
- Harrison County · 178,171 people
- City population
- 63,281
- Metro
- Gulfport-Biloxi, MS
- Population (ZIP)
- 18,918
- Household income
- $54,218
- Rent vs Own
- Severe rent burden
- 1110.0
Population outlook (Harrison County) Hauer SSP2
- Today (2025)
- 228,444 people
- By 2030
- 241,942 · +5.9%
- By 2040
- 267,531 · +17.1%
- By 2050
- 291,062 · +27.4%
- By 2075
- 346,711 · +51.8%
- By 2100
- 378,165 · +65.5%
Race, ethnicity, and origin ACS 2023
- Neighborhood character
- Diverse neighborhood (Simpson 0.60)
- Race & ethnicity
- White 60% Black 18% Two or more races 12% Hispanic / Latino 11% Asian 2%
- Hispanic origin (detail)
- Mexican 5%
- Common ancestry
- Lithuanian 6% Slovak 2% Serbian 1%
- Foreign-born
- 8% · Canada, Vietnam
- Languages at home
- 89% English-only · Spanish 6% Arabic 1% Other Indo-European 1%
Political lean MEDSL · Harrison
- 2024 margin
- Strong R (+28.9) · D 35.0% · R 63.9% · Other 1.1%
- 2008→2024 swing
- -2.9pp toward R · 2008: -26.0pp · 2024: -28.9pp
- All cycles
- 2024: R+28.9 2020: R+25.2 2016: R+30.7 2012: R+26.6 2008: R+26.0
Not yet ingested
- Civics
- —
Market trends
- HPI YoY
- ▼ -28.97%
- Current HPI
- 193.4018
- Rent YoY
- ▬ 0.05%
- Metro
- Gulfport-Biloxi, MS
- State GDP YoY
- —
- F500 in state
- 0
Price history
+140.0% since first listed11 events — show timeline
- 2026-03-21 Pending — MLSU
- 2026-03-06 Price Changed $120,000 MLSU
- 2025-12-05 Relisted — MLSU
- 2025-12-05 Price Changed $135,000 MLSU
- 2025-11-06 Listing Removed — MLSU
- 2025-05-05 Listed $155,000 MLSU
- 2017-07-18 Sold (Public Records) — Public Records
- 2014-02-07 Sold (MLS) — MLSU
- 2013-11-05 Listing Removed — MLSU
- 2013-10-30 Listed $55,900 MLSU
- 2012-09-18 Listed $50,000 MLSU
Property tax history
+1.2%/yrLatest (2025): $724 · +4.5% YoY. Source: county tax records.
Cash-flow waterfall
monthlySold comps — $/sqft
last 12 mo · ≤1 miLoading sold comps…