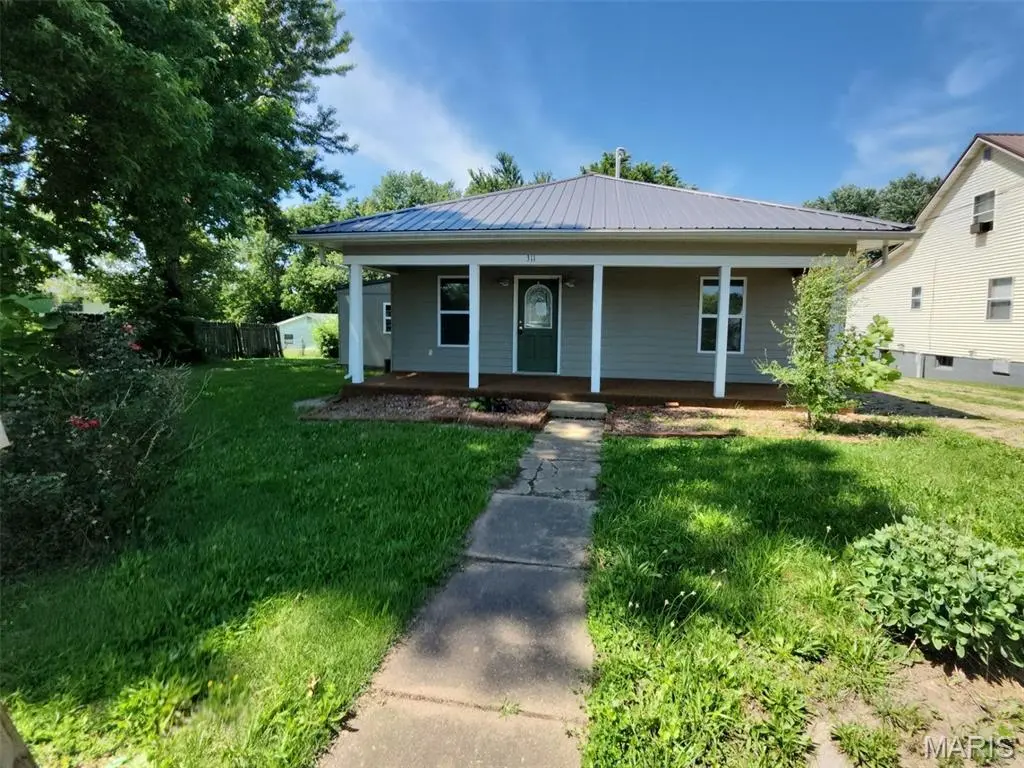
311 High St · Park Hills, MO
Flood risk 1/10 · Minimal
- FEMA flood zone
- X (unshaded)
- Chance of flooding over 30 yrs
- 0.0%
- Est. flood insurance / yr
- $507 – $1,088
Fire risk 3/10 · Minor
- Est. fire insurance / yr
- $1,054 – $1,958
Heat risk 5/10 · Moderate
- Hot days now (above 104°F)
- 7 days/yr
- Hot days in 30 yrs
- 21 days/yr
Wind risk 2/10 · Minimal
- Chance of severe wind over 30 yrs
- 1.0%
Air-quality risk 1/10 · Minimal
- Unhealthy air days now
- 0 days/yr
- Unhealthy air days in 30 yrs
- 0 days/yr
Risk factors via First Street. Map © Google.
Why this score? — see what drove the D grade
The composite is a weighted blend of 9 inputs, each scored 0–100. Each bar is that input's sub-score; the figure is the points it added to the 100-point composite (weight × sub-score).
- Cash flow +14.7/30.0
- ARV discount +7.5/15.0
- DSCR +4.5/10.0
- Schools +3.4/10.0
- 1% rule +2.9/10.0
- Livability +2.9/5.0
- Rent growth +2.5/5.0
- Condition / age +2.5/5.0
- Appreciation +1.3/10.0
$139,900
🖨 Deal sheet 📄 Offer letter ✓ Due diligence
Listing remarks MLS
Are you looking for a three-bedroom two and a half bath home in central school district at a great price??? This property is perfect for any first-time home buyer. When you walk in you will fall in love with the oversized living room and the abundance of space this home has to offer. This property has had many updates done to it recently, of which include a new roof, flooring, drywall, paint, light fixtures, bathrooms and much much more. This property offers approximately 1335+/- sqft of living space and even comes on .315 of an acre of property. There is even a one car attached car port to keep your vehicle out of the weather. Deals like this do not come around very often. Schedule your showing today before it's too late.
Key facts
- 0.31 acre lot
- Parking
- Built 1920
Property features AI
Exterior
- Parking: Carport with 1 space
- Utilities: Public water; Public sewer; Electric service by Ameren
- Home design: Single-family residence; One story; Residential property
- Construction: Vinyl siding
- Exterior features: Front porch; Level lot
Interior
- Bedrooms: 3 bedrooms on the main level
- Bathrooms: 2 full bathrooms; 1 half bathroom
- Heating & cooling: Electric forced air heating; Wall/window cooling units
- Interior features: Crawl space basement; 9 total rooms
Neighborhood map
What this means for you Summary
Snapshot
- This is a 2-bed/1.0-bath other listed at $140k.
Deal economics
- At list price, monthly cash flow is $37 ($442/yr) — positive.
- The deal already cash-flows at list — no discount required.
- To meet the 1% rule (rent ≥ 1% of price), the offer needs to be $111k (20.7% below list).
- Recommended offer: $111k (20.7% below list) — sets the bar for 1% rule.
Location & tenants
- Location reads 58/100 on livability (#585 in MO) — a working-class tenant base; expect higher turnover. Strengths: cost of living A+, housing A+, crime B; Watch: amenities F, commute F, employment F.
- Central R-III (town): math 36% / reading 45% proficiency, ranked #150 of 324 in MO (top 46%) — families likely to look elsewhere, expect single-tenant / working-renter base with shorter leases.
- Zoned schools: Central Elem. (555 students, 62% FRL); Central High (math 52% / reading 62%, grade C, #51 of 521 statewide, top 11%, 629 students, 52% FRL).
- Zoned-school proficiency averages 57% at this address vs 40% district-wide (+16 pts) — the actual schools serving this property are materially stronger than the Central R-III average implies; a family-tenant draw the district grade alone would hide.
- Market conditions: 73 active listings in the ZIP; 134 units permitted in St. Francois County in 2024 (32 in 5+ unit buildings).
Forward outlook
- Local home prices are declining (-3.0%/yr); year-one equity from $967 of loan paydown is wiped out by about $4k of value loss. Plan a longer hold.
Negotiation context
- Only 2 days on market — expect competitive offers; lowballing is unlikely to land.
- 2 sale attempts since 2y ago with the ask held roughly flat each time — persistent listings suggest the price (not the market) is what's stuck; bring a comps-based counter.
Risks & watch-outs
- Watch-outs: built in 1920 — expect roof / HVAC / electrical / plumbing capex.
- Climate carrying-cost: extreme-heat days projected 7→21/yr by 2055 (HVAC capex compounding) — expect insurance premiums to compound above CPI over the hold.
Questions for the listing agent
- Built in 1920 — when were the roof, HVAC, electrical panel, plumbing, and water heater last replaced?
- Is there a deadline driving the sale (1031 exchange, divorce, estate, relocation)? That informs how much negotiation room exists.
- Schools are D-rated, which usually means shorter tenancies and higher turnover. Who's the typical renter profile here, and what's been the actual vacancy rate?
- The area grade is low — what's the realistic commute time and amenity access for the typical tenant pool here? Any planned neighborhood developments (good or bad) we should know about?
- What's the average days-on-market for RENTAL listings here right now (not sales)? A rising rental-DOM trend means longer vacancies and softer asking-rent achievability than the comps imply.
- What's the recent tenant-quality profile in this submarket — average credit score on applications, eviction rate, late-payment / NSF rate, and stable-employment percentage? A property-management company in the area should have these aggregated.
- How much new for-sale + rental construction is in the pipeline within 1–3 miles? Heavy new supply typically softens prices + rents 12–24 months out; constrained supply supports both.
Investment metrics
- 1% rule
- 0.79% ✗
- Cap rate
- 6.61%
- Cash-on-cash
- 1.13%
- DSCR
- 1.05
- GRM
- 10.5
CMA / ARV
No comps found within radius.
Projected returns pro-forma
-3.0% appreciation · 3.0% rent growth · sell at horizon
- IRR
- -14.6%
- Equity multiple
- 0.48×
- Total profit
- $-20,383
- Equity at exit
- $20,860
- IRR
- -5.9%
- Equity multiple
- 0.62×
- Total profit
- $-14,975
- Equity at exit
- $12,096
Cash invested: $39,172 (down + closing). Projections, not guarantees.
Landlord ↔ Tenant lean methodology
- Overall (STATE)
- 81 Strongly Landlord-Friendly
- State Missouri
- 81 Strongly Landlord-Friendly · R+10
- County
- — inherits STATE
- City
- — inherits STATE
ZIP-level market 63601
- Home prices YoY
- -2.6%
- Active inventory
- 73
- Price-to-rent
- 10.5×
Monthly cashflow live
- Estimated rent
- $1,109 medium interval (Pro) →
- Mortgage (P&I)
- −$734
- Tax from tax record
- −$47 /mo · $569/yr
- Insurance
- −$58
- HOA
- −$0
- Vacancy / Maint / Mgmt
- −$233
- Net cashflow
- $37
Break-even live
UW: 25.0% down · 7.5% · 30yr · 1.5% tax · 5.0% vac · 8.0% maint · 8.0% mgmt
Financing live
Cash to close
- Down payment
- $34,975
- Closing costs
- $4,197
- Reserves months
- —
- Total cash needed
- —
Loan-product check · same deal, 3 products live
Conventional
25% down · 7.5% · 30yr
- Down + closing
- —
- Monthly P&I
- —
- Monthly cashflow
- —
- DSCR
- —
- Eligible?
- —
Personal DTI + credit; lowest rate.
DSCR
20% down · 8.5% · 30yr
- Down + closing
- —
- Monthly P&I
- —
- Monthly cashflow
- —
- DSCR
- —
- Eligible?
- —
No personal income docs; deal must DSCR.
Hard money
10% down · 12.0% · 12mo
- Down + closing
- —
- Monthly P&I
- —
- Monthly cashflow
- —
- DSCR
- —
- Eligible?
- —
Short-term bridge; refi at stabilization.
Listing history 3 events
-
2026-06-18days on market $139,900 Active 2 DOM
-
2026-06-17remarks 498-char remark
-
2026-06-17$139,900 Active 1 DOM
ⓘ Source: listings_history table (triggers on properties + properties_extension) + one-shot
backfill from property_details.listing_events for pre-trigger history.
Tax reassessment forecast MO · Resets to sale price
- Current annual tax
- $569 · $47/mo
- Projected year-2 tax
- $1,357 · $113/mo
- Expected delta
- +$788/yr (+$66/mo · 138.3%)
ⓘ Screening estimate from a state-policy table — verify with the county assessor before closing.
Climate risk First Street
- Flood 1/10 Low FEMA zone X (unshaded) · 0% chance over 30 yrs
- Wildfire 3/10 Moderate
- Heat 5/10 Major 7 d/yr ≥104°F today · 21 d/yr by 30 yrs out
- Wind 2/10 Low 100% chance of damaging wind over 30 yrs
- Air quality 1/10 Low 0 unhealthy d/yr today · 0 by 30 yrs out
Nearby sold comps map
Loading sold comps map…
Walkable amenities ~0.75 mi
Loading nearby amenities…
Taxation est. · year 1
- Rental income
- $13,310
- − Mortgage interest
- −$7,837
- − Property taxes
- −$569
- − Insurance
- −$700
- − Repairs & maintenance
- −$1,065
- − Management
- −$1,065
- − Depreciation
- −$4,070
- Taxable loss
- −$1,995
- Est. tax savings @ 24.0%
- +$479
- After-tax cash flow
- $921/yr
For passive investors: Depreciation is non-cash, so a rental often shows a tax loss while cash-flowing — sheltering income. Rental losses are passive: they offset passive income freely, and up to $25,000/yr can offset ordinary (W-2) income if you actively participate and your MAGI is under $100k (phasing out to $0 by $150k); unused losses carry forward. On sale, claimed depreciation is recaptured at up to 25%, and gains may owe capital-gains tax (a 1031 exchange can defer both). Figures are a year-1 estimate at your 24.0% rate — not tax advice; consult a CPA.
Schools (NCES district)
- District
- Central R-III
- NCES district ID
- 2929170
- Math proficiency
- 36% ▼ -6.00%
- Reading proficiency
- 45% ▼ -4.00%
- Median HH income
- $36,745
- Composite
- 33.61/100
- National rank
- #5410
- State rank
- #150 of 324 in MO
Livability — Park Hills
- Score
- 58/100
- State rank
- #585
- US rank
- #20779
Category grades
Schools grade is shown separately in the Schools card above.
Census & demographics
- Census place
- Park Hills, MO
- Population (ZIP)
- 16,434
Population outlook (St. Francois County) Hauer SSP2
- Today (2025)
- 68,683 people
- By 2030
- 69,574 · +1.3%
- By 2040
- 70,665 · +2.9%
- By 2050
- 70,708 · +2.9%
- By 2075
- 67,917 · -1.1%
- By 2100
- 56,563 · -17.6%
Race, ethnicity, and origin ACS 2023
- Neighborhood character
- Predominantly White (92%)
- Race & ethnicity
- White 92% Two or more races 6% Hispanic / Latino 3%
- Common ancestry
- Lithuanian 2% Italian 2% Romanian 2%
- Foreign-born
- 0%
Political lean MEDSL · St. Francois
- 2024 margin
- Solid R (+51.4) · D 23.8% · R 75.2%
- 2008→2024 swing
- -46.8pp toward R · 2008: -4.6pp · 2024: -51.4pp
- All cycles
- 2024: R+51.4 2020: R+48.1 2016: R+45.4 2012: R+19.5 2008: R+4.6
Not yet ingested
- Civics
- —
Market trends
- HPI YoY
- ▼ -7.30%
- Current HPI
- 278.5365
- Rent YoY
- —
- Metro
- —
- State GDP YoY
- ▲ 1.84%
- F500 in state
- 20
Industry mix (Fortune 500 HQ in MO)
| Industry | F500 HQs | Revenue |
|---|---|---|
| Healthcare | 1 | $163B |
|
||
| Insurance | 1 | $21B |
|
||
| Industrial Technology | 1 | $17B |
|
||
| Retail | 1 | $16B |
|
||
| Industrial Distribution | 1 | $10B |
|
||
| Utilities | 1 | $9B |
|
||
Price history
+0.0% since first listed7 events — show timeline
- 2026-06-16 Listed $139,900 MARIS as Distributed by MLS Grid
- 2024-05-30 Sold (Public Records) — Public Records
- 2024-05-23 Sold (MLS) — MARIS as Distributed by MLS Grid
- 2024-03-27 Pending — MARIS as Distributed by MLS Grid
- 2024-03-21 Price Changed $129,900 MARIS as Distributed by MLS Grid
- 2024-03-09 Listed $139,900 MARIS as Distributed by MLS Grid
- 2023-03-21 Sold (Public Records) — Public Records
Property tax history
+2.2%/yrLatest (2025): $569 · +9.0% YoY. Source: county tax records.
Cash-flow waterfall
monthlySold comps — $/sqft
last 12 mo · ≤1 miLoading sold comps…