 35-Plex
725 W College Ave · Santa Rosa, CA
Flood risk 5/10 · Moderate
- FEMA flood zone
- X (unshaded)
- Chance of flooding over 30 yrs
- 0.47%
- Est. flood insurance / yr
- $507 – $1,088
Fire risk 1/10 · Minimal
- Est. fire insurance / yr
- $659 – $1,223
Heat risk 4/10 · Minor
- Hot days now (above 92°F)
- 7 days/yr
- Hot days in 30 yrs
- 16 days/yr
Wind risk 1/10 · Minimal
- Chance of severe wind over 30 yrs
- —
Air-quality risk 8/10 · Major
- Unhealthy air days now
- 15 days/yr
- Unhealthy air days in 30 yrs
- 17 days/yr
Risk factors via First Street. Map © Google.
Why this score? — see what drove the D grade
The composite is a weighted blend of 9 inputs, each scored 0–100. Each bar is that input's sub-score; the figure is the points it added to the 100-point composite (weight × sub-score).
- Cash flow +14.0/30.0
- ARV discount +7.5/15.0
- DSCR +4.2/10.0
- Livability +3.8/5.0
- Schools +3.7/10.0
- 1% rule +3.1/10.0
- Condition / age +2.5/5.0
- Rent growth +2.2/5.0
- Appreciation +0.0/10.0
$11,800,000
🖨 Deal sheet (PDF) 📄 Offer letter ✓ Due diligence
Multi-family units
County records classify this as Multi-Family (5+ Unit). Listing-text estimate: 35 units. confirmed
5+ unit building — per-unit beds/baths from public records are typically unavailable; the breakdown below (if shown) is an estimate from the listing text.
Listing remarks MLS
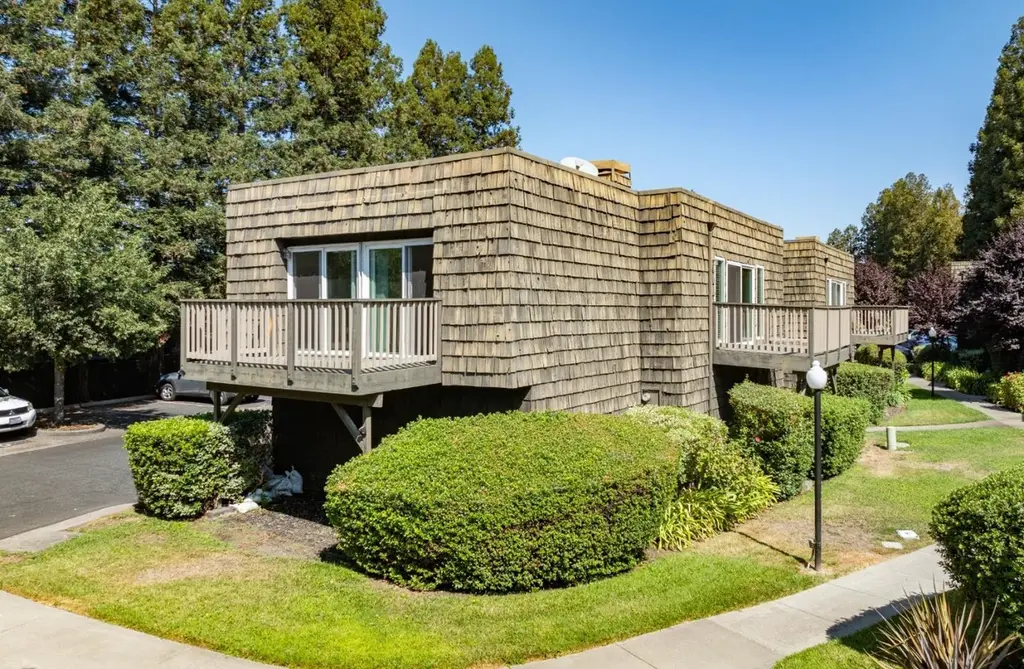
Cedarwood Apartments is a 35-unit, condo-mapped multifamily community on 2.80 acres in central Santa Rosa, offered for purchase individually or as a portfolio with North Street Apartments (1570 North Street, Santa Rosa) The property features a 3BR-heavy unit mix 25 three-bed/2.5-bath townhome-style units averaging 1,230 SF and 10 two-bed flats with individual furnaces, individual hot water heaters, attached garages, and a pool. In-place rents average $2,854, leaving 9% of mark-to-market upside ($253/unit) and an additional $268/unit achievable through interior renovations and exterior siding upgrades. The condo map provides flexible long-term exit optionality. 97% occupied and immediate proximity to Santa Rosa Plaza, Highway 101, and Downtown Santa Rosa.
Key facts
- Individual furnaces
- 2.80 acres
- 35 unit community
Tags
Property features AI
Finance
- Other: Living area reported as 39,250; Property primary ID: 744540
- Financial info: 35-unit complex; Annual rental income: $1,187,215; Annual gross income: $1,156,616; Gross scheduled income: $1,204,808; Other income: $17,593; Total expenses: $459,690; Other expenses: $79,813; Utility expenses: $152,592; Vacancy factor: 4%; Gross rent multiplier: 9.79
Exterior
- Parking: Attached and covered parking; 35 garage spaces
- Utilities: Public water; Public sewer; Individual electric meters; Individual gas meters; Primary and separate meters for electric, gas, and water
- Home design: Multi-building property with 10 buildings; Zoning: CITYSR
- Construction: Crawl space foundation
- Exterior features: Flat/low pitch roof; In-ground pool; Tenant-paid utilities for electric and gas
Interior
- Bedrooms: 10 units with 2 bedrooms; 25 units with 3 bedrooms
- Bathrooms: 2-bedroom units include 1 full bath; 3-bedroom units include 2 full baths and 1 half bath
- Heating & cooling: Wall furnace heating; Cooling: Other (see remarks)
- Interior features: Security features noted (see remarks)
Neighborhood map
What this means for you Summary
Snapshot
- This is a 25×3bd/2.5ba + 10×2bd/1ba units multifamily listed at $11.80M.
Deal economics
- At list price, monthly cash flow is $1k ($17k/yr) — positive. Per door: $41/mo.
- The deal already cash-flows at list — no discount required.
- To meet the 1% rule (rent ≥ 1% of price), the offer needs to be $9.54M (19.1% below list).
- Recommended offer: $9.54M (19.1% below list) — sets the bar for 1% rule.
- Cap rate 6.4% vs local median 2.5% in Santa Rosa — top-decile yield for the area; either an underpriced asset or a hidden risk that comps aren't pricing in. Stress-test before assuming the spread holds.
Location & tenants
- Location reads 75/100 on livability (#112 in CA, #3,940 nationally) — a middle-class / working-renter tenant base. Strengths: amenities A+, commute A+, employment A+; Watch: cost of living F.
- Santa Rosa High (urban): math 31% / reading 47% proficiency, ranked #703 of 1,400 in CA (top 50%) — families likely to look elsewhere, expect single-tenant / working-renter base with shorter leases.
- Zoned schools: Helen M. Lehman Elementary (411 students, 59% FRL); Hilliard Comstock Middle (434 students, 60% FRL); Piner High (1,361 students, 51% FRL) — zoned schools average 57% FRL vs 22% district-wide (35 pts higher); higher-poverty schools than district average — tighter screening recommended.
- Market conditions: Rents soft (-1.4%/yr); 79 active listings in the ZIP; solid renter incomes; 1,039 units permitted in Sonoma County in 2024 (185 in 5+ unit buildings).
- At $95,416/mo this rent would consume 1223% of the median local household income ($94k/yr) (locally 1525% of renters already pay >50% of income on rent) — very limited rent-growth headroom before tenants either downsize or default.
Forward outlook
- Local home prices are declining (-3.0%/yr); year-one equity from $82k of loan paydown is wiped out by about $354k of value loss. Plan a longer hold.
- Sonoma County population projected at +8% by 2050 — modest demand growth; plan on rents tracking national, not racing it.
Negotiation context
- It's been on market 40 days — a 3% lower offer ($11.45M) is reasonable based on typical stale-listing flexibility.
- 2 sale attempts with the ask held roughly flat each time — persistent listings suggest the price (not the market) is what's stuck; bring a comps-based counter.
- Current owner paid $6.10M; list at $11.80M implies a 93% gain — meaningful room to come down on a strong offer.
Risks & watch-outs
- Climate carrying-cost: moderate flood risk — expect insurance premiums to compound above CPI over the hold.
Questions for the listing agent
- It's been on market 40 days. Have you received any prior offers? Is the seller open to a 19% concession, seller financing, or rate buy-down credit?
- Can we see the unit-by-unit rent roll, current vacancy, and any below-market leases? What's the average tenancy length?
- What capital expenditures (roof, boiler, parking lot, exteriors) have been made in the last 5 years, and what's planned in the next 2?
- Is there a deadline driving the sale (1031 exchange, divorce, estate, relocation)? That informs how much negotiation room exists.
- The area grade is low — what's the realistic commute time and amenity access for the typical tenant pool here? Any planned neighborhood developments (good or bad) we should know about?
- What's the average days-on-market for RENTAL listings here right now (not sales)? A rising rental-DOM trend means longer vacancies and softer asking-rent achievability than the comps imply.
- What's the recent tenant-quality profile in this submarket — average credit score on applications, eviction rate, late-payment / NSF rate, and stable-employment percentage? A property-management company in the area should have these aggregated.
- How much new apartment / multifamily construction is in the pipeline within 1–3 miles? Heavy new supply (>2% of stock underway) typically softens rents 12–24 months out; light construction supports rent growth.
Investment metrics
- 1% rule
- 0.81% ✗
- Cap rate
- 6.44%
- Cash-on-cash
- 0.52%
- DSCR
- 1.02
- GRM
- 10.3
CMA / ARV
No comps found within radius.
Projected returns pro-forma
-3.0% appreciation · 0.0% rent growth · sell at horizon
- IRR
- -18.6%
- Equity multiple
- 0.36×
- Total profit
- $-2,104,489
- Equity at exit
- $1,759,418
- IRR
- -17.8%
- Equity multiple
- 0.15×
- Total profit
- $-2,809,804
- Equity at exit
- $1,020,248
Cash invested: $3,304,000 (down + closing). Projections, not guarantees.
Landlord ↔ Tenant lean methodology
- Overall (STATE)
- 18 Strongly Tenant-Friendly
- State California
- 18 Strongly Tenant-Friendly · D+13
- County
- — inherits STATE
- City
- — inherits STATE
ZIP-level market 95401
- Rents YoY
- -1.4%
- Active inventory
- 79
- Price-to-rent
- 355.5×
Monthly cashflow live
- Estimated rent
- $95,416 high interval (Pro) →
- Mortgage (P&I)
- −$61,880
- Tax from tax record
- −$7,161 /mo · $85,933/yr
- Insurance
- −$4,917
- HOA
- −$0
- Vacancy / Maint / Mgmt
- −$20,037
- Net cashflow
- $1,420
Break-even live
Sensitivity live
| Price | -10% $8,100 | -5% $4,760 | +0% $1,420 | +5% $-1,919 | +10% $-5,259 |
|---|---|---|---|---|---|
| Rent | -10% $-6,117 | -5% $-2,348 | +0% $1,420 | +5% $5,189 | +10% $8,958 |
| Rate | -1.0pp $7,363 | -0.5pp $4,422 | base $1,420 | +0.5pp $-1,637 | +1.0pp $-4,748 |
35-unit breakdown (identical units grouped — click to expand)
| Units | Beds | Baths | Est. rent |
|---|---|---|---|
| 25× units | 3 | 2.5 | $69,150 |
| #1 | 3 | 2.5 | $2,766 |
| #2 | 3 | 2.5 | $2,766 |
| #3 | 3 | 2.5 | $2,766 |
| #4 | 3 | 2.5 | $2,766 |
| #5 | 3 | 2.5 | $2,766 |
| #6 | 3 | 2.5 | $2,766 |
| #7 | 3 | 2.5 | $2,766 |
| #8 | 3 | 2.5 | $2,766 |
| #9 | 3 | 2.5 | $2,766 |
| #10 | 3 | 2.5 | $2,766 |
| #11 | 3 | 2.5 | $2,766 |
| #12 | 3 | 2.5 | $2,766 |
| #13 | 3 | 2.5 | $2,766 |
| #14 | 3 | 2.5 | $2,766 |
| #15 | 3 | 2.5 | $2,766 |
| #16 | 3 | 2.5 | $2,766 |
| #17 | 3 | 2.5 | $2,766 |
| #18 | 3 | 2.5 | $2,766 |
| #19 | 3 | 2.5 | $2,766 |
| #20 | 3 | 2.5 | $2,766 |
| #21 | 3 | 2.5 | $2,766 |
| #22 | 3 | 2.5 | $2,766 |
| #23 | 3 | 2.5 | $2,766 |
| #24 | 3 | 2.5 | $2,766 |
| #25 | 3 | 2.5 | $2,766 |
| 10× units | 2 | 1 | $26,270 |
| #26 | 2 | 1 | $2,627 |
| #27 | 2 | 1 | $2,627 |
| #28 | 2 | 1 | $2,627 |
| #29 | 2 | 1 | $2,627 |
| #30 | 2 | 1 | $2,627 |
| #31 | 2 | 1 | $2,627 |
| #32 | 2 | 1 | $2,627 |
| #33 | 2 | 1 | $2,627 |
| #34 | 2 | 1 | $2,627 |
| #35 | 2 | 1 | $2,627 |
| Total (35 units) | $95,416 | ||
UW: 25.0% down · 7.5% · 30yr · 1.5% tax · 5.0% vac · 8.0% maint · 8.0% mgmt
Financing live
Cash to close
- Down payment
- $2,950,000
- Closing costs
- $354,000
- Reserves months
- —
- Total cash needed
- —
Loan-product check · same deal, 3 products live
Conventional
25% down · 7.5% · 30yr
- Down + closing
- —
- Monthly P&I
- —
- Monthly cashflow
- —
- DSCR
- —
- Eligible?
- —
Personal DTI + credit; lowest rate.
DSCR
20% down · 8.5% · 30yr
- Down + closing
- —
- Monthly P&I
- —
- Monthly cashflow
- —
- DSCR
- —
- Eligible?
- —
No personal income docs; deal must DSCR.
Hard money
10% down · 12.0% · 12mo
- Down + closing
- —
- Monthly P&I
- —
- Monthly cashflow
- —
- DSCR
- —
- Eligible?
- —
Short-term bridge; refi at stabilization.
Listing history 24 events
-
2026-06-21days on market $11,800,000 Active 40 DOM
-
2026-06-18days on market $11,800,000 Active 37 DOM
-
2026-06-17days on market $11,800,000 Active 36 DOM
-
2026-06-16days on market $11,800,000 Active 35 DOM
-
2026-06-15days on market $11,800,000 Active 34 DOM
-
2026-06-14days on market $11,800,000 Active 32 DOM
-
2026-06-13days on market $11,800,000 Active 31 DOM
-
2026-06-10days on market $11,800,000 Active 29 DOM
-
2026-06-09days on market $11,800,000 Active 28 DOM
-
2026-06-08days on market $11,800,000 Active 27 DOM
-
2026-06-07days on market $11,800,000 Active 26 DOM
-
2026-06-05days on market $11,800,000 Active 23 DOM
-
2026-06-03days on market $11,800,000 Active 22 DOM
-
2026-06-02days on market $11,800,000 Active 21 DOM
-
2026-06-01days on market $11,800,000 Active 20 DOM
-
2026-05-31days on market $11,800,000 Active 19 DOM
-
2026-05-30days on market $11,800,000 Active 18 DOM
-
2026-05-12$11,800,000 Active 764-char remark
Show marketing remark (764 chars)
Cedarwood Apartments is a 35-unit, condo-mapped multifamily community on 2.80 acres in central Santa Rosa, offered for purchase individually or as a portfolio with North Street Apartments (1570 North Street, Santa Rosa) The property features a 3BR-heavy unit mix 25 three-bed/2.5-bath townhome-style units averaging 1,230 SF and 10 two-bed flats with individual furnaces, individual hot water heaters, attached garages, and a pool. In-place rents average $2,854, leaving 9% of mark-to-market upside ($253/unit) and an additional $268/unit achievable through interior renovations and exterior siding upgrades. The condo map provides flexible long-term exit optionality. 97% occupied and immediate proximity to Santa Rosa Plaza, Highway 101, and Downtown Santa Rosa.
-
2013-09-12soldstatus $6,100,000
-
2012-08-03soldstatus $4,100,000
-
1988-01-12soldstatus $1,850,000
-
1984-02-03soldstatus $400,000
-
1984-02-03soldstatus $400,000
ⓘ Source: listings_history table (triggers on properties + properties_extension) + one-shot
backfill from property_details.listing_events for pre-trigger history.
Tax reassessment forecast CA · Resets to sale price
- Current annual tax
- $85,933 · $7,161/mo
- Projected year-2 tax
- $89,680 · $7,473/mo
- Expected delta
- +$3,747/yr (+$312/mo · 4.4%)
ⓘ Screening estimate from a state-policy table — verify with the county assessor before closing.
Climate risk First Street
- Flood 5/10 Major FEMA zone X (unshaded) · 47% chance over 30 yrs
- Wildfire 1/10 Low
- Heat 4/10 Moderate 7 d/yr ≥92°F today · 16 d/yr by 30 yrs out
- Wind 1/10 Low
- Air quality 8/10 Severe 15 unhealthy d/yr today · 17 by 30 yrs out
Nearby sold comps map
Loading sold comps map…
Walkable amenities ~0.75 mi
Loading nearby amenities…
Taxation est. · year 1
- Rental income
- $1,144,992
- − Mortgage interest
- −$660,983
- − Property taxes
- −$85,933
- − Insurance
- −$59,000
- − Repairs & maintenance
- −$91,599
- − Management
- −$91,599
- − Depreciation
- −$343,273
- Taxable loss
- −$187,396
- Est. tax savings @ 24.0%
- +$44,975
- After-tax cash flow
- $62,020/yr
For passive investors: Depreciation is non-cash, so a rental often shows a tax loss while cash-flowing — sheltering income. Rental losses are passive: they offset passive income freely, and up to $25,000/yr can offset ordinary (W-2) income if you actively participate and your MAGI is under $100k (phasing out to $0 by $150k); unused losses carry forward. On sale, claimed depreciation is recaptured at up to 25%, and gains may owe capital-gains tax (a 1031 exchange can defer both). Figures are a year-1 estimate at your 24.0% rate — not tax advice; consult a CPA.
Schools (NCES district)
- District
- Santa Rosa High
- NCES district ID
- 0635830
- Math proficiency
- 31% —
- Reading proficiency
- 47% —
- Median HH income
- $62,000
- Composite
- 37.25/100
- National rank
- #8972
- State rank
- #703 of 1400 in CA
Livability — Santa Rosa
- Score
- 75/100
- State rank
- #112
- US rank
- #3940
Category grades
Schools grade is shown separately in the Schools card above.
Census & demographics
- Census place
- Santa Rosa, CA
- County
- Sonoma County · 449,805 people
- City population
- 210,074
- Metro
- Santa Rosa-Petaluma, CA
- Population (ZIP)
- 36,861
- Household income
- $93,615
- Rent vs Own
- Severe rent burden
- 1525.0
Population outlook (Sonoma County) Hauer SSP2
- Today (2025)
- 539,935 people
- By 2030
- 554,870 · +2.8%
- By 2040
- 573,262 · +6.2%
- By 2050
- 580,715 · +7.6%
- By 2075
- 579,229 · +7.3%
- By 2100
- 547,835 · +1.5%
Race, ethnicity, and origin ACS 2023
- Neighborhood character
- Diverse neighborhood (Simpson 0.61)
- Race & ethnicity
- White 46% Hispanic / Latino 41% Two or more races 16% Asian 6% Black 1% Native American 1%
- Hispanic origin (detail)
- Mexican 36%
- Common ancestry
- Lithuanian 2% Italian 2% Slovak 1%
- Foreign-born
- 24% · Canada, Vietnam, China
- Languages at home
- 63% English-only · Spanish 32% Other Indo-European 2% Tagalog/Filipino 1%
Political lean MEDSL · Sonoma
- 2024 margin
- Solid D (+46.2) · D 71.4% · R 25.2% · Other 3.3%
- 2008→2024 swing
- -3.4pp toward R · 2008: 49.6pp · 2024: 46.2pp
- All cycles
- 2024: D+46.2 2020: D+51.5 2016: D+47.9 2012: D+44.9 2008: D+49.6
Not yet ingested
- Civics
- —
Market trends
- HPI YoY
- ▼ -855.56%
- Current HPI
- 253.1061
- Rent YoY
- ▼ -1.37%
- Metro
- Santa Rosa-Petaluma, CA
- State GDP YoY
- ▲ 3.21%
- F500 in state
- 116
Industry mix (Fortune 500 HQ in CA)
| Industry | F500 HQs | Revenue |
|---|---|---|
| Technology | 27 | $1,492B |
|
||
| Financial Services | 3 | $174B |
|
||
| Retail | 3 | $44B |
|
||
| Insurance | 3 | $26B |
|
||
| Media / Entertainment | 2 | $115B |
|
||
| Pharmaceuticals / Biotech | 2 | $62B |
|
||
Price history
+2850.0% since first listed7 events — show timeline
- 2026-05-12 Listed $11,800,000 MLSListings
- 2026-05-12 Listed $11,800,000 bridgeMLS, Bay East AOR, or Contra Costa AOR
- 2013-09-12 Sold (Public Records) $6,100,000 Public Records
- 2012-08-03 Sold (Public Records) $4,100,000 Public Records
- 1988-01-12 Sold (Public Records) $1,850,000 Public Records
- 1984-02-03 Sold (Public Records) $400,000 Public Records
- 1984-02-03 Sold (Public Records) $400,000 Public Records
Property tax history
+6.0%/yrLatest (2025): $85,933 · +1.6% YoY. Source: county tax records.
Cash-flow waterfall
monthlySold comps — $/sqft
last 12 mo · ≤1 miLoading sold comps…