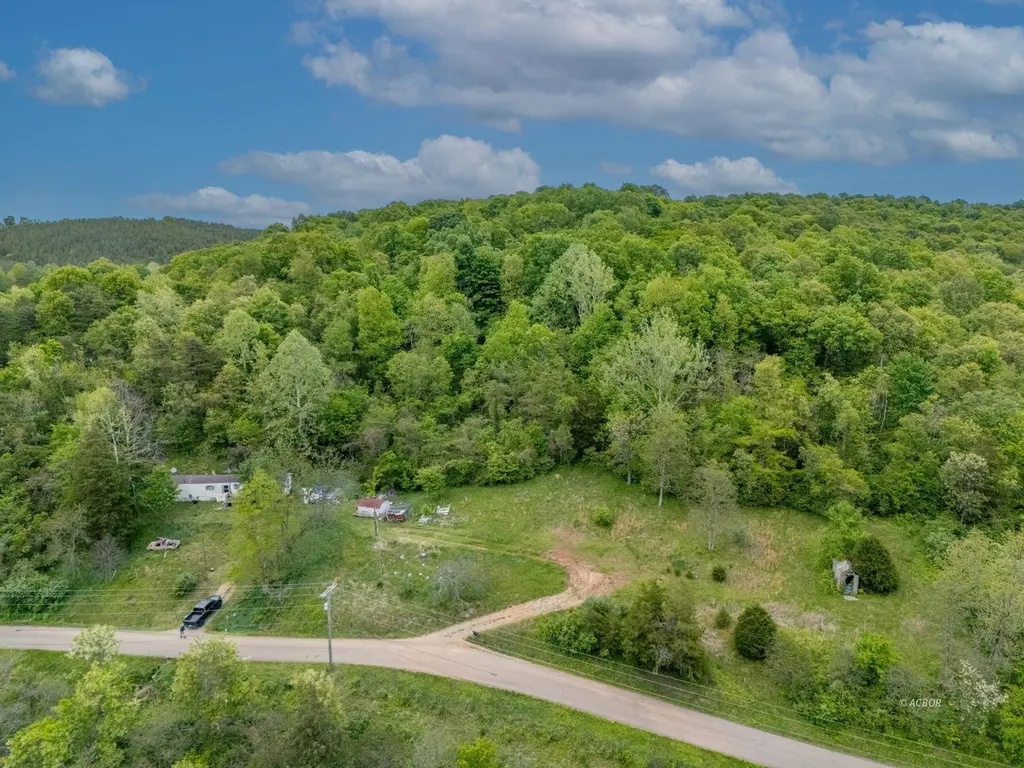
1005 Graham School Rd · Gallipolis, OH
Flood risk 1/10 · Minimal
- FEMA flood zone
- X (unshaded)
- Chance of flooding over 30 yrs
- 0.0%
- Est. flood insurance / yr
- $473 – $860
Fire risk 6/10 · Moderate
- Est. fire insurance / yr
- $713 – $1,323
Heat risk 4/10 · Minor
- Hot days now (above 102°F)
- 7 days/yr
- Hot days in 30 yrs
- 17 days/yr
Wind risk 2/10 · Minimal
- Chance of severe wind over 30 yrs
- 1.0%
Air-quality risk 1/10 · Minimal
- Unhealthy air days now
- 0 days/yr
- Unhealthy air days in 30 yrs
- 0 days/yr
Risk factors via First Street. Map © Google.
Why this score? — see what drove the B- grade
The composite is a weighted blend of 9 inputs, each scored 0–100. Each bar is that input's sub-score; the figure is the points it added to the 100-point composite (weight × sub-score).
- Cash flow +30.0/30.0
- 1% rule +10.0/10.0
- DSCR +10.0/10.0
- ARV discount +7.5/15.0
- Schools +3.9/10.0
- Livability +3.1/5.0
- Rent growth +2.5/5.0
- Condition / age +2.5/5.0
- Appreciation +0.0/10.0
$39,900
🖨 Deal sheet (PDF) 📄 Offer letter ✓ Due diligence
Listing remarks
Location, location, location. 1.0+/- acres in Green Township located on Graham School RD, only mins from Green Elementary and Gallia Academy High School, Vanco's BBQ, Park4Paws Dog Grooming, Subway/ParMar, and approx. 12mins from historic downtown Gallipolis, OH, shopping, amenities, and more! Property features existing utilities including water, power, and septic. Formerly the site of multiple mobile homes. Property will not qualify for FHA/VA/USDA financing. Seller will give preference to cash buyers or those able to use investment financing.
Key facts
- Existing utilities
- Water power septic
- 1.0 acres
Tags
Property features AI
Finance
- Other: Property located at 1005 Graham School Rd, Gallipolis, OH; mailbox shows 985/885 with two driveways (approach from 141, property on the right)
Exterior
- Utilities: Septic tank
- Home design: Single-story manufactured home; Residential property
- Construction: Manufactured/Title construction
Interior
- Bathrooms: 2 full bathrooms
- Heating & cooling: Forced air heating
- Interior features: 5 total rooms
Neighborhood map
What this means for you Summary
Snapshot
- This is a 3-bed/2.0-bath manufactured listed at $40k.
Deal economics
- At list price, monthly cash flow is $596 ($7k/yr) — positive.
- The deal already cash-flows at list — no discount required.
- Meets the 1% rule at list price ($1k rent vs $40k).
- Recommended offer: $39k (1.5% below list) — sets the bar for market timing.
- Cap rate 24.2% vs local median 4.5% in Gallipolis — top-decile yield for the area; either an underpriced asset or a hidden risk that comps aren't pricing in. Stress-test before assuming the spread holds.
Location & tenants
- Location reads 62/100 on livability (#910 in OH) — a middle-class / working-renter tenant base. Strengths: cost of living A+, housing B; Watch: employment C-, crime F, amenities F.
- Gallipolis City (rural): math 39% / reading 56% proficiency, ranked #488 of 656 in OH (top 74%) — families likely to look elsewhere, expect single-tenant / working-renter base with shorter leases.
- Market conditions: 68 active listings in the ZIP; 10 units permitted in Gallia County in 2024 (0 in 5+ unit buildings).
Forward outlook
- Local home prices are declining (-3.0%/yr); year-one equity from $276 of loan paydown is wiped out by about $1k of value loss. Plan a longer hold.
- Gallia County population projected at -24% by 2050 — secular population decline; favor cash flow + early exit over multi-decade hold.
- At projected returns (-3.0% appreciation + 3.0% rent growth), your $11k cash investment doubles in ~2 years — after that, you're playing with house money.
Negotiation context
- It's been on market 25 days — a 2% lower offer ($39k) is reasonable based on typical stale-listing flexibility.
Risks & watch-outs
- Climate carrying-cost: major wildfire risk — expect insurance premiums to compound above CPI over the hold.
Questions for the listing agent
- Is there a deadline driving the sale (1031 exchange, divorce, estate, relocation)? That informs how much negotiation room exists.
- Crime grade is F in this area — have there been break-ins, vandalism, or insurance claims at this property in the last 3 years? What carrier currently insures it and at what premium?
- What's the average days-on-market for RENTAL listings here right now (not sales)? A rising rental-DOM trend means longer vacancies and softer asking-rent achievability than the comps imply.
- What's the recent tenant-quality profile in this submarket — average credit score on applications, eviction rate, late-payment / NSF rate, and stable-employment percentage? A property-management company in the area should have these aggregated.
- How much new for-sale + rental construction is in the pipeline within 1–3 miles? Heavy new supply typically softens prices + rents 12–24 months out; constrained supply supports both.
Investment metrics
- 1% rule
- 2.77% ✓
- Cap rate
- 24.23%
- Cash-on-cash
- 64.07%
- DSCR
- 3.85
- GRM
- 3.0
CMA / ARV
No comps found within radius.
Projected returns pro-forma
-3.0% appreciation · 3.0% rent growth · sell at horizon
- IRR
- 63.2%
- Equity multiple
- 3.82×
- Total profit
- $31,539
- Equity at exit
- $5,949
- IRR
- 67.6%
- Equity multiple
- 7.84×
- Total profit
- $76,448
- Equity at exit
- $3,450
Cash invested: $11,172 (down + closing). Projections, not guarantees.
Landlord ↔ Tenant lean methodology
- Overall (STATE)
- 73 Landlord-Friendly
- State Ohio
- 73 Landlord-Friendly · R+6
- County
- — inherits STATE
- City
- — inherits STATE
ZIP-level market 45631
- Home prices YoY
- -8.6%
- Active inventory
- 68
- Price-to-rent
- 3.0×
Monthly cashflow live
- Estimated rent
- $1,104 medium interval (Pro) →
- Mortgage (P&I)
- −$209
- Tax est. 1.5%
- −$50 /mo · $598/yr
- Insurance
- −$17
- HOA
- −$0
- Vacancy / Maint / Mgmt
- −$232
- Net cashflow
- $596
Break-even live
Sensitivity live
| Price | -10% $624 | -5% $610 | +0% $596 | +5% $583 | +10% $569 |
|---|---|---|---|---|---|
| Rent | -10% $509 | -5% $553 | +0% $596 | +5% $640 | +10% $684 |
| Rate | -1.0pp $617 | -0.5pp $607 | base $596 | +0.5pp $586 | +1.0pp $576 |
UW: 25.0% down · 7.5% · 30yr · 1.5% tax · 5.0% vac · 8.0% maint · 8.0% mgmt
Financing live
Cash to close
- Down payment
- $9,975
- Closing costs
- $1,197
- Reserves months
- —
- Total cash needed
- —
Loan-product check · same deal, 3 products live
Conventional
25% down · 7.5% · 30yr
- Down + closing
- —
- Monthly P&I
- —
- Monthly cashflow
- —
- DSCR
- —
- Eligible?
- —
Personal DTI + credit; lowest rate.
DSCR
20% down · 8.5% · 30yr
- Down + closing
- —
- Monthly P&I
- —
- Monthly cashflow
- —
- DSCR
- —
- Eligible?
- —
No personal income docs; deal must DSCR.
Hard money
10% down · 12.0% · 12mo
- Down + closing
- —
- Monthly P&I
- —
- Monthly cashflow
- —
- DSCR
- —
- Eligible?
- —
Short-term bridge; refi at stabilization.
Listing history 3 events
-
2026-06-01days on market $39,900 Active 25 DOM
-
2026-05-31days on market $39,900 Active 24 DOM
-
2026-05-07$39,900 Active 550-char remark
ⓘ Source: listings_history table (triggers on properties + properties_extension) + one-shot
backfill from property_details.listing_events for pre-trigger history.
Climate risk First Street
- Flood 1/10 Low FEMA zone X (unshaded) · 0% chance over 30 yrs
- Wildfire 6/10 Major
- Heat 4/10 Moderate 7 d/yr ≥102°F today · 17 d/yr by 30 yrs out
- Wind 2/10 Low 100% chance of damaging wind over 30 yrs
- Air quality 1/10 Low 0 unhealthy d/yr today · 0 by 30 yrs out
Nearby sold comps map
Loading sold comps map…
Walkable amenities ~0.75 mi
Loading nearby amenities…
Taxation est. · year 1
- Rental income
- $13,248
- − Mortgage interest
- −$2,235
- − Property taxes
- −$598
- − Insurance
- −$200
- − Repairs & maintenance
- −$1,060
- − Management
- −$1,060
- − Depreciation
- −$1,161
- Taxable income
- $6,935
- Est. tax owed @ 24.0%
- −$1,664
- After-tax cash flow
- $5,493/yr
For passive investors: Depreciation is non-cash, so a rental often shows a tax loss while cash-flowing — sheltering income. Rental losses are passive: they offset passive income freely, and up to $25,000/yr can offset ordinary (W-2) income if you actively participate and your MAGI is under $100k (phasing out to $0 by $150k); unused losses carry forward. On sale, claimed depreciation is recaptured at up to 25%, and gains may owe capital-gains tax (a 1031 exchange can defer both). Figures are a year-1 estimate at your 24.0% rate — not tax advice; consult a CPA.
Schools (NCES district)
- District
- Gallipolis City
- NCES district ID
- 3904403
- Math proficiency
- 39% ▼ -22.00%
- Reading proficiency
- 56% ▼ -6.00%
- Median HH income
- $37,983
- Composite
- 39.49/100
- National rank
- #3952
- State rank
- #488 of 656 in OH
Livability — Gallipolis
- Score
- 62/100
- State rank
- #910
- US rank
- #17199
Category grades
Schools grade is shown separately in the Schools card above.
Census & demographics
- County
- Gallia · 29,277 people
- Population (ZIP)
- 12,669
- Household income
- $54,772
- Rent vs Own
- Severe rent burden
- 9.1
Population outlook (Gallia County) Hauer SSP2
- Today (2025)
- 27,936 people
- By 2030
- 26,605 · -4.8%
- By 2040
- 23,876 · -14.5%
- By 2050
- 21,336 · -23.6%
- By 2075
- 16,414 · -41.2%
- By 2100
- 13,192 · -52.8%
Race, ethnicity, and origin ACS 2023
- Neighborhood character
- Predominantly White (92%)
- Race & ethnicity
- White 92% Two or more races 3% Black 3% Hispanic / Latino 1%
- Common ancestry
- Slovak 3% Lithuanian 3% Italian 1%
- Foreign-born
- 1%
- Languages at home
- 97% English-only · Spanish 1% German/W. Germanic 1%
Political lean MEDSL · Gallia
- 2024 margin
- Solid R (+59.4) · D 19.9% · R 79.3%
- 2008→2024 swing
- -33.3pp toward R · 2008: -26.1pp · 2024: -59.4pp
- All cycles
- 2024: R+59.4 2020: R+55.5 2016: R+55.6 2012: R+26.2 2008: R+26.1
Not yet ingested
- Civics
- —
Market trends
- HPI YoY
- ▼ -19.11%
- Current HPI
- 203.6153
- Rent YoY
- —
- Metro
- —
- State GDP YoY
- ▲ 1.98%
- F500 in state
- 48
Industry mix (Fortune 500 HQ in OH)
| Industry | F500 HQs | Revenue |
|---|---|---|
| Insurance | 3 | $145B |
|
||
| Industrial Machinery | 3 | $49B |
|
||
| Financial Services | 3 | $24B |
|
||
| Consumer Goods | 2 | $93B |
|
||
| Aerospace / Defense | 2 | $47B |
|
||
| Utilities | 2 | $33B |
|
||
Price history
1 event — show timeline
- 2026-05-07 Listed $39,900 ACBOR
Property tax history
-30.7%/yrLatest (2025): $1 · +2.8% YoY. Source: county tax records.
Cash-flow waterfall
monthlySold comps — $/sqft
last 12 mo · ≤1 miLoading sold comps…