201 W Washington St · Dunkirk, OH
Flood risk 1/10 · Minimal
- FEMA flood zone
- —
- Chance of flooding over 30 yrs
- 0.0%
- Est. flood insurance / yr
- —
Fire risk 1/10 · Minimal
- Est. fire insurance / yr
- $713 – $1,323
Heat risk 3/10 · Minor
- Hot days now (above 99°F)
- 7 days/yr
- Hot days in 30 yrs
- 17 days/yr
Wind risk 2/10 · Minimal
- Chance of severe wind over 30 yrs
- —
Air-quality risk 2/10 · Minimal
- Unhealthy air days now
- 1 days/yr
- Unhealthy air days in 30 yrs
- 2 days/yr
Risk factors via First Street. Map © Google.
Why this score? — see what drove the A- grade
The composite is a weighted blend of 9 inputs, each scored 0–100. Each bar is that input's sub-score; the figure is the points it added to the 100-point composite (weight × sub-score).
- Cash flow +30.0/30.0
- 1% rule +10.0/10.0
- DSCR +10.0/10.0
- Appreciation +10.0/10.0
- ARV discount +7.5/15.0
- Schools +5.4/10.0
- Livability +3.2/5.0
- Rent growth +2.5/5.0
- Condition / age +2.5/5.0
$48,750
🖨 Deal sheet 📄 Offer letter ✓ Due diligence
Listing remarks MLS
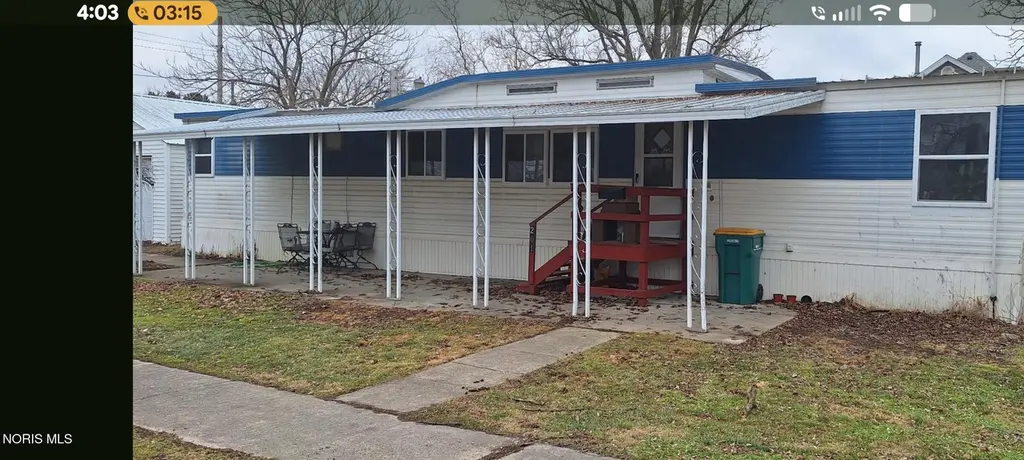
This rare find in town corner lot with 2 bd 1969 mobile home has a peak style roof / 2 yr new windows / some new vinyl floor with a 2 car concreted garage is available for viewing with a 24 hr. notice. Approx. 25 min from Findlay and approx. 15 min from Kenton. Nice property $52,000. Possession possibly at closing / open to negotiation.
Key facts
- 60120 acre lot
- 2 garage spots
- Built 1969
Neighborhood map
What this means for you Summary
Snapshot
- This is a 2-bed/1.0-bath manufactured listed at $49k.
Deal economics
- At list price, monthly cash flow is $366 ($4k/yr) — positive.
- The deal already cash-flows at list — no discount required.
- Meets the 1% rule at list price ($825 rent vs $49k).
- Recommended offer: $44k (9.0% below list) — sets the bar for market timing.
Location & tenants
- Location reads 64/100 on livability (#791 in OH) — a middle-class / working-renter tenant base. Strengths: cost of living A+, housing A+, health & safety A+; Watch: crime D, schools F, amenities F.
- Hardin Northern Local (rural): math 60% / reading 68% proficiency, ranked #230 of 656 in OH (top 35%) — acceptable for families but not a draw, mixed tenant base, ~2y average lease.
- Market conditions: 4 active listings in the ZIP; 18 units permitted in Hardin County in 2024 (0 in 5+ unit buildings).
- This rent is only 17% of the median local income ($59k/yr) — well below the 30% rent-burden line; pricing power to push rent on renewal without tenant pushback.
Forward outlook
- In year one you build about $5k of equity ($338 loan paydown + $5k appreciation (10.0% local appreciation)).
- Hardin County population projected at -18% by 2050 — secular population decline; favor cash flow + early exit over multi-decade hold.
- At projected returns (10.0% appreciation + 3.0% rent growth), your $14k cash investment doubles in ~2 years — after that, you're playing with house money.
- By year 6, paydown + projected appreciation supports a ~$31k cash-out refi (75% LTV) — recoverable capital for the next deal without selling this one.
Negotiation context
- It's been on market 115 days — a 9% lower offer ($44k) is reasonable based on typical stale-listing flexibility.
- 2 sale attempts since 12y ago; this cycle's ask has dropped $3k (6%) from the opening price — seller is motivated, your offer sets the floor, not the list.
- Current owner paid $16k; list at $49k implies a 195% gain — meaningful room to come down on a strong offer.
Questions for the listing agent
- It's been on market 115 days. Have you received any prior offers? Is the seller open to a 9% concession, seller financing, or rate buy-down credit?
- Built in 1969 — when were the roof, HVAC, electrical panel, plumbing, and water heater last replaced?
- Why hasn't it sold? Are there any deal-killer items the seller is aware of (foundation, flood, title, zoning, code violations)?
- Is there a deadline driving the sale (1031 exchange, divorce, estate, relocation)? That informs how much negotiation room exists.
- Schools are F-rated, which usually means shorter tenancies and higher turnover. Who's the typical renter profile here, and what's been the actual vacancy rate?
- Crime grade is D in this area — have there been break-ins, vandalism, or insurance claims at this property in the last 3 years? What carrier currently insures it and at what premium?
- What's the average days-on-market for RENTAL listings here right now (not sales)? A rising rental-DOM trend means longer vacancies and softer asking-rent achievability than the comps imply.
- What's the recent tenant-quality profile in this submarket — average credit score on applications, eviction rate, late-payment / NSF rate, and stable-employment percentage? A property-management company in the area should have these aggregated.
- How much new for-sale + rental construction is in the pipeline within 1–3 miles? Heavy new supply typically softens prices + rents 12–24 months out; constrained supply supports both.
Investment metrics
- 1% rule
- 1.69% ✓
- Cap rate
- 15.29%
- Cash-on-cash
- 32.14%
- DSCR
- 2.43
- GRM
- 4.9
CMA / ARV
No comps found within radius.
Projected returns pro-forma
10.0% appreciation · 3.0% rent growth · sell at horizon
- IRR
- 48.8%
- Equity multiple
- 4.65×
- Total profit
- $49,820
- Equity at exit
- $43,918
- IRR
- 42.5%
- Equity multiple
- 10.40×
- Total profit
- $128,362
- Equity at exit
- $94,711
Cash invested: $13,650 (down + closing). Projections, not guarantees.
Landlord ↔ Tenant lean methodology
- Overall (STATE)
- 73 Landlord-Friendly
- State Ohio
- 73 Landlord-Friendly · R+6
- County
- — inherits STATE
- City
- — inherits STATE
ZIP-level market 45836
- Home prices YoY
- 5.9%
- Active inventory
- 4
- Price-to-rent
- 4.9×
Monthly cashflow live
- Estimated rent
- $825 medium interval (Pro) →
- Mortgage (P&I)
- −$256
- Tax from tax record
- −$10 /mo · $126/yr
- Insurance
- −$20
- HOA
- −$0
- Vacancy / Maint / Mgmt
- −$173
- Net cashflow
- $366
Break-even live
UW: 25.0% down · 7.5% · 30yr · 1.5% tax · 5.0% vac · 8.0% maint · 8.0% mgmt
Financing live
Cash to close
- Down payment
- $12,188
- Closing costs
- $1,462
- Reserves months
- —
- Total cash needed
- —
Loan-product check · same deal, 3 products live
Conventional
25% down · 7.5% · 30yr
- Down + closing
- —
- Monthly P&I
- —
- Monthly cashflow
- —
- DSCR
- —
- Eligible?
- —
Personal DTI + credit; lowest rate.
DSCR
20% down · 8.5% · 30yr
- Down + closing
- —
- Monthly P&I
- —
- Monthly cashflow
- —
- DSCR
- —
- Eligible?
- —
No personal income docs; deal must DSCR.
Hard money
10% down · 12.0% · 12mo
- Down + closing
- —
- Monthly P&I
- —
- Monthly cashflow
- —
- DSCR
- —
- Eligible?
- —
Short-term bridge; refi at stabilization.
Listing history 20 events
-
2026-06-18days on market $48,750 Active 115 DOM
-
2026-06-17days on market $48,750 Active 114 DOM
-
2026-06-16days on market $48,750 Active 113 DOM
-
2026-06-15days on market $48,750 Active 112 DOM
-
2026-06-13days on market $48,750 Active 110 DOM
-
2026-06-12days on market $48,750 Active 109 DOM
-
2026-06-09days on market $48,750 Active 106 DOM
-
2026-06-08days on market $48,750 Active 105 DOM
-
2026-06-08days on market $48,750 Active 104 DOM
-
2026-06-05days on market $48,750 Active 102 DOM
-
2026-06-04days on market $48,750 Active 100 DOM
-
2026-06-02days on market $48,750 Active 99 DOM
-
2026-06-01days on market $48,750 Active 98 DOM
-
2026-05-31days on market $48,750 Active 97 DOM
-
2026-04-07price $48,750 341-char remark
Show marketing remark (341 chars)
This rare find in town corner lot with 2 bd 1969 mobile home has a peak style roof / 2 yr new windows / some new vinyl floor with a 2 car concreted garage is available for viewing with a 24 hr. notice. Approx. 25 min from Findlay and approx. 15 min from Kenton. Nice property $52,000. Possession possibly at closing / open to negotiation.
-
2026-04-07price $49,000 341-char remark
Show marketing remark (341 chars)
This rare find in town corner lot with 2 bd 1969 mobile home has a peak style roof / 2 yr new windows / some new vinyl floor with a 2 car concreted garage is available for viewing with a 24 hr. notice. Approx. 25 min from Findlay and approx. 15 min from Kenton. Nice property $52,000. Possession possibly at closing / open to negotiation.
-
2026-02-23$52,000 Active 341-char remark
Show marketing remark (341 chars)
This rare find in town corner lot with 2 bd 1969 mobile home has a peak style roof / 2 yr new windows / some new vinyl floor with a 2 car concreted garage is available for viewing with a 24 hr. notice. Approx. 25 min from Findlay and approx. 15 min from Kenton. Nice property $52,000. Possession possibly at closing / open to negotiation.
-
2014-08-21soldstatus $16,500 93-char remark
Show marketing remark (93 chars)
Well kept mobile home. On a corner lot 60 x 120. Two car garage, covered patio. ,Under 1 Acre
-
2014-05-01$18,000 93-char remark
Show marketing remark (93 chars)
Well kept mobile home. On a corner lot 60 x 120. Two car garage, covered patio. ,Under 1 Acre
-
2001-11-13soldstatus $9,500
ⓘ Source: listings_history table (triggers on properties + properties_extension) + one-shot
backfill from property_details.listing_events for pre-trigger history.
Tax reassessment forecast OH · Partial reset (capped growth)
- Current annual tax
- $126 · $10/mo
- Projected year-2 tax
- $443 · $37/mo
- Expected delta
- +$317/yr (+$26/mo · 252.4%)
ⓘ Screening estimate from a state-policy table — verify with the county assessor before closing.
Climate risk First Street
- Flood 1/10 Low 0% chance over 30 yrs
- Wildfire 1/10 Low
- Heat 3/10 Moderate 7 d/yr ≥99°F today · 17 d/yr by 30 yrs out
- Wind 2/10 Low
- Air quality 2/10 Low 1 unhealthy d/yr today · 2 by 30 yrs out
Nearby sold comps map
Loading sold comps map…
Walkable amenities ~0.75 mi
Loading nearby amenities…
Taxation est. · year 1
- Rental income
- $9,905
- − Mortgage interest
- −$2,731
- − Property taxes
- −$126
- − Insurance
- −$244
- − Repairs & maintenance
- −$792
- − Management
- −$792
- − Depreciation
- −$1,418
- Taxable income
- $3,802
- Est. tax owed @ 24.0%
- −$912
- After-tax cash flow
- $3,475/yr
For passive investors: Depreciation is non-cash, so a rental often shows a tax loss while cash-flowing — sheltering income. Rental losses are passive: they offset passive income freely, and up to $25,000/yr can offset ordinary (W-2) income if you actively participate and your MAGI is under $100k (phasing out to $0 by $150k); unused losses carry forward. On sale, claimed depreciation is recaptured at up to 25%, and gains may owe capital-gains tax (a 1031 exchange can defer both). Figures are a year-1 estimate at your 24.0% rate — not tax advice; consult a CPA.
Schools (NCES district)
- District
- Hardin Northern Local
- NCES district ID
- 3904749
- Math proficiency
- 60% ▼ -4.00%
- Reading proficiency
- 68% ▲ 5.00%
- Median HH income
- $48,584
- Composite
- 54.23/100
- National rank
- #1375
- State rank
- #230 of 656 in OH
Livability — Dunkirk
- Score
- 64/100
- State rank
- #791
- US rank
- #14368
Category grades
Schools grade is shown separately in the Schools card above.
Census & demographics
- Census place
- Dunkirk, OH
- County
- Hardin · 33,287 people
- City population
- 1,519
- Population (ZIP)
- 1,519
- Household income
- $58,508
- Rent vs Own
- Severe rent burden
- 1.4
Population outlook (Hardin County) Hauer SSP2
- Today (2025)
- 31,000 people
- By 2030
- 30,031 · -3.1%
- By 2040
- 27,500 · -11.3%
- By 2050
- 25,265 · -18.5%
- By 2075
- 20,485 · -33.9%
- By 2100
- 16,031 · -48.3%
Race, ethnicity, and origin ACS 2023
- Neighborhood character
- Predominantly White (97%)
- Race & ethnicity
- White 97% Two or more races 2% Hispanic / Latino 2%
- Common ancestry
- Slovak 3% Lithuanian 2% Serbian 2%
Political lean MEDSL · Hardin
- 2024 margin
- Solid R (+54.7) · D 22.2% · R 76.9%
- 2008→2024 swing
- -33.8pp toward R · 2008: -20.9pp · 2024: -54.7pp
- All cycles
- 2024: R+54.7 2020: R+52.0 2016: R+47.2 2012: R+23.5 2008: R+20.9
Not yet ingested
- Civics
- —
Market trends
- HPI YoY
- ▲ 12.57%
- Current HPI
- 224.66
- Rent YoY
- —
- Metro
- —
- State GDP YoY
- ▲ 1.98%
- F500 in state
- 48
Industry mix (Fortune 500 HQ in OH)
| Industry | F500 HQs | Revenue |
|---|---|---|
| Insurance | 3 | $145B |
|
||
| Industrial Machinery | 3 | $49B |
|
||
| Financial Services | 3 | $24B |
|
||
| Consumer Goods | 2 | $93B |
|
||
| Aerospace / Defense | 2 | $47B |
|
||
| Utilities | 2 | $33B |
|
||
Price history
+413.2% since first listed6 events — show timeline
- 2026-04-07 Price Changed $48,750 NORIS
- 2026-04-07 Price Changed $49,000 NORIS
- 2026-02-23 Listed $52,000 NORIS
- 2014-08-21 Sold (MLS) $16,500 WCARE
- 2014-05-01 Listed $18,000 WCARE
- 2001-11-13 Sold (Public Records) $9,500 Public Records
Property tax history
-0.1%/yrLatest (2025): $126 · +2.1% YoY. Source: county tax records.
Cash-flow waterfall
monthlySold comps — $/sqft
last 12 mo · ≤1 miLoading sold comps…