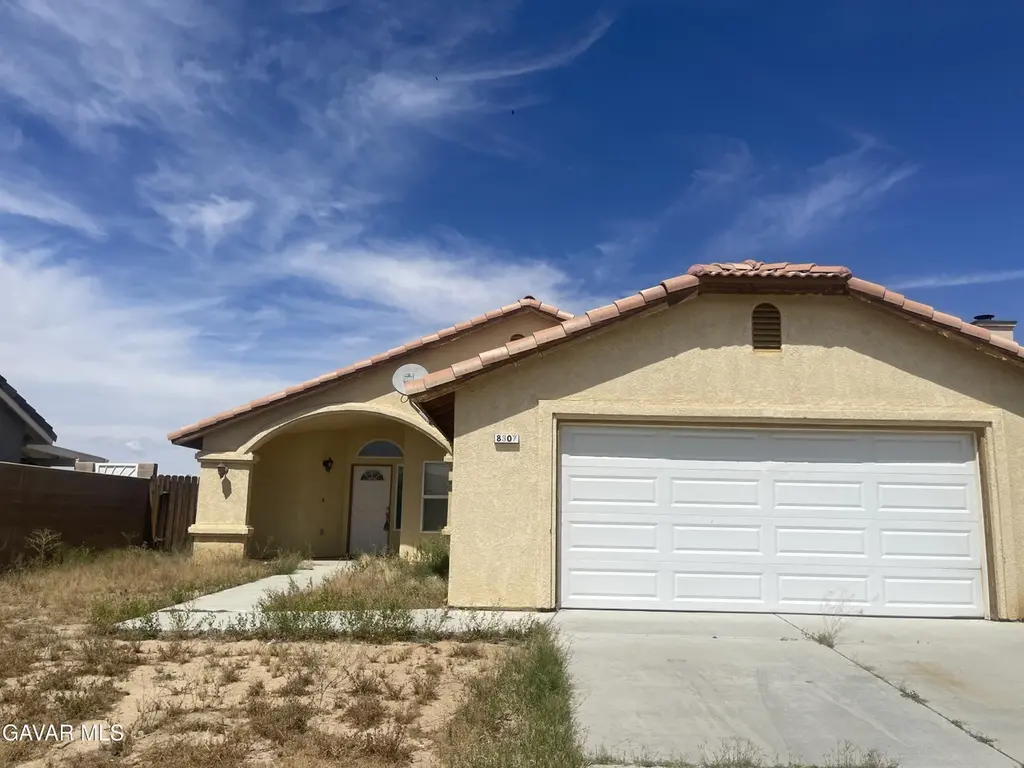
8307 Charles Pl Pl · California City, CA
Flood risk 1/10 · Minimal
- FEMA flood zone
- X (unshaded)
- Chance of flooding over 30 yrs
- 0.0%
- Est. flood insurance / yr
- $507 – $1,088
Fire risk 1/10 · Minimal
- Est. fire insurance / yr
- $659 – $1,223
Heat risk 8/10 · Major
- Hot days now (above 101°F)
- 6 days/yr
- Hot days in 30 yrs
- 14 days/yr
Wind risk 1/10 · Minimal
- Chance of severe wind over 30 yrs
- —
Air-quality risk 7/10 · Major
- Unhealthy air days now
- 13 days/yr
- Unhealthy air days in 30 yrs
- 17 days/yr
Risk factors via First Street. Map © Google.
Why this score? — see what drove the C- grade
The composite is a weighted blend of 9 inputs, each scored 0–100. Each bar is that input's sub-score; the figure is the points it added to the 100-point composite (weight × sub-score).
- ARV discount +12.5/15.0
- Cash flow +11.6/30.0
- Appreciation +10.0/10.0
- Rent growth +3.9/5.0
- DSCR +3.4/10.0
- Condition / age +2.5/5.0
- 1% rule +2.2/10.0
- Livability +2.2/5.0
- Schools +2.1/10.0
$275,000
🖨 Deal sheet 📄 Offer letter ✓ Due diligence
Listing remarks MLS
This inviting 3-bedroom, 2-bathroom home offers a comfortable blend of functionality, warmth, and natural light throughout. Soft carpeting extends through the living room and all bedrooms, creating a cozy and welcoming atmosphere. The kitchen features classic wood cabinetry and is equipped with a microwave, stove/oven, and dishwasher, offering convenience for everyday living and family dinners. Adjacent laundry hookups with additional cabinetry provide added storage and practicality. The thoughtfully designed floor plan separates the primary suite from the secondary bedrooms, enhancing privacy and flexibility for guests or household members. The primary bedroom includes a walk-in closet and an en-suite bathroom featuring dual sinks and a relaxing tub. The living room centers around a cozy fireplace, creating an inviting space for relaxing evenings at home. Additional highlights include central air conditioning and abundant natural light throughout. Step outside to a low-maintenance, zero-scaped backyard, offering a blank canvas ready for your personal touch and outdoor vision.
Key facts
- 6,098 sq ft lot
- 2 garage spots
- Built 2005
Neighborhood map
What this means for you Summary
Snapshot
- This is a 3-bed/2.0-bath single-family listed at $275k.
Deal economics
- At list price, monthly cash flow is $-83 ($-999/yr) — negative.
- To cash-flow at today's rent, offer at most $260k (5.3% below list).
- To meet the 1% rule (rent ≥ 1% of price), the offer needs to be $198k (27.8% below list).
- Recommended offer: $198k (27.8% below list) — sets the bar for 1% rule.
Location & tenants
- Location reads 44/100 on livability (#1,329 in CA) — a working-class tenant base; expect higher turnover. Strengths: housing A+; Watch: schools F, crime F, amenities F.
- Mojave Unified (town): math 25% / reading 25% proficiency, ranked #411 of 517 in CA (top 80%) — low school quality limits family demand, transient renter base, plan for 1-2y turnover; 76% free/reduced lunch — lower-income household profile, screen leases tightly.
- Market conditions: Rents rising fast (+5.5%/yr); 703 active listings in the ZIP; 27 comparable units currently listed for rent nearby; rentals at typical pace (median 24d on market — plan ~3-4 weeks tenant-placement turnaround); 3,244 units permitted in Kern County in 2024 (73 in 5+ unit buildings).
- This rent runs 40% of the median local income ($60k/yr) — at the standard rent-burdened threshold; future hikes will face affordability resistance.
Forward outlook
- In year one you build about $29k of equity ($2k loan paydown + $28k appreciation (10.0% local appreciation)).
- Kern County population projected at +17% by 2050 — long-run rental-demand tailwind backs the buy-and-hold thesis.
- At projected returns (10.0% appreciation + 5.5% rent growth), your $77k cash investment doubles in ~3 years — after that, you're playing with house money.
- By year 2, paydown + projected appreciation supports a ~$47k cash-out refi (75% LTV) — recoverable capital for the next deal without selling this one.
Negotiation context
- It's been on market 52 days — a 3% lower offer ($267k) is reasonable based on typical stale-listing flexibility.
- 6 sale attempts since 19y ago with the ask held roughly flat each time — persistent listings suggest the price (not the market) is what's stuck; bring a comps-based counter.
- Current owner paid $180k; list at $275k implies a 53% gain — meaningful room to come down on a strong offer.
Risks & watch-outs
- Climate carrying-cost: extreme-heat days projected 6→14/yr by 2055 (HVAC capex compounding) — expect insurance premiums to compound above CPI over the hold.
Questions for the listing agent
- What do current leases actually rent for vs. the listed asking? Can we see a recent rent roll and the last 12 months of T-12 income?
- It's been on market 52 days. Have you received any prior offers? Is the seller open to a 28% concession, seller financing, or rate buy-down credit?
- Is there a deadline driving the sale (1031 exchange, divorce, estate, relocation)? That informs how much negotiation room exists.
- Schools are F-rated, which usually means shorter tenancies and higher turnover. Who's the typical renter profile here, and what's been the actual vacancy rate?
- Crime grade is F in this area — have there been break-ins, vandalism, or insurance claims at this property in the last 3 years? What carrier currently insures it and at what premium?
- What's the average days-on-market for RENTAL listings here right now (not sales)? A rising rental-DOM trend means longer vacancies and softer asking-rent achievability than the comps imply.
- What's the recent tenant-quality profile in this submarket — average credit score on applications, eviction rate, late-payment / NSF rate, and stable-employment percentage? A property-management company in the area should have these aggregated.
- How much new for-sale + rental construction is in the pipeline within 1–3 miles? Heavy new supply typically softens prices + rents 12–24 months out; constrained supply supports both.
Investment metrics
- 1% rule
- 0.72% ✗
- Cap rate
- 5.93%
- Cash-on-cash
- -1.30%
- DSCR
- 0.94
- GRM
- 11.5
CMA / ARV
- ARV (median comp)
- $309,733
- List price
- $275,000
- Delta
- -11.21%
- Verdict
- UNDERPRICED
- Comps
- 20 within 1.0 mi
Show comp detail 12 sales within ~0.75 mi
| Address | Dist | Beds/Ba | Sqft | Sold | Price | $/sf | Match |
|---|---|---|---|---|---|---|---|
| 8241 Charles Pl | 0.07mi | 3/2.0 | 1,498 (0%) | 16mo | $270,000 | $180 | 83 |
| 8368 Charles Pl | 0.06mi | 3/2.0 | 1,508 (+1%) | 18mo | $285,000 | $189 | 81 |
| 8220 Charles Pl | 0.10mi | 3/2.0 | 1,578 (+5%) | 8mo | $285,000 | $181 | 79 |
| 8406 Poppy Blvd | 0.43mi | 3/2.0 | 1,529 (+2%) | 2mo | $250,000 | $164 | 75 |
| 8206 Olivo Dr | 0.10mi | 3/2.0 | 1,409 (-6%) | 16mo | $324,900 | $231 | 72 |
| 8412 Jimson Ave | 0.49mi | 3/2.0 | 1,587 (+6%) | 2mo | $270,000 | $170 | 65 |
| 21419 Neuralia | 0.56mi | 3/2.0 | 1,554 (+4%) | 3mo | $240,000 | $154 | 65 |
| 8218 Olivo Dr | 0.10mi | 3/2.0 | 1,312 (-12%) | 14mo | $309,900 | $236 | 63 |
| 8560 Jimson Ave | 0.57mi | 3/2.0 | 1,445 (-4%) | 12mo | $264,900 | $183 | 57 |
| 7666 Poppy Blvd | 0.70mi | 3/2.0 | 1,556 (+4%) | 8mo | $265,000 | $170 | 54 |
| 8801 Lupine Loop Dr | 0.74mi | 3/2.0 | 1,555 (+4%) | 8mo | $234,000 | $150 | 52 |
| 21325 Neuralia Rd | 0.68mi | 3/2.0 | 1,646 (+10%) | 11mo | $349,000 | $212 | 42 |
Match score weights: distance 35% · size 25% · config 20% · recency 20%. Top-matched comps best support the ARV.
Projected returns pro-forma
10.0% appreciation · 5.45% rent growth · sell at horizon
- IRR
- 24.0%
- Equity multiple
- 2.94×
- Total profit
- $149,358
- Equity at exit
- $247,742
- IRR
- 21.8%
- Equity multiple
- 6.91×
- Total profit
- $454,991
- Equity at exit
- $534,265
Cash invested: $77,000 (down + closing). Projections, not guarantees.
Landlord ↔ Tenant lean methodology
- Overall (STATE)
- 18 Strongly Tenant-Friendly
- State California
- 18 Strongly Tenant-Friendly · D+13
- County
- — inherits STATE
- City
- — inherits STATE
ZIP-level market 93505
- Home prices YoY
- 13.0%
- Rents YoY
- 5.5%
- Active inventory
- 703
- Price-to-rent
- 11.5×
Monthly cashflow live
- Estimated rent
- $1,985 high interval (Pro) →
- Mortgage (P&I)
- −$1,442
- Tax from tax record
- −$94 /mo · $1,133/yr
- Insurance
- −$115
- HOA
- −$0
- Vacancy / Maint / Mgmt
- −$417
- Net cashflow
- $-83
Break-even live
UW: 25.0% down · 7.5% · 30yr · 1.5% tax · 5.0% vac · 8.0% maint · 8.0% mgmt
Financing live
Cash to close
- Down payment
- $68,750
- Closing costs
- $8,250
- Reserves months
- —
- Total cash needed
- —
Loan-product check · same deal, 3 products live
Conventional
25% down · 7.5% · 30yr
- Down + closing
- —
- Monthly P&I
- —
- Monthly cashflow
- —
- DSCR
- —
- Eligible?
- —
Personal DTI + credit; lowest rate.
DSCR
20% down · 8.5% · 30yr
- Down + closing
- —
- Monthly P&I
- —
- Monthly cashflow
- —
- DSCR
- —
- Eligible?
- —
No personal income docs; deal must DSCR.
Hard money
10% down · 12.0% · 12mo
- Down + closing
- —
- Monthly P&I
- —
- Monthly cashflow
- —
- DSCR
- —
- Eligible?
- —
Short-term bridge; refi at stabilization.
Rent comps 27 comps
| Address | Beds | Baths | Sqft | Rent | $/sqft | DOM | Units | Dist |
|---|---|---|---|---|---|---|---|---|
| 8307 Charles Pl California City, CA | 3.0 | 2.0 | 1498 | $1,750 | $1.17 | 14d | 1 | 0.02mi |
| 8332 Rea Ave California City, CA | 4.0 | 3.0 | 1861 | $2,500 | $1.34 | 3d | 1 | 0.04mi |
| 8318 Dogbane Ave Unit F California City, CA | 2.0 | 1.0 | 880 | $1,350 | $1.53 | 23d | 1 | 0.73mi |
| 7819 Walpole Ave California City, CA | 2.0 | 1.0 | 900 | $1,399 | $1.55 | 23d | 1 | 0.79mi |
| 9019 Evelyn Ave California City, CA | 4.0 | 2.0 | 1731 | $2,600 | $1.50 | 3d | 1 | 0.80mi |
| 7733 Walpole Ave Unit A California City, CA | 3.0 | 2.0 | 1600 | $2,000 | $1.25 | 23d | 1 | 0.81mi |
| 8531 Columbine Ave Unit B California City, CA | 2.0 | 2.0 | 1000 | $1,300 | $1.30 | 14d | 1 | 0.84mi |
| 21032 79th St California City, CA | 4.0 | 2.0 | 1228 | $2,100 | $1.71 | 23d | 1 | 0.89mi |
| 8816 Fuchsia Ave Unit PASSTHROUGH B California City, CA | 2.0 | 2.0 | 1077 | $1,550 | $1.44 | 14d | 1 | 0.89mi |
| 21231 Corwin St California City, CA | 3.0 | 2.0 | 1632 | $2,500 | $1.53 | 23d | 1 | 0.94mi |
| 8709 Xavier Ave Unit 3 California City, CA | 2.0 | 1.0 | 900 | $1,500 | $1.67 | 14d | 1 | 0.94mi |
| 20961 83rd St Unit 6 California City, CA | 2.0 | 2.0 | 1100 | $1,300 | $1.18 | 23d | 1 | 0.96mi |
| 21001 Berry St Unit 5 California City, CA | 2.0 | 1.0 | 890 | $1,150 | $1.29 | 23d | 1 | 1.07mi |
| 7617 California City Blvd Apt B California City, CA | 2.0 | 1.0 | 894 | $1,225 | $1.37 | 3d | 1 | 1.08mi |
| 21411 Hacienda Blvd Unit D California City, CA | 2.0 | 2.0 | 898 | $1,475 | $1.64 | 23d | 1 | 1.10mi |
| 8651 S Loop Blvd California City, CA | 2.0 | 1.0 | 1050 | $1,650 | $1.57 | 3d | 1 | 1.21mi |
| 20673 Medio St California City, CA | 3.0 | 2.0 | 1690 | $2,075 | $1.23 | 23d | 1 | 1.22mi |
| 8100 Fernwood Ave California City, CA | 3.0 | 2.0 | 1336 | $1,850 | $1.38 | 23d | 1 | 1.27mi |
| 9524 Sally Ave Unit C California City, CA | 2.0 | 1.5 | 1140 | $1,300 | $1.14 | 23d | 1 | 1.28mi |
| 7317 California City Blvd California City, CA | 3.0 | 1.5 | 1228 | $1,725 | $1.40 | 19d | 1 | 1.28mi |
| 9548 Sally Ave Unit B California City, CA | 3.0 | 2.5 | 1200 | $1,695 | $1.41 | 23d | 1 | 1.32mi |
| 21811 69th St California City, CA | 3.0 | 2.0 | 1224 | $1,700 | $1.39 | 23d | 1 | 1.33mi |
| 21801 69th St California City, CA | 3.0 | 2.0 | 1344 | $1,700 | $1.26 | 23d | 1 | 1.33mi |
| 7113 Victor Pl Unit B California City, CA | 3.0 | 2.5 | 1240 | $1,600 | $1.29 | 23d | 1 | 1.34mi |
| 7343 Dogwood Ave California City, CA | 3.0 | 2.0 | 1301 | $2,250 | $1.73 | 23d | 1 | 1.41mi |
| 6833 Rea Ave California City, CA | 3.0 | 2.0 | 1512 | $1,395 | $0.92 | 23d | 1 | 1.43mi |
| 8801 S Loop Blvd California City, CA | 3.0 | 2.0 | 1537 | $2,600 | $1.69 | 23d | 1 | 1.44mi |
Listing history 16 events
-
2026-06-01days on market $275,000 Active 52 DOM
-
2026-05-31days on market $275,000 Active 51 DOM
-
2026-04-16historical $1,750
-
2026-04-10$275,000 Active 1093-char remark
Show marketing remark (1093 chars)
This inviting 3-bedroom, 2-bathroom home offers a comfortable blend of functionality, warmth, and natural light throughout. Soft carpeting extends through the living room and all bedrooms, creating a cozy and welcoming atmosphere. The kitchen features classic wood cabinetry and is equipped with a microwave, stove/oven, and dishwasher, offering convenience for everyday living and family dinners. Adjacent laundry hookups with additional cabinetry provide added storage and practicality. The thoughtfully designed floor plan separates the primary suite from the secondary bedrooms, enhancing privacy and flexibility for guests or household members. The primary bedroom includes a walk-in closet and an en-suite bathroom featuring dual sinks and a relaxing tub. The living room centers around a cozy fireplace, creating an inviting space for relaxing evenings at home. Additional highlights include central air conditioning and abundant natural light throughout. Step outside to a low-maintenance, zero-scaped backyard, offering a blank canvas ready for your personal touch and outdoor vision.
-
2026-03-30$1,750
-
2026-03-18historical $1,750
-
2026-02-13price $1,750
-
2026-01-07price $1,800
-
2025-11-18$1,885
-
2024-10-17historical $1,795
-
2024-09-28$1,795
-
2015-03-16historical
-
2013-02-04$59,900
-
2007-05-17$235,000
-
2006-02-24soldstatus $180,000
-
1995-08-11soldstatus $45,500
ⓘ Source: listings_history table (triggers on properties + properties_extension) + one-shot
backfill from property_details.listing_events for pre-trigger history.
Tax reassessment forecast CA · Resets to sale price
- Current annual tax
- $1,133 · $94/mo
- Projected year-2 tax
- $2,090 · $174/mo
- Expected delta
- +$957/yr (+$80/mo · 84.4%)
ⓘ Screening estimate from a state-policy table — verify with the county assessor before closing.
Climate risk First Street
- Flood 1/10 Low FEMA zone X (unshaded) · 0% chance over 30 yrs
- Wildfire 1/10 Low
- Heat 8/10 Severe 6 d/yr ≥101°F today · 14 d/yr by 30 yrs out
- Wind 1/10 Low
- Air quality 7/10 Severe 13 unhealthy d/yr today · 17 by 30 yrs out
Nearby sold comps map
Loading sold comps map…
Walkable amenities ~0.75 mi
Loading nearby amenities…
Taxation est. · year 1
- Rental income
- $23,816
- − Mortgage interest
- −$15,404
- − Property taxes
- −$1,133
- − Insurance
- −$1,375
- − Repairs & maintenance
- −$1,905
- − Management
- −$1,905
- − Depreciation
- −$8,000
- Taxable loss
- −$5,907
- Est. tax savings @ 24.0%
- +$1,418
- After-tax cash flow
- $419/yr
For passive investors: Depreciation is non-cash, so a rental often shows a tax loss while cash-flowing — sheltering income. Rental losses are passive: they offset passive income freely, and up to $25,000/yr can offset ordinary (W-2) income if you actively participate and your MAGI is under $100k (phasing out to $0 by $150k); unused losses carry forward. On sale, claimed depreciation is recaptured at up to 25%, and gains may owe capital-gains tax (a 1031 exchange can defer both). Figures are a year-1 estimate at your 24.0% rate — not tax advice; consult a CPA.
Schools (NCES district)
- District
- Mojave Unified
- NCES district ID
- 0625230
- Math proficiency
- 25% ▲ 11.00%
- Reading proficiency
- 25% ▼ -1.00%
- Median HH income
- $43,017
- Composite
- 21.4/100
- National rank
- #8350
- State rank
- #411 of 517 in CA
Livability — California City
- Score
- 44/100
- State rank
- #1329
- US rank
- #26753
Category grades
Schools grade is shown separately in the Schools card above.
Census & demographics
- Census place
- California City, CA
- County
- Kern County · 710,371 people
- City population
- 14,353
- Metro
- Bakersfield, CA
- Population (ZIP)
- 14,353
- Household income
- $59,827
- Rent vs Own
- Severe rent burden
- 883.0
Population outlook (Kern County) Hauer SSP2
- Today (2025)
- 947,286 people
- By 2030
- 978,984 · +3.3%
- By 2040
- 1,045,018 · +10.3%
- By 2050
- 1,105,232 · +16.7%
- By 2075
- 1,229,538 · +29.8%
- By 2100
- 1,238,059 · +30.7%
Race, ethnicity, and origin ACS 2023
- Neighborhood character
- Highly diverse neighborhood (Simpson 0.70)
- Race & ethnicity
- Hispanic / Latino 40% White 30% Black 22% Two or more races 16% Native American 3% Asian 1%
- Hispanic origin (detail)
- Mexican 29%
- Common ancestry
- Italian 3% Lithuanian 1% Romanian 1%
- Foreign-born
- 13% · Canada, Dominican Republic
- Languages at home
- 68% English-only · Spanish 29%
Political lean MEDSL · Kern
- 2024 margin
- Strong R (+21.1) · D 38.2% · R 59.3% · Other 2.5%
- 2008→2024 swing
- -3.3pp toward R · 2008: -17.8pp · 2024: -21.1pp
- All cycles
- 2024: R+21.1 2020: R+10.2 2016: R+15.0 2012: R+20.9 2008: R+17.8
Not yet ingested
- Civics
- —
Market trends
- HPI YoY
- ▲ 46.32%
- Current HPI
- 402.4192
- Rent YoY
- ▲ 5.45%
- Metro
- Bakersfield, CA
- State GDP YoY
- ▲ 3.21%
- F500 in state
- 116
Industry mix (Fortune 500 HQ in CA)
| Industry | F500 HQs | Revenue |
|---|---|---|
| Technology | 27 | $1,492B |
|
||
| Financial Services | 3 | $174B |
|
||
| Retail | 3 | $44B |
|
||
| Insurance | 3 | $26B |
|
||
| Media / Entertainment | 2 | $115B |
|
||
| Pharmaceuticals / Biotech | 2 | $62B |
|
||
Price history
-96.2% since first listed14 events — show timeline
- 2026-04-16 Rental Removed $1,750 APPFOLIO
- 2026-04-10 Listed $275,000 AVMLS
- 2026-03-30 Listed for Rent $1,750 APPFOLIO
- 2026-03-18 Rental Removed $1,750 APPFOLIO
- 2026-02-13 Price Changed $1,750 APPFOLIO
- 2026-01-07 Price Changed $1,800 APPFOLIO
- 2025-11-18 Listed for Rent $1,885 APPFOLIO
- 2024-10-17 Rental Removed $1,795 APPFOLIO
- 2024-09-28 Listed for Rent $1,795 APPFOLIO
- 2015-03-16 Listing Removed — AVMLS
- 2013-02-04 Listed $59,900 AVMLS
- 2007-05-17 Listed $235,000 AVMLS
- 2006-02-24 Sold (Public Records) $180,000 Public Records
- 1995-08-11 Sold (Public Records) $45,500 Public Records
Property tax history
+1.2%/yrLatest (2025): $1,133 · -4.4% YoY. Source: county tax records.
Cash-flow waterfall
monthlySold comps — $/sqft
last 12 mo · ≤1 miLoading sold comps…