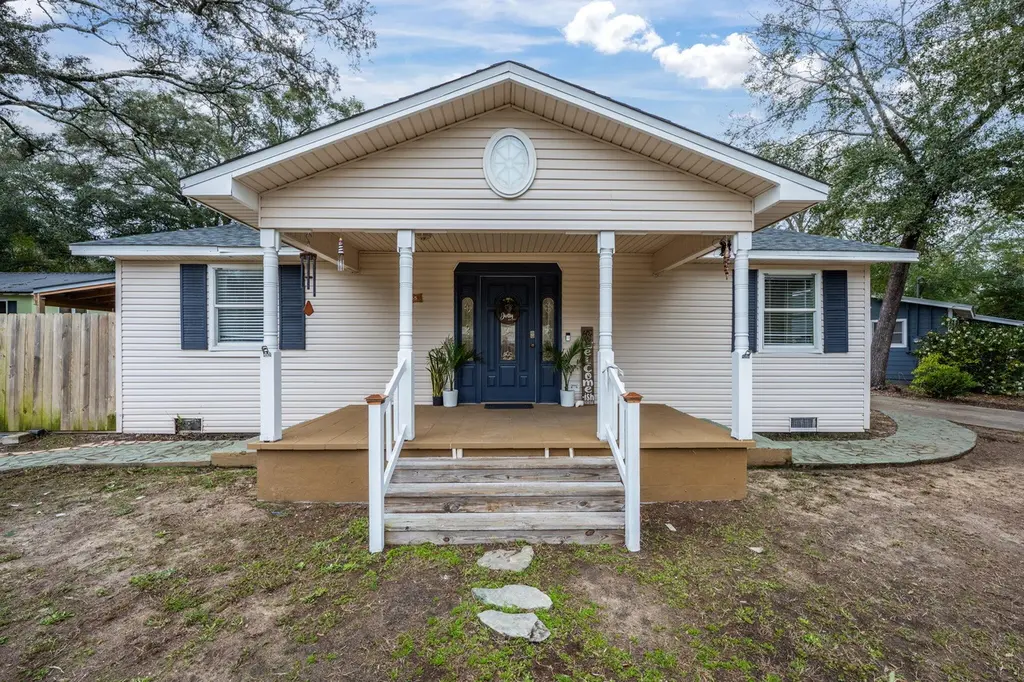
255 Edge Ave · Valparaiso, FL
Flood risk 1/10 · Minimal
- FEMA flood zone
- X (unshaded)
- Chance of flooding over 30 yrs
- 0.0%
- Est. flood insurance / yr
- $507 – $1,088
Fire risk 2/10 · Minimal
- Est. fire insurance / yr
- $947 – $1,759
Heat risk 10/10 · Severe
- Hot days now (above 103°F)
- 7 days/yr
- Hot days in 30 yrs
- 22 days/yr
Wind risk 9/10 · Severe
- Chance of severe wind over 30 yrs
- 99.0%
Air-quality risk 1/10 · Minimal
- Unhealthy air days now
- 0 days/yr
- Unhealthy air days in 30 yrs
- 0 days/yr
Risk factors via First Street. Map © Google.
Why this score? — see what drove the D grade
The composite is a weighted blend of 9 inputs, each scored 0–100. Each bar is that input's sub-score; the figure is the points it added to the 100-point composite (weight × sub-score).
- ARV discount +15.0/15.0
- Appreciation +6.5/10.0
- Cash flow +6.2/30.0
- Schools +5.2/10.0
- Livability +3.7/5.0
- Rent growth +2.5/5.0
- Condition / age +2.5/5.0
- 1% rule +0.9/10.0
- DSCR +0.5/10.0
$588,000
🖨 Deal sheet (PDF) 📄 Offer letter ✓ Due diligence
Listing remarks MLS
Nestled in the heart of Valparaiso, this 6 bedroom 3 bath gem has been thoughtfully upgraded to provide modern convenience. As you pull up, you'll love the oversized circular driveway, offering plenty of parking space. Step inside to find a chef's dream kitchen! Featuring quartz countertops, custom shaker cabinets, and stainless steel appliances. The gas stovetop and double oven make preparing meals a breeze, while the massive center island provides ample prep space and extra storage. This home boasts an open and airy layout with a seamless flow between the kitchen, dining, and living spaces. The main living area features tile flooring, neutral tones, and large windows that flood the space with natural light.
Key facts
- Quartz countertops
- Chef's dream kitchen
- Gas stovetop
Tags
Neighborhood map
What this means for you Summary
Snapshot
- This is a 5-bed/3.0-bath single-family listed at $588k.
Deal economics
- At list price, monthly cash flow is $-1k ($-13k/yr) — negative.
- To cash-flow at today's rent, offer at most $398k (32.3% below list).
- To meet the 1% rule (rent ≥ 1% of price), the offer needs to be $347k (40.9% below list).
- Recommended offer: $347k (40.9% below list) — sets the bar for 1% rule.
Location & tenants
- Location reads 74/100 on livability (#278 in FL, #4,319 nationally) — a middle-class / working-renter tenant base. Strengths: schools A+, crime A+, housing A+; Watch: health & safety C-, amenities F, commute F.
- Okaloosa (other): math 60% / reading 60% proficiency, ranked #12 of 73 in FL (top 16%) — acceptable for families but not a draw, mixed tenant base, ~2y average lease.
- Market conditions: 45 active listings in the ZIP; 2 comparable units currently listed for rent nearby; 1,268 units permitted in Okaloosa County in 2024 (175 in 5+ unit buildings).
Forward outlook
- In year one you build about $21k of equity ($4k loan paydown + $17k appreciation (3.0% local appreciation)).
- Okaloosa County population projected at +37% by 2050 — long-run rental-demand tailwind backs the buy-and-hold thesis.
- By year 2, paydown + projected appreciation supports a ~$35k cash-out refi (75% LTV) — recoverable capital for the next deal without selling this one.
Negotiation context
- It's been on market 92 days — a 9% lower offer ($535k) is reasonable based on typical stale-listing flexibility.
- 10 sale attempts since 18y ago with the ask held roughly flat each time — persistent listings suggest the price (not the market) is what's stuck; bring a comps-based counter.
- Current owner paid $380k; list at $588k implies a 55% gain — meaningful room to come down on a strong offer.
Risks & watch-outs
- Watch-outs: built in 1950 — expect roof / HVAC / electrical / plumbing capex.
- Climate carrying-cost: severe wind risk, 99% chance of damaging wind over 30y; extreme-heat days projected 7→22/yr by 2055 (HVAC capex compounding) — expect insurance premiums to compound above CPI over the hold.
Questions for the listing agent
- What do current leases actually rent for vs. the listed asking? Can we see a recent rent roll and the last 12 months of T-12 income?
- It's been on market 92 days. Have you received any prior offers? Is the seller open to a 41% concession, seller financing, or rate buy-down credit?
- Built in 1950 — when were the roof, HVAC, electrical panel, plumbing, and water heater last replaced?
- Why hasn't it sold? Are there any deal-killer items the seller is aware of (foundation, flood, title, zoning, code violations)?
- Is there a deadline driving the sale (1031 exchange, divorce, estate, relocation)? That informs how much negotiation room exists.
- Schools are A-rated — typically a magnet for longer-tenancy family renters. What's the average tenant stay here, and is there a school-zone premium baked into asking?
- The area grade is low — what's the realistic commute time and amenity access for the typical tenant pool here? Any planned neighborhood developments (good or bad) we should know about?
- What's the average days-on-market for RENTAL listings here right now (not sales)? A rising rental-DOM trend means longer vacancies and softer asking-rent achievability than the comps imply.
- What's the recent tenant-quality profile in this submarket — average credit score on applications, eviction rate, late-payment / NSF rate, and stable-employment percentage? A property-management company in the area should have these aggregated.
- How much new for-sale + rental construction is in the pipeline within 1–3 miles? Heavy new supply typically softens prices + rents 12–24 months out; constrained supply supports both.
Investment metrics
- 1% rule
- 0.59% ✗
- Cap rate
- 4.10%
- Cash-on-cash
- -7.84%
- DSCR
- 0.65
- GRM
- 14.1
CMA / ARV
- ARV (median comp)
- $858,203
- List price
- $588,000
- Delta
- -31.48%
- Verdict
- UNDERPRICED
- Comps
- 20 within 1.0 mi
Show comp detail 6 sales within ~0.75 mi
| Address | Dist | Beds/Ba | Sqft | Sold | Price | $/sf | Match |
|---|---|---|---|---|---|---|---|
| 231 Edge Ave | 0.15mi | 6/3.0 (+1) | 3,106 (-4%) | 13mo | $875,000 | $282 | 71 |
| 233 Edge Ave | 0.14mi | 6/3.0 (+1) | 3,106 (-4%) | 15mo | $875,000 | $282 | 70 |
| 309 Bayshore Dr | 0.55mi | 4/3.5 (-1) | 3,276 (+1%) | 13mo | $1,500,000 | $458 | 54 |
| 329 Bayshore Dr | 0.51mi | 4/3.5 (-1) | 3,274 (+1%) | 23mo | $1,200,000 | $367 | 48 |
| 304 Boggy Bayou Ct | 0.51mi | 5/3.5 | 3,706 (+15%) | 3mo | $1,700,000 | $459 | 47 |
| 417 Hideaway Ln | 0.71mi | 5/3.0 | 2,770 (-14%) | 3mo | $625,000 | $226 | 40 |
Match score weights: distance 35% · size 25% · config 20% · recency 20%. Top-matched comps best support the ARV.
Projected returns pro-forma
2.95% appreciation · 3.0% rent growth · sell at horizon
- IRR
- 0.1%
- Equity multiple
- 1.00×
- Total profit
- $587
- Equity at exit
- $262,665
- IRR
- 4.0%
- Equity multiple
- 1.61×
- Total profit
- $100,104
- Equity at exit
- $403,461
Cash invested: $164,640 (down + closing). Projections, not guarantees.
Landlord ↔ Tenant lean methodology
- Overall (STATE)
- 87 Strongly Landlord-Friendly
- State Florida
- 87 Strongly Landlord-Friendly · R+3
- County
- — inherits STATE
- City
- — inherits STATE
ZIP-level market 32580
- Home prices YoY
- 1.1%
- Active inventory
- 45
- Price-to-rent
- 14.1×
Monthly cashflow live
- Estimated rent
- $3,474 medium interval (Pro) →
- Mortgage (P&I)
- −$3,084
- Tax from tax record
- −$492 /mo · $5,905/yr
- Insurance
- −$245
- HOA
- −$0
- Vacancy / Maint / Mgmt
- −$730
- Net cashflow
- $-1,076
Break-even live
Sensitivity live
| Price | -10% $-743 | -5% $-910 | +0% $-1,076 | +5% $-1,242 | +10% $-1,409 |
|---|---|---|---|---|---|
| Rent | -10% $-1,350 | -5% $-1,213 | +0% $-1,076 | +5% $-939 | +10% $-801 |
| Rate | -1.0pp $-780 | -0.5pp $-926 | base $-1,076 | +0.5pp $-1,228 | +1.0pp $-1,383 |
UW: 25.0% down · 7.5% · 30yr · 1.5% tax · 5.0% vac · 8.0% maint · 8.0% mgmt
Financing live
Cash to close
- Down payment
- $147,000
- Closing costs
- $17,640
- Reserves months
- —
- Total cash needed
- —
Loan-product check · same deal, 3 products live
Conventional
25% down · 7.5% · 30yr
- Down + closing
- —
- Monthly P&I
- —
- Monthly cashflow
- —
- DSCR
- —
- Eligible?
- —
Personal DTI + credit; lowest rate.
DSCR
20% down · 8.5% · 30yr
- Down + closing
- —
- Monthly P&I
- —
- Monthly cashflow
- —
- DSCR
- —
- Eligible?
- —
No personal income docs; deal must DSCR.
Hard money
10% down · 12.0% · 12mo
- Down + closing
- —
- Monthly P&I
- —
- Monthly cashflow
- —
- DSCR
- —
- Eligible?
- —
Short-term bridge; refi at stabilization.
Rent comps 2 comps
| Address | Beds | Baths | Sqft | Rent | $/sqft | DOM | Units | Dist |
|---|---|---|---|---|---|---|---|---|
| 166 Raiders Trl Lot 28 Valparaiso, FL | 4.0 | 3.0 | 2517 | $3,450 | $1.37 | 15d | 1 | 1.18mi |
| 160 Raiders Trl Valparaiso, FL | 4.0 | 3.0 | 2525 | $3,500 | $1.39 | 45d | 1 | 1.25mi |
Listing history 38 events
-
2026-06-21days on market $588,000 Active 92 DOM
-
2026-06-18days on market $588,000 Active 89 DOM
-
2026-06-17days on market $588,000 Active 88 DOM
-
2026-06-16days on market $588,000 Active 87 DOM
-
2026-06-15days on market $588,000 Active 86 DOM
-
2026-06-14days on market $588,000 Active 84 DOM
-
2026-06-13days on market $588,000 Active 83 DOM
-
2026-06-10days on market $588,000 Active 81 DOM
-
2026-06-09days on market $588,000 Active 80 DOM
-
2026-06-08days on market $588,000 Active 79 DOM
-
2026-06-07days on market $588,000 Active 78 DOM
-
2026-06-05days on market $588,000 Active 75 DOM
-
2026-06-03price $588,000 Active 73 DOM
-
2026-06-02days on market $590,000 Active 73 DOM
-
2026-06-01days on market $590,000 Active 72 DOM
-
2026-05-31days on market $590,000 Active 71 DOM
-
2026-05-30days on market $590,000 Active 70 DOM
-
2026-04-28price $590,000 718-char remark
Show marketing remark (718 chars)
Nestled in the heart of Valparaiso, this 6 bedroom 3 bath gem has been thoughtfully upgraded to provide modern convenience. As you pull up, you'll love the oversized circular driveway, offering plenty of parking space. Step inside to find a chef's dream kitchen! Featuring quartz countertops, custom shaker cabinets, and stainless steel appliances. The gas stovetop and double oven make preparing meals a breeze, while the massive center island provides ample prep space and extra storage. This home boasts an open and airy layout with a seamless flow between the kitchen, dining, and living spaces. The main living area features tile flooring, neutral tones, and large windows that flood the space with natural light.
-
2026-03-21$600,000 Active 718-char remark
Show marketing remark (718 chars)
Nestled in the heart of Valparaiso, this 6 bedroom 3 bath gem has been thoughtfully upgraded to provide modern convenience. As you pull up, you'll love the oversized circular driveway, offering plenty of parking space. Step inside to find a chef's dream kitchen! Featuring quartz countertops, custom shaker cabinets, and stainless steel appliances. The gas stovetop and double oven make preparing meals a breeze, while the massive center island provides ample prep space and extra storage. This home boasts an open and airy layout with a seamless flow between the kitchen, dining, and living spaces. The main living area features tile flooring, neutral tones, and large windows that flood the space with natural light.
-
2025-02-27$600,000 Active
-
2022-01-20soldstatus $380,000
-
2022-01-07soldstatus $250,000
-
2015-03-18soldstatus $95,000
-
2015-03-13soldstatus $95,000
-
2015-03-13soldstatus $95,000
-
2014-09-03$109,850
-
2014-09-03historical
-
2014-02-26$128,050
-
2014-02-26$128,050
-
2013-10-12historical
-
2011-04-11$224,000
-
2011-04-11$224,000
-
2009-10-10historical
-
2009-03-28$284,900
-
2009-03-21historical
-
2008-12-17$340,000
-
2008-12-17$340,000
-
1992-10-01soldstatus $44,500
ⓘ Source: listings_history table (triggers on properties + properties_extension) + one-shot
backfill from property_details.listing_events for pre-trigger history.
Tax reassessment forecast FL · Resets to sale price
- Current annual tax
- $5,905 · $492/mo
- Projected year-2 tax
- $5,905 · $492/mo
- Expected delta
- $0/yr ($0/mo · 0.0%)
ⓘ Screening estimate from a state-policy table — verify with the county assessor before closing.
Climate risk First Street
- Flood 1/10 Low FEMA zone X (unshaded) · 0% chance over 30 yrs
- Wildfire 2/10 Low
- Heat 10/10 Extreme 7 d/yr ≥103°F today · 22 d/yr by 30 yrs out
- Wind 9/10 Extreme 99% chance of damaging wind over 30 yrs
- Air quality 1/10 Low 0 unhealthy d/yr today · 0 by 30 yrs out
Nearby sold comps map
Loading sold comps map…
Walkable amenities ~0.75 mi
Loading nearby amenities…
Taxation est. · year 1
- Rental income
- $41,691
- − Mortgage interest
- −$32,937
- − Property taxes
- −$5,905
- − Insurance
- −$2,940
- − Repairs & maintenance
- −$3,335
- − Management
- −$3,335
- − Depreciation
- −$17,105
- Taxable loss
- −$23,867
- Est. tax savings @ 24.0%
- +$5,728
- After-tax cash flow
- $-7,183/yr
For passive investors: Depreciation is non-cash, so a rental often shows a tax loss while cash-flowing — sheltering income. Rental losses are passive: they offset passive income freely, and up to $25,000/yr can offset ordinary (W-2) income if you actively participate and your MAGI is under $100k (phasing out to $0 by $150k); unused losses carry forward. On sale, claimed depreciation is recaptured at up to 25%, and gains may owe capital-gains tax (a 1031 exchange can defer both). Figures are a year-1 estimate at your 24.0% rate — not tax advice; consult a CPA.
Schools (NCES district)
- District
- Okaloosa
- NCES district ID
- 1201380
- Math proficiency
- 60% ▼ -12.00%
- Reading proficiency
- 60% ▼ -4.00%
- Median HH income
- $55,601
- Composite
- 51.62/100
- National rank
- #1705
- State rank
- #12 of 73 in FL
Livability — Valparaiso
- Score
- 74/100
- State rank
- #278
- US rank
- #4319
Category grades
Schools grade is shown separately in the Schools card above.
Census & demographics
- Census place
- Valparaiso, FL
- City population
- 4,117
- Population (ZIP)
- 4,117
Population outlook (Okaloosa County) Hauer SSP2
- Today (2025)
- 235,133 people
- By 2030
- 253,483 · +7.8%
- By 2040
- 289,537 · +23.1%
- By 2050
- 322,954 · +37.3%
- By 2075
- 399,624 · +70.0%
- By 2100
- 425,311 · +80.9%
Race, ethnicity, and origin ACS 2023
- Neighborhood character
- Predominantly White (73%)
- Race & ethnicity
- White 73% Black 11% Hispanic / Latino 8% Two or more races 7% Asian 1%
- Hispanic origin (detail)
- Mexican 2% Puerto Rican 1% Dominican 1%
- Common ancestry
- Romanian 5% Italian 4% Slovak 3%
- Foreign-born
- 3% · Canada, South Korea
- Languages at home
- 98% English-only · Korean 1% Spanish 1%
Political lean MEDSL · Okaloosa
- 2024 margin
- Solid R (+42.4) · D 28.2% · R 70.7% · Other 1.1%
- 2008→2024 swing
- +2.5pp toward D · 2008: -44.9pp · 2024: -42.4pp
- All cycles
- 2024: R+42.4 2020: R+39.1 2016: R+47.8 2012: R+49.4 2008: R+44.9
Not yet ingested
- Civics
- —
Market trends
- HPI YoY
- ▲ 2.95%
- Current HPI
- 266.6313
- Rent YoY
- —
- Metro
- —
- State GDP YoY
- ▲ 3.28%
- F500 in state
- 36
Industry mix (Fortune 500 HQ in FL)
| Industry | F500 HQs | Revenue |
|---|---|---|
| Industrial Technology | 2 | $29B |
|
||
| Insurance | 2 | $17B |
|
||
| Retail | 1 | $60B |
|
||
| Technology Distribution | 1 | $58B |
|
||
| Homebuilding | 1 | $35B |
|
||
| Technology Manufacturing | 1 | $35B |
|
||
Price history
+1225.8% since first listed21 events — show timeline
- 2026-04-28 Price Changed $590,000 ECAR
- 2026-03-21 Listed $600,000 ECAR
- 2025-02-27 Listed $600,000 ECAR
- 2022-01-20 Sold (Public Records) $380,000 Public Records
- 2022-01-07 Sold (Public Records) $250,000 Public Records
- 2015-03-18 Sold (Public Records) $95,000 Public Records
- 2015-03-13 Sold (MLS) $95,000 ECAR
- 2015-03-13 Sold (MLS) $95,000 NAMLS
- 2014-09-03 Listing Removed — NAMLS
- 2014-09-03 Listed $109,850 NAMLS
- 2014-02-26 Listed $128,050 NAMLS
- 2014-02-26 Listed $128,050 ECAR
- 2013-10-12 Listing Removed — NAMLS
- 2011-04-11 Listed $224,000 NAMLS
- 2011-04-11 Listed $224,000 ECAR
- 2009-10-10 Listing Removed — NAMLS
- 2009-03-28 Listed $284,900 NAMLS
- 2009-03-21 Listing Removed — NAMLS
- 2008-12-17 Listed $340,000 NAMLS
- 2008-12-17 Listed $340,000 ECAR
- 1992-10-01 Sold (Public Records) $44,500 Public Records
Property tax history
+4.9%/yrLatest (2025): $5,905 · +1.6% YoY. Source: county tax records.
Cash-flow waterfall
monthlySold comps — $/sqft
last 12 mo · ≤1 miLoading sold comps…