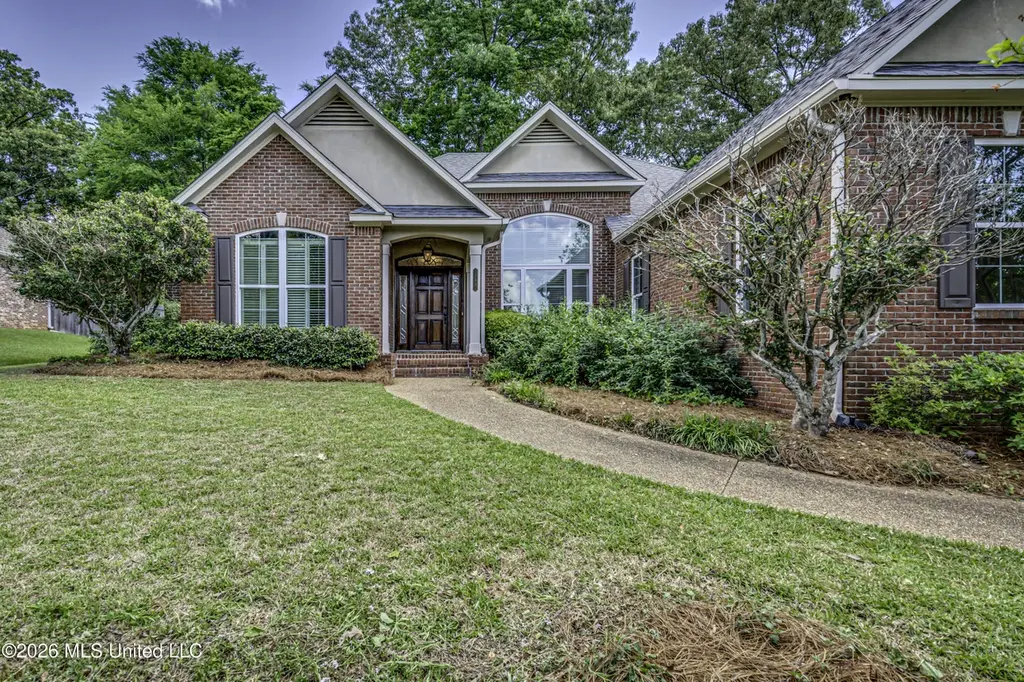
248 Oak Park Dr · Madison, MS
Flood risk 1/10 · Minimal
- FEMA flood zone
- X (unshaded)
- Chance of flooding over 30 yrs
- 0.0%
- Est. flood insurance / yr
- $507 – $1,088
Fire risk 1/10 · Minimal
- Est. fire insurance / yr
- $1,241 – $2,305
Heat risk 7/10 · Major
- Hot days now (above 108°F)
- 7 days/yr
- Hot days in 30 yrs
- 20 days/yr
Wind risk 8/10 · Major
- Chance of severe wind over 30 yrs
- 80.0%
Air-quality risk 2/10 · Minimal
- Unhealthy air days now
- 0 days/yr
- Unhealthy air days in 30 yrs
- 1 days/yr
Risk factors via First Street. Map © Google.
Why this score? — see what drove the D- grade
The composite is a weighted blend of 9 inputs, each scored 0–100. Each bar is that input's sub-score; the figure is the points it added to the 100-point composite (weight × sub-score).
- ARV discount +9.9/15.0
- Cash flow +9.6/30.0
- Schools +4.8/10.0
- Livability +4.0/5.0
- Rent growth +3.2/5.0
- DSCR +2.7/10.0
- 1% rule +2.6/10.0
- Condition / age +2.5/5.0
- Appreciation +0.0/10.0
$389,900
🖨 Deal sheet 📄 Offer letter ✓ Due diligence
Listing remarks
Want to live in the Madison Avenue/Madison Central school district, neighborhood with a pool, and need 4 bedrooms and 3 full baths and an office that has been completely updated? This is it! Roof, windows, and attic insulation are only two years old, two tankless water heaters that are only three years old, lifetime transferrable warranty from Oldshan and been completely remodled.
Key facts
- Two years old roof
- Completely remodeled
- 0.5 acre lot
Tags
Property features AI
Finance
- HOA & community: Community pool; Homeowners association with annual fee of $450 (management included)
Exterior
- Parking: 2-car garage; Garage with storage; Concrete parking
- Utilities: Public water; Public sewer; Electricity available; Natural gas connected; Cable available; Fiber to the house; Sewer connected; Water connected
- Home design: Single-family residence (house); One story; Move-in ready
- Construction: Brick construction; Architectural shingle roof; Post-tension slab foundation; Built per assessor/appraiser sources
- Exterior features: Rear porch; Fenced yard (wood, full); Front yard landscaping
Interior
- Kitchen: Dishwasher; Disposal; Electric range; Microwave; Granite counters; Eat-in kitchen
- Flooring: Luxury vinyl; Tile
- Bathrooms: Three full bathrooms; Double vanity(s) noted
- Heating & cooling: Central heating; Central air conditioning; Electric and gas cooling options; Tankless water heater
- Interior features: Bookcases; Ceiling fans; Crown molding; Double vanities; Eat-in kitchen; Entrance foyer; High ceilings; Open floorplan; Soaking tub; Walk-in closets; Granite counters; ENERGY STAR qualified and insulated windows with blinds; Living room fireplace
- Laundry & utility: Main-level laundry room; Washer hookup; Electric dryer hookup; In-hall laundry
Neighborhood map
What this means for you Summary
Snapshot
- This is a 4-bed/4.0-bath single-family listed at $390k.
Deal economics
- At list price, monthly cash flow is $-264 ($-3k/yr) — negative.
- To cash-flow at today's rent, offer at most $343k (11.9% below list).
- To meet the 1% rule (rent ≥ 1% of price), the offer needs to be $296k (24.1% below list).
- Recommended offer: $296k (24.1% below list) — sets the bar for 1% rule.
- Cap rate 5.5% vs local median 3.7% in Madison — top-decile yield for the area; either an underpriced asset or a hidden risk that comps aren't pricing in. Stress-test before assuming the spread holds.
Location & tenants
- Location reads 81/100 on livability (#4 in MS, #1,556 nationally) — a professional / high-income tenant draw. Strengths: crime A+, employment A+, housing A+; Watch: amenities D-, commute F.
- Madison County School District (rural): math 54% / reading 54% proficiency, ranked #3 of 130 in MS (top 2%) — acceptable for families but not a draw, mixed tenant base, ~2y average lease.
- Zoned schools: Madison Avenue Lower Elementary (437 students, 99% FRL); Madison Middle School (math 66% / reading 57%, grade B+, #6 of 179 statewide, top 3%, 1,154 students, 100% FRL); Madison Central High School (math 5% / reading 63%, grade F, #78 of 197 statewide, top 39%, 1,246 students, 100% FRL) — zoned schools average 100% FRL vs 29% district-wide (70 pts higher); higher-poverty schools than district average — tighter screening recommended.
- Market conditions: Rents rising (+2.6%/yr); 628 active listings in the ZIP; 3 comparable units currently listed for rent nearby; rentals lingering (median 44d on market — plan ~5-8 weeks vacancy on turnover, expect pricing pressure); 67% of comp listings sitting > 30 days — soft ceiling on asking rent; high-income renter base; 553 units permitted in Madison County in 2024 (0 in 5+ unit buildings).
Forward outlook
- Local home prices are declining (-3.0%/yr); year-one equity from $3k of loan paydown is wiped out by about $12k of value loss. Plan a longer hold.
- Madison County population projected at +34% by 2050 — long-run rental-demand tailwind backs the buy-and-hold thesis.
Negotiation context
- It's been on market 17 days — a 2% lower offer ($384k) is reasonable based on typical stale-listing flexibility.
- 3 sale attempts since 2y ago with the ask held roughly flat each time — persistent listings suggest the price (not the market) is what's stuck; bring a comps-based counter.
Risks & watch-outs
- Climate carrying-cost: severe wind risk, 80% chance of damaging wind over 30y; extreme-heat days projected 7→20/yr by 2055 (HVAC capex compounding) — expect insurance premiums to compound above CPI over the hold.
Questions for the listing agent
- What do current leases actually rent for vs. the listed asking? Can we see a recent rent roll and the last 12 months of T-12 income?
- What does the HOA fee cover, when was the last increase, and are there any pending special assessments or reserve-fund shortfalls?
- Is there a deadline driving the sale (1031 exchange, divorce, estate, relocation)? That informs how much negotiation room exists.
- Schools are A-rated — typically a magnet for longer-tenancy family renters. What's the average tenant stay here, and is there a school-zone premium baked into asking?
- The area grade is low — what's the realistic commute time and amenity access for the typical tenant pool here? Any planned neighborhood developments (good or bad) we should know about?
- What's the average days-on-market for RENTAL listings here right now (not sales)? A rising rental-DOM trend means longer vacancies and softer asking-rent achievability than the comps imply.
- What's the recent tenant-quality profile in this submarket — average credit score on applications, eviction rate, late-payment / NSF rate, and stable-employment percentage? A property-management company in the area should have these aggregated.
- How much new for-sale + rental construction is in the pipeline within 1–3 miles? Heavy new supply typically softens prices + rents 12–24 months out; constrained supply supports both.
Investment metrics
- 1% rule
- 0.76% ✗
- Cap rate
- 5.48%
- Cash-on-cash
- -2.90%
- DSCR
- 0.87
- GRM
- 11.0
CMA / ARV
- ARV (median comp)
- $412,324
- List price
- $389,900
- Delta
- -5.44%
- Verdict
- FAIR
- Comps
- 20 within 1.0 mi
Show comp detail 12 sales within ~0.75 mi
| Address | Dist | Beds/Ba | Sqft | Sold | Price | $/sf | Match |
|---|---|---|---|---|---|---|---|
| 161 Victoria Pl | 0.32mi | 4/3.0 | 2,638 (+3%) | 2mo | $565,000 | $214 | 75 |
| 856 Wellington Way | 0.32mi | 4/3.5 | 2,538 (-1%) | 9mo | $364,000 | $143 | 74 |
| 1013 Laramie Ct | 0.17mi | 4/2.5 | 2,367 (-8%) | 1mo | $345,000 | $146 | 72 |
| 1616 Baywood Dr | 0.42mi | 4/3.0 | 2,670 (+4%) | 4mo | $410,000 | $154 | 66 |
| 265 Woodland Brook Dr | 0.12mi | 4/2.5 | 2,250 (-12%) | 6mo | $339,000 | $151 | 63 |
| 129 Victoria Pl | 0.35mi | 4/2.5 | 2,804 (+9%) | 3mo | $497,000 | $177 | 60 |
| 1005 Laramie Ct | 0.17mi | 5/4.0 (+1) | 2,900 (+13%) | 7mo | $493,500 | $170 | 59 |
| 138 Oakmont Dr | 0.47mi | 4/3.0 | 2,335 (-9%) | 2mo | $275,000 | $118 | 58 |
| 1205 Woodberry Dr | 0.30mi | 4/3.0 | 2,931 (+14%) | 2mo | $469,000 | $160 | 57 |
| 216 Woodland Brook Dr | 0.35mi | 4/3.0 | 2,217 (-14%) | 3mo | $330,000 | $149 | 54 |
| 1128 Windrose Cir | 0.38mi | 4/3.0 | 2,250 (-12%) | 8mo | $369,000 | $164 | 52 |
| 262 Geneva Blvd | 0.51mi | 3/2.0 (-1) | 2,208 (-14%) | 7mo | $384,900 | $174 | 34 |
Match score weights: distance 35% · size 25% · config 20% · recency 20%. Top-matched comps best support the ARV.
Projected returns pro-forma
-3.0% appreciation · 2.61% rent growth · sell at horizon
- IRR
- -21.6%
- Equity multiple
- 0.26×
- Total profit
- $-81,145
- Equity at exit
- $58,135
- IRR
- -16.2%
- Equity multiple
- 0.11×
- Total profit
- $-97,047
- Equity at exit
- $33,711
Cash invested: $109,172 (down + closing). Projections, not guarantees.
Landlord ↔ Tenant lean methodology
- Overall (STATE)
- 90 Strongly Landlord-Friendly
- State Mississippi
- 90 Strongly Landlord-Friendly · R+11
- County
- — inherits STATE
- City
- — inherits STATE
ZIP-level market 39110
- Home prices YoY
- -28.3%
- Rents YoY
- 2.6%
- Active inventory
- 628
- Price-to-rent
- 11.0×
Monthly cashflow live
- Estimated rent
- $2,961 medium interval (Pro) →
- Mortgage (P&I)
- −$2,045
- Tax from tax record
- −$358 /mo · $4,295/yr
- Insurance
- −$162
- HOA
- −$38
- Vacancy / Maint / Mgmt
- −$622
- Net cashflow
- $-264
Break-even live
UW: 25.0% down · 7.5% · 30yr · 1.5% tax · 5.0% vac · 8.0% maint · 8.0% mgmt
Financing live
Cash to close
- Down payment
- $97,475
- Closing costs
- $11,697
- Reserves months
- —
- Total cash needed
- —
Loan-product check · same deal, 3 products live
Conventional
25% down · 7.5% · 30yr
- Down + closing
- —
- Monthly P&I
- —
- Monthly cashflow
- —
- DSCR
- —
- Eligible?
- —
Personal DTI + credit; lowest rate.
DSCR
20% down · 8.5% · 30yr
- Down + closing
- —
- Monthly P&I
- —
- Monthly cashflow
- —
- DSCR
- —
- Eligible?
- —
No personal income docs; deal must DSCR.
Hard money
10% down · 12.0% · 12mo
- Down + closing
- —
- Monthly P&I
- —
- Monthly cashflow
- —
- DSCR
- —
- Eligible?
- —
Short-term bridge; refi at stabilization.
Rent comps 3 comps
| Address | Beds | Baths | Sqft | Rent | $/sqft | DOM | Units | Dist |
|---|---|---|---|---|---|---|---|---|
| 143 Sonnett Cir Madison, MS | 4.0 | 3.0 | 2564 | $3,250 | $1.27 | 23d | 1 | 1.24mi |
| 345 Avonlea Ln Madison, MS | 3.0 | 2.0 | 2185 | $2,500 | $1.14 | 43d | 1 | 1.25mi |
| 1011 Mcdale Ln Madison, MS | 4.0 | 2.0 | 2036 | $2,500 | $1.23 | 43d | 1 | 1.43mi |
HOA detail
- Monthly dues
- $38 · $456/yr
- Likely covers
- waterpool
Listing history 9 events
-
2026-05-13status Pending 384-char remark
-
2026-04-25$389,900 Active 384-char remark
-
2025-03-07soldstatus
-
2025-02-24price $279,900
-
2025-02-10status Active
-
2024-12-27status Pending
-
2024-12-27historical
-
2024-12-20$289,900 Active
-
2001-03-13soldstatus
ⓘ Source: listings_history table (triggers on properties + properties_extension) + one-shot
backfill from property_details.listing_events for pre-trigger history.
Tax reassessment forecast MS · Resets to sale price
- Current annual tax
- $4,295 · $358/mo
- Projected year-2 tax
- $4,295 · $358/mo
- Expected delta
- $0/yr ($0/mo · 0.0%)
ⓘ Screening estimate from a state-policy table — verify with the county assessor before closing.
Climate risk First Street
- Flood 1/10 Low FEMA zone X (unshaded) · 0% chance over 30 yrs
- Wildfire 1/10 Low
- Heat 7/10 Severe 7 d/yr ≥108°F today · 20 d/yr by 30 yrs out
- Wind 8/10 Severe 80% chance of damaging wind over 30 yrs
- Air quality 2/10 Low 0 unhealthy d/yr today · 1 by 30 yrs out
Nearby sold comps map
Loading sold comps map…
Walkable amenities ~0.75 mi
Loading nearby amenities…
Taxation est. · year 1
- Rental income
- $35,534
- − Mortgage interest
- −$21,840
- − Property taxes
- −$4,295
- − Insurance
- −$1,950
- − Repairs & maintenance
- −$2,843
- − Management
- −$2,843
- − HOA
- −$456
- − Depreciation
- −$11,343
- Taxable loss
- −$10,035
- Est. tax savings @ 24.0%
- +$2,408
- After-tax cash flow
- $-756/yr
For passive investors: Depreciation is non-cash, so a rental often shows a tax loss while cash-flowing — sheltering income. Rental losses are passive: they offset passive income freely, and up to $25,000/yr can offset ordinary (W-2) income if you actively participate and your MAGI is under $100k (phasing out to $0 by $150k); unused losses carry forward. On sale, claimed depreciation is recaptured at up to 25%, and gains may owe capital-gains tax (a 1031 exchange can defer both). Figures are a year-1 estimate at your 24.0% rate — not tax advice; consult a CPA.
Schools (NCES district)
- District
- Madison County School District
- NCES district ID
- 2802790
- Math proficiency
- 54% ▼ -7.00%
- Reading proficiency
- 54% ▼ -7.00%
- Median HH income
- $70,579
- Composite
- 48.08/100
- National rank
- #2188
- State rank
- #3 of 130 in MS
Livability — Madison
- Score
- 81/100
- State rank
- #4
- US rank
- #1556
Category grades
Schools grade is shown separately in the Schools card above.
Census & demographics
- Census place
- Madison, MS
- County
- Madison County · 75,005 people
- City population
- 50,443
- Metro
- Jackson, MS
- Population (ZIP)
- 50,443
- Household income
- $125,506
- Rent vs Own
- Severe rent burden
- 227.0
Population outlook (Madison County) Hauer SSP2
- Today (2025)
- 122,509 people
- By 2030
- 131,737 · +7.5%
- By 2040
- 148,930 · +21.6%
- By 2050
- 164,300 · +34.1%
- By 2075
- 197,495 · +61.2%
- By 2100
- 211,429 · +72.6%
Race, ethnicity, and origin ACS 2023
- Neighborhood character
- Predominantly White (76%)
- Race & ethnicity
- White 76% Black 15% Asian 4% Two or more races 3% Hispanic / Latino 2%
- Common ancestry
- Italian 6% Slovak 3% Lithuanian 3%
- Foreign-born
- 5% · China, Canada
- Languages at home
- 92% English-only · Spanish 2% Other Indo-European 2% Chinese 1%
Political lean MEDSL · Madison
- 2024 margin
- R (+17.3) · D 40.8% · R 58.0% · Other 1.2%
- 2008→2024 swing
- -1.7pp toward R · 2008: -15.6pp · 2024: -17.3pp
- All cycles
- 2024: R+17.3 2020: R+11.8 2016: R+16.1 2012: R+15.7 2008: R+15.6
Not yet ingested
- Civics
- —
Market trends
- HPI YoY
- ▼ -60.99%
- Current HPI
- 154.6909
- Rent YoY
- ▲ 2.61%
- Metro
- Jackson, MS
- State GDP YoY
- —
- F500 in state
- 0
Price history
+34.5% since first listed10 events — show timeline
- 2026-06-17 Sold (MLS) — MLSU
- 2026-05-13 Pending — MLSU
- 2026-04-25 Listed $389,900 MLSU
- 2025-03-07 Sold (Public Records) — Public Records
- 2025-02-24 Price Changed $279,900 MLSU
- 2025-02-10 Relisted — MLSU
- 2024-12-27 Pending — MLSU
- 2024-12-27 Listing Removed — MLSU
- 2024-12-20 Listed $289,900 MLSU
- 2001-03-13 Sold (Public Records) — Public Records
Property tax history
+3.3%/yrLatest (2025): $4,295 · +67.6% YoY. Source: county tax records.
Cash-flow waterfall
monthlySold comps — $/sqft
last 12 mo · ≤1 miLoading sold comps…