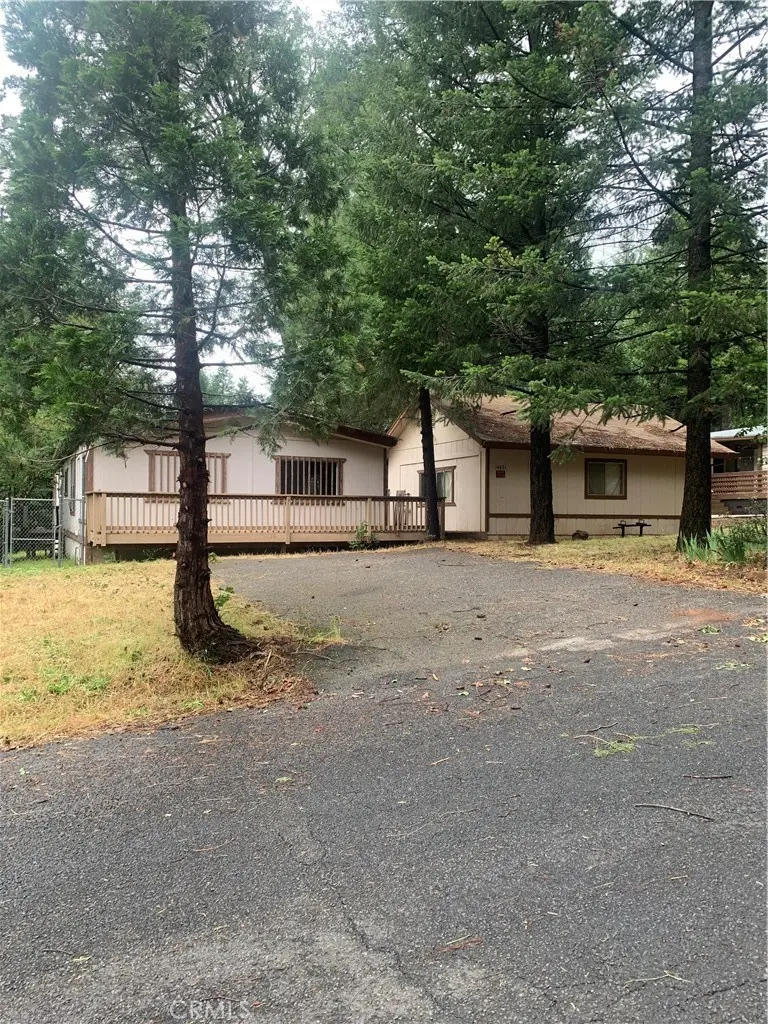
14831 Goldcone · Magalia, CA
Flood risk 1/10 · Minimal
- FEMA flood zone
- X (unshaded)
- Chance of flooding over 30 yrs
- 0.0%
- Est. flood insurance / yr
- $507 – $1,088
Fire risk 7/10 · Major
- Est. fire insurance / yr
- $659 – $1,223
Heat risk 4/10 · Minor
- Hot days now (above 96°F)
- 7 days/yr
- Hot days in 30 yrs
- 17 days/yr
Wind risk 1/10 · Minimal
- Chance of severe wind over 30 yrs
- —
Air-quality risk 10/10 · Severe
- Unhealthy air days now
- 37 days/yr
- Unhealthy air days in 30 yrs
- 42 days/yr
Risk factors via First Street. Map © Google.
Why this score? — see what drove the B+ grade
The composite is a weighted blend of 9 inputs, each scored 0–100. Each bar is that input's sub-score; the figure is the points it added to the 100-point composite (weight × sub-score).
- Cash flow +30.0/30.0
- ARV discount +15.0/15.0
- DSCR +10.0/10.0
- 1% rule +9.8/10.0
- Schools +5.0/10.0
- Livability +2.6/5.0
- Rent growth +2.5/5.0
- Condition / age +2.5/5.0
- Appreciation +0.0/10.0
$99,000
🖨 Deal sheet (PDF) 📄 Offer letter ✓ Due diligence
Listing remarks MLS
High ceiling in living room, dining room and den. Great woodstove and built in hutch in dining room Pantry and breakfast bar in kitchen. Large Garden tub and separate shower in master bath. Split bedroom plan. Large laundry room with sink, desk and lots of cabinets. Separate building with a 3/4 bath could be used as a game room, workshop, guest quarters or studio. 433A Foundation . Square feet, year and lot size from Realist . Buyer to verify if important
Key facts
- 0.23 acre lot
- Built 1980
- Listed 6 days
Property features AI
Finance
- Other: Zoning: RT-1; Paved road access; Parcel number 065310028000; Directions: Skyway right on Rosewood to end, left on Northwood, right on Fallen Leaf to Goldcone to the left
- Financial info: Assessments: Unknown
- HOA & community: Rural community with horse trails; Biking and fishing nearby; Foothills setting
Exterior
- Utilities: Septic tank; Private water
- Home design: Manufactured house; Single-story; One total unit; No shared/common walls; No accessory dwelling unit (ADU)
- Construction: Metal roof; Year built per assessor
- Exterior features: Yard; Chain link fence; No pool; Has view; Lot listed from assessor's data
Interior
- Bedrooms: All bedrooms on ground floor; At least one bedroom on the main level
- Bathrooms: 2 full bathrooms; One main-level bathroom
- Heating & cooling: Central furnace heating; Has cooling (details in remarks)
- Interior features: One-level home; Entry at level; Main floor bedroom(s); Living room; Den with fireplace
- Laundry & utility: Laundry room inside the home
Neighborhood map
What this means for you Summary
Snapshot
- This is a 3-bed/2.0-bath manufactured listed at $99k.
Deal economics
- At list price, monthly cash flow is $516 ($6k/yr) — positive.
- The deal already cash-flows at list — no discount required.
- Meets the 1% rule at list price ($1k rent vs $99k).
- Cap rate 12.5% vs local median 4.0% in Magalia — top-decile yield for the area; either an underpriced asset or a hidden risk that comps aren't pricing in. Stress-test before assuming the spread holds.
Location & tenants
- Location reads 51/100 on livability (#1,094 in CA) — a working-class tenant base; expect higher turnover. Strengths: housing A+; Watch: employment C-, schools F, crime F.
- Market conditions: 211 active listings in the ZIP; 4 comparable units currently listed for rent nearby; rentals at typical pace (median 14d on market — plan ~3-4 weeks tenant-placement turnaround); 946 units permitted in Butte County in 2024 (254 in 5+ unit buildings).
Forward outlook
- Local home prices are declining (-3.0%/yr); year-one equity from $684 of loan paydown is wiped out by about $3k of value loss. Plan a longer hold.
- Butte County population projected at +10% by 2050 — modest demand growth; plan on rents tracking national, not racing it.
- At projected returns (-3.0% appreciation + 3.0% rent growth), your $28k cash investment doubles in ~6 years — after that, you're playing with house money.
Negotiation context
- Only 6 days on market — expect competitive offers; lowballing is unlikely to land.
- 4 sale attempts since 20y ago with the ask held roughly flat each time — persistent listings suggest the price (not the market) is what's stuck; bring a comps-based counter.
- Current owner paid $75k; 32% above their basis — modest negotiation headroom, anchor on the comps not their cost.
Risks & watch-outs
- Climate carrying-cost: major wildfire risk — expect insurance premiums to compound above CPI over the hold.
Questions for the listing agent
- Is there a deadline driving the sale (1031 exchange, divorce, estate, relocation)? That informs how much negotiation room exists.
- Schools are F-rated, which usually means shorter tenancies and higher turnover. Who's the typical renter profile here, and what's been the actual vacancy rate?
- Crime grade is F in this area — have there been break-ins, vandalism, or insurance claims at this property in the last 3 years? What carrier currently insures it and at what premium?
- What's the average days-on-market for RENTAL listings here right now (not sales)? A rising rental-DOM trend means longer vacancies and softer asking-rent achievability than the comps imply.
- What's the recent tenant-quality profile in this submarket — average credit score on applications, eviction rate, late-payment / NSF rate, and stable-employment percentage? A property-management company in the area should have these aggregated.
- How much new for-sale + rental construction is in the pipeline within 1–3 miles? Heavy new supply typically softens prices + rents 12–24 months out; constrained supply supports both.
Investment metrics
- 1% rule
- 1.48% ✓
- Cap rate
- 12.54%
- Cash-on-cash
- 22.33%
- DSCR
- 1.99
- GRM
- 5.6
CMA / ARV
- ARV (on-the-fly)
- $181,248
- Comps found
- 12
Show comp detail 12 sales within ~0.75 mi
| Address | Dist | Beds/Ba | Sqft | Sold | Price | $/sf | Match |
|---|---|---|---|---|---|---|---|
| 14824 Goldcone Dr | 0.04mi | 2/2.0 (-1) | 1,440 (-6%) | 9mo | $215,000 | $149 | 75 |
| 6482 Rosewood Dr | 0.57mi | 3/2.0 | 1,640 (+7%) | 9mo | $210,000 | $128 | 55 |
| 14733 Memory | 0.66mi | 2/2.0 (-1) | 1,474 (-4%) | 4mo | $215,000 | $146 | 54 |
| 6595 Grandview Ave | 0.54mi | 2/2.0 (-1) | 1,440 (-6%) | 7mo | $170,000 | $118 | 53 |
| 6488 Placer Ct | 0.46mi | 2/2.0 (-1) | 1,368 (-11%) | 6mo | $115,000 | $84 | 50 |
| 14825 Del Oro | 0.52mi | 3/2.0 | 1,344 (-12%) | 6mo | $105,000 | $78 | 50 |
| 14830 Del Oro Dr | 0.51mi | 2/2.0 (-1) | 1,680 (+9%) | 9mo | $195,000 | $116 | 48 |
| 14807 Glenwood Dr | 0.38mi | 2/2.0 (-1) | 1,440 (-6%) | 23mo | $148,000 | $103 | 48 |
| 14721 Magnolia Dr | 0.31mi | 2/2.0 (-1) | 1,368 (-11%) | 19mo | $85,000 | $62 | 47 |
| 14862 Crescent Dr | 0.63mi | 2/2.0 (-1) | 1,440 (-6%) | 11mo | $180,000 | $125 | 46 |
| 14779 Denise Dr | 0.67mi | 3/2.5 | 1,638 (+7%) | 23mo | $159,900 | $98 | 37 |
| 14568 Holmwood Dr | 0.72mi | 2/2.0 (-1) | 1,344 (-12%) | 6mo | $175,000 | $130 | 36 |
Match score weights: distance 35% · size 25% · config 20% · recency 20%. Top-matched comps best support the ARV.
Projected returns pro-forma
-3.0% appreciation · 3.0% rent growth · sell at horizon
- IRR
- 15.1%
- Equity multiple
- 1.61×
- Total profit
- $16,805
- Equity at exit
- $14,761
- IRR
- 23.8%
- Equity multiple
- 3.05×
- Total profit
- $56,919
- Equity at exit
- $8,560
Cash invested: $27,720 (down + closing). Projections, not guarantees.
Landlord ↔ Tenant lean methodology
- Overall (STATE)
- 18 Strongly Tenant-Friendly
- State California
- 18 Strongly Tenant-Friendly · D+13
- County
- — inherits STATE
- City
- — inherits STATE
ZIP-level market 95954
- Home prices YoY
- -30.0%
- Active inventory
- 211
- Price-to-rent
- 5.6×
Monthly cashflow live
- Estimated rent
- $1,466 medium interval (Pro) →
- Mortgage (P&I)
- −$519
- Tax from tax record
- −$82 /mo · $988/yr
- Insurance
- −$41
- HOA
- −$0
- Vacancy / Maint / Mgmt
- −$308
- Net cashflow
- $516
Break-even live
Sensitivity live
| Price | -10% $572 | -5% $544 | +0% $516 | +5% $488 | +10% $460 |
|---|---|---|---|---|---|
| Rent | -10% $400 | -5% $458 | +0% $516 | +5% $574 | +10% $632 |
| Rate | -1.0pp $566 | -0.5pp $541 | base $516 | +0.5pp $490 | +1.0pp $464 |
UW: 25.0% down · 7.5% · 30yr · 1.5% tax · 5.0% vac · 8.0% maint · 8.0% mgmt
Financing live
Cash to close
- Down payment
- $24,750
- Closing costs
- $2,970
- Reserves months
- —
- Total cash needed
- —
Loan-product check · same deal, 3 products live
Conventional
25% down · 7.5% · 30yr
- Down + closing
- —
- Monthly P&I
- —
- Monthly cashflow
- —
- DSCR
- —
- Eligible?
- —
Personal DTI + credit; lowest rate.
DSCR
20% down · 8.5% · 30yr
- Down + closing
- —
- Monthly P&I
- —
- Monthly cashflow
- —
- DSCR
- —
- Eligible?
- —
No personal income docs; deal must DSCR.
Hard money
10% down · 12.0% · 12mo
- Down + closing
- —
- Monthly P&I
- —
- Monthly cashflow
- —
- DSCR
- —
- Eligible?
- —
Short-term bridge; refi at stabilization.
Rent comps 4 comps
| Address | Beds | Baths | Sqft | Rent | $/sqft | DOM | Units | Dist |
|---|---|---|---|---|---|---|---|---|
| 14745 Del Oro Dr Magalia, CA | 2.0 | 1.0 | 1300 | $1,525 | $1.17 | 14d | 1 | 0.66mi |
| 14745 Del Oro Dr Magalia, CA | 3.0 | 1.0 | 1300 | $1,525 | $1.17 | 22d | 1 | 0.66mi |
| 14767 Masterson Way Magalia, CA | 3.0 | 2.0 | 1440 | $1,400 | $0.97 | 14d | 1 | 0.97mi |
| 14435 Skyway Magalia, CA | 2.0 | 2.0 | 1200 | $1,325 | $1.10 | 14d | 1 | 1.28mi |
Listing history 8 events
-
2026-06-05days on market $99,000 Active 6 DOM
-
2026-06-03days on market $99,000 Active 5 DOM
-
2026-06-02days on market $99,000 Active 4 DOM
-
2026-06-01days on market $99,000 Active 3 DOM
-
2026-05-31remarks 613-char remark
-
2026-05-31days on market $99,000 Active 2 DOM
-
2026-05-30remarks 590-char remark
-
2026-05-30$99,000 Active 1 DOM
ⓘ Source: listings_history table (triggers on properties + properties_extension) + one-shot
backfill from property_details.listing_events for pre-trigger history.
Tax reassessment forecast CA · Resets to sale price
- Current annual tax
- $988 · $82/mo
- Projected year-2 tax
- $988 · $82/mo
- Expected delta
- $0/yr ($0/mo · 0.0%)
ⓘ Screening estimate from a state-policy table — verify with the county assessor before closing.
Climate risk First Street
- Flood 1/10 Low FEMA zone X (unshaded) · 0% chance over 30 yrs
- Wildfire 7/10 Severe
- Heat 4/10 Moderate 7 d/yr ≥96°F today · 17 d/yr by 30 yrs out
- Wind 1/10 Low
- Air quality 10/10 Extreme 37 unhealthy d/yr today · 42 by 30 yrs out
Nearby sold comps map
Loading sold comps map…
Walkable amenities ~0.75 mi
Loading nearby amenities…
Taxation est. · year 1
- Rental income
- $17,598
- − Mortgage interest
- −$5,546
- − Property taxes
- −$988
- − Insurance
- −$495
- − Repairs & maintenance
- −$1,408
- − Management
- −$1,408
- − Depreciation
- −$2,880
- Taxable income
- $4,874
- Est. tax owed @ 24.0%
- −$1,170
- After-tax cash flow
- $5,020/yr
For passive investors: Depreciation is non-cash, so a rental often shows a tax loss while cash-flowing — sheltering income. Rental losses are passive: they offset passive income freely, and up to $25,000/yr can offset ordinary (W-2) income if you actively participate and your MAGI is under $100k (phasing out to $0 by $150k); unused losses carry forward. On sale, claimed depreciation is recaptured at up to 25%, and gains may owe capital-gains tax (a 1031 exchange can defer both). Figures are a year-1 estimate at your 24.0% rate — not tax advice; consult a CPA.
Schools (NCES district)
No district data.
Livability — Magalia
- Score
- 51/100
- State rank
- #1094
- US rank
- #25434
Category grades
Schools grade is shown separately in the Schools card above.
Census & demographics
- Census place
- Magalia, CA
- Population (ZIP)
- 8,488
Population outlook (Butte County) Hauer SSP2
- Today (2025)
- 237,527 people
- By 2030
- 243,804 · +2.6%
- By 2040
- 253,899 · +6.9%
- By 2050
- 262,561 · +10.5%
- By 2075
- 283,709 · +19.4%
- By 2100
- 282,689 · +19.0%
Race, ethnicity, and origin ACS 2023
- Neighborhood character
- Predominantly White (78%)
- Race & ethnicity
- White 78% Two or more races 12% Hispanic / Latino 10% Asian 2%
- Hispanic origin (detail)
- Mexican 7%
- Common ancestry
- Portuguese 4% Russian 3% Lithuanian 2%
- Foreign-born
- 4% · Canada, Vietnam, South Korea
- Languages at home
- 94% English-only · Spanish 3% Other Indo-European 1% Vietnamese 1%
Political lean MEDSL · Butte
- 2024 margin
- Toss-up / Even · D 46.8% · R 49.9% · Other 3.3%
- 2008→2024 swing
- -5.5pp toward R · 2008: 2.4pp · 2024: -3.1pp
- All cycles
- 2024: R+3.1 2020: D+1.7 2016: R+4.0 2012: R+3.9 2008: D+2.4
Not yet ingested
- Civics
- —
Market trends
- HPI YoY
- ▼ -83.49%
- Current HPI
- 194.8809
- Rent YoY
- —
- Metro
- —
- State GDP YoY
- ▲ 3.21%
- F500 in state
- 116
Industry mix (Fortune 500 HQ in CA)
| Industry | F500 HQs | Revenue |
|---|---|---|
| Technology | 27 | $1,492B |
|
||
| Financial Services | 3 | $174B |
|
||
| Retail | 3 | $44B |
|
||
| Insurance | 3 | $26B |
|
||
| Media / Entertainment | 2 | $115B |
|
||
| Pharmaceuticals / Biotech | 2 | $62B |
|
||
Price history
+23.8% since first listed11 events — show timeline
- 2026-05-29 Listed $99,000 CRMLS
- 2026-05-29 Coming Soon $99,000 CRMLS
- 2014-03-21 Sold (Public Records) $75,000 Public Records
- 2014-03-21 Sold (MLS) $75,000 CRMLS
- 2014-02-15 Pending — CRMLS
- 2014-01-30 Listed $81,200 CRMLS
- 2011-08-19 Listing Removed — CRMLS
- 2011-08-10 Listed $77,000 CRMLS
- 2007-07-31 Listing Removed — CRMLS
- 2006-10-23 Listed $177,500 CRMLS
- 2004-12-22 Sold (Public Records) $80,000 Public Records
Property tax history
+0.5%/yrLatest (2025): $988 · +1.6% YoY. Source: county tax records.
Cash-flow waterfall
monthlySold comps — $/sqft
last 12 mo · ≤1 miLoading sold comps…