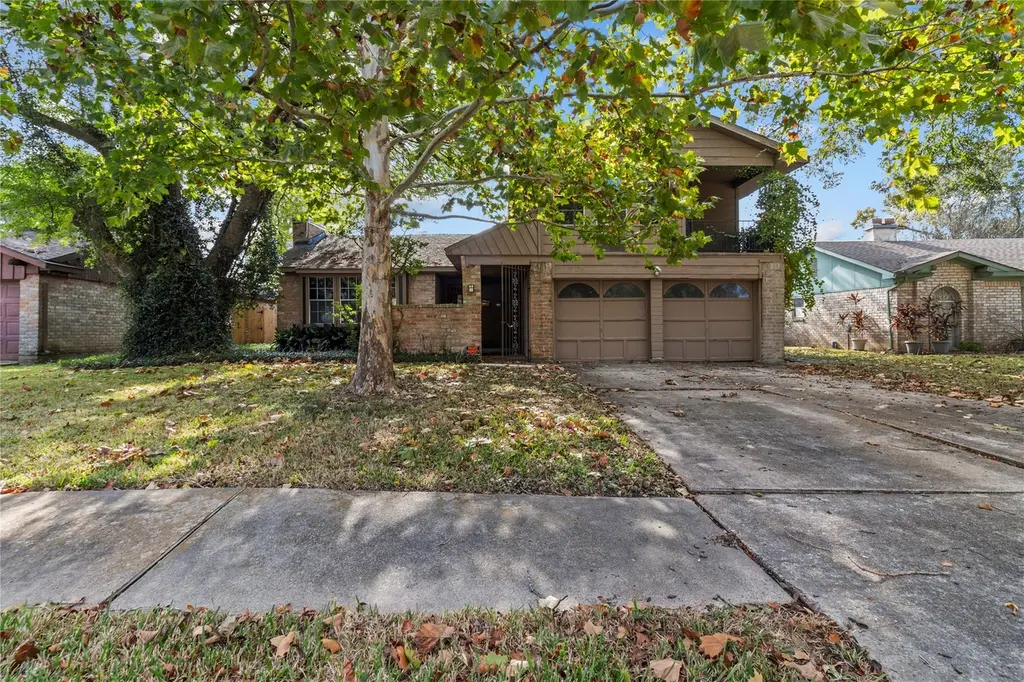
10702 Sagewillow Ln · Houston, TX
Flood risk 4/10 · Minor
- FEMA flood zone
- X (shaded)
- Chance of flooding over 30 yrs
- 0.23%
- Est. flood insurance / yr
- $507 – $1,088
Fire risk 1/10 · Minimal
- Est. fire insurance / yr
- $1,222 – $2,270
Heat risk 10/10 · Severe
- Hot days now (above 108°F)
- 7 days/yr
- Hot days in 30 yrs
- 24 days/yr
Wind risk 9/10 · Severe
- Chance of severe wind over 30 yrs
- 99.0%
Air-quality risk 2/10 · Minimal
- Unhealthy air days now
- 1 days/yr
- Unhealthy air days in 30 yrs
- 2 days/yr
Risk factors via First Street. Map © Google.
Why this score? — see what drove the C- grade
The composite is a weighted blend of 9 inputs, each scored 0–100. Each bar is that input's sub-score; the figure is the points it added to the 100-point composite (weight × sub-score).
- Cash flow +15.7/30.0
- ARV discount +15.0/15.0
- 1% rule +6.5/10.0
- DSCR +4.8/10.0
- Livability +3.7/5.0
- Rent growth +3.4/5.0
- Schools +2.6/10.0
- Condition / age +2.5/5.0
- Appreciation +0.0/10.0
$169,900
🖨 Deal sheet (PDF) 📄 Offer letter ✓ Due diligence
Listing remarks
This is a great opportunity to build sweat equity! Located off Hwy 8 this location lends itself to easy access to downtown or Galveston!This English tudor looking home has a large living space with vaulted ceilings and wood burning fireplace, formal dining AND an eat in kitchen. The upstairs bedrooms are generously portioned! Don't wait! Make your offer today!
Key facts
- 7,148 sq ft lot
- 2 garage spots
- Built 1974
Property features AI
Finance
- HOA & community: Community managed by Crest Management; Annual association fee of $190
Exterior
- Parking: Attached garage with 2 spaces
- Utilities: Public water; Public sewer
- Home design: Residential property; Full ownership; Slab foundation
- Construction: Built in 1974; Brick and wood siding exterior; Composition roof
- Exterior features: Cleared lot in a subdivision
Interior
- Kitchen: Dishwasher; Disposal
- Bedrooms: Primary bedroom on first floor (13 x 15); Bedroom on second floor (12 x 11); Bedroom on second floor (11 x 11); Total of 3 rooms
- Bathrooms: 2 full bathrooms
- Heating & cooling: Central heating (electric); Central air conditioning (gas)
- Interior features: Wood-burning fireplace (1); Hollywood bath
- Laundry & utility: Washer hookup; Electric dryer hookup; Gas dryer hookup
Neighborhood map
What this means for you Summary
Snapshot
- This is a 3-bed/2.0-bath single-family listed at $170k.
Deal economics
- At list price, monthly cash flow is $75 ($897/yr) — positive.
- The deal already cash-flows at list — no discount required.
- Meets the 1% rule at list price ($2k rent vs $170k).
- Recommended offer: $165k (3.0% below list) — sets the bar for market timing.
- Cap rate 6.8% vs local median 3.1% in Houston — top-decile yield for the area; either an underpriced asset or a hidden risk that comps aren't pricing in. Stress-test before assuming the spread holds.
Location & tenants
- Location reads 74/100 on livability (#184 in TX, #4,771 nationally) — a middle-class / working-renter tenant base. Strengths: amenities A+, cost of living A+, housing A+; Watch: crime F.
- Pasadena ISD (suburban): math 29% / reading 32% proficiency, ranked #612 of 826 in TX (top 74%) — families likely to look elsewhere, expect single-tenant / working-renter base with shorter leases; 71% free/reduced lunch — lower-income household profile, screen leases tightly.
- Zoned schools: Morris Middle (math 32% / reading 33%, grade F, #947 of 1,662 statewide, top 58%, 703 students, 86% FRL); The Summit (High School) (reading 24%, 148 students, 89% FRL) — zoned schools average 88% FRL vs 71% district-wide (16 pts higher); higher-poverty schools than district average — tighter screening recommended.
- Market conditions: Rents rising (+3.5%/yr); 185 active listings in the ZIP; 13 comparable units currently listed for rent nearby; rentals at typical pace (median 23d on market — plan ~3-4 weeks tenant-placement turnaround); solid renter incomes; 29,883 units permitted in Harris County in 2024 (8,621 in 5+ unit buildings).
Forward outlook
- Local home prices are declining (-3.0%/yr); year-one equity from $1k of loan paydown is wiped out by about $5k of value loss. Plan a longer hold.
- Harris County population projected at +47% by 2050 — long-run rental-demand tailwind backs the buy-and-hold thesis.
Negotiation context
- It's been on market 34 days — a 3% lower offer ($165k) is reasonable based on typical stale-listing flexibility.
- 3 sale attempts with the ask held roughly flat each time — persistent listings suggest the price (not the market) is what's stuck; bring a comps-based counter.
Risks & watch-outs
- Watch-outs: property tax is 3.4% of price.
- Climate carrying-cost: severe wind risk, 99% chance of damaging wind over 30y; extreme-heat days projected 7→24/yr by 2055 (HVAC capex compounding) — expect insurance premiums to compound above CPI over the hold.
Questions for the listing agent
- It's been on market 34 days. Have you received any prior offers? Is the seller open to a 3% concession, seller financing, or rate buy-down credit?
- Built in 1974 — when were the roof, HVAC, electrical panel, plumbing, and water heater last replaced?
- Property tax is high relative to price — has the assessment been appealed recently, and will the sale trigger a re-assessment?
- What does the HOA fee cover, when was the last increase, and are there any pending special assessments or reserve-fund shortfalls?
- Is there a deadline driving the sale (1031 exchange, divorce, estate, relocation)? That informs how much negotiation room exists.
- Schools are D-rated, which usually means shorter tenancies and higher turnover. Who's the typical renter profile here, and what's been the actual vacancy rate?
- Crime grade is F in this area — have there been break-ins, vandalism, or insurance claims at this property in the last 3 years? What carrier currently insures it and at what premium?
- What's the average days-on-market for RENTAL listings here right now (not sales)? A rising rental-DOM trend means longer vacancies and softer asking-rent achievability than the comps imply.
- What's the recent tenant-quality profile in this submarket — average credit score on applications, eviction rate, late-payment / NSF rate, and stable-employment percentage? A property-management company in the area should have these aggregated.
- How much new for-sale + rental construction is in the pipeline within 1–3 miles? Heavy new supply typically softens prices + rents 12–24 months out; constrained supply supports both.
Investment metrics
- 1% rule
- 1.15% ✓
- Cap rate
- 6.82%
- Cash-on-cash
- 1.89%
- DSCR
- 1.08
- GRM
- 7.3
CMA / ARV
- ARV (median comp)
- $255,788
- List price
- $169,900
- Delta
- -33.58%
- Verdict
- UNDERPRICED
- Comps
- 20 within 1.0 mi
Show comp detail 12 sales within ~0.75 mi
| Address | Dist | Beds/Ba | Sqft | Sold | Price | $/sf | Match |
|---|---|---|---|---|---|---|---|
| 10610 Sagepark Ln | 0.13mi | 3/2.0 | 2,011 (-0%) | 1mo | $239,500 | $119 | 93 |
| 10622 Sagevale Ln | 0.12mi | 3/2.0 | 1,972 (-2%) | 2mo | $250,500 | $127 | 89 |
| 10514 Sagewillow Ln | 0.18mi | 4/2.0 (+1) | 2,031 (+1%) | 2mo | $274,900 | $135 | 84 |
| 10523 Sageburrow Dr | 0.24mi | 3/2.0 | 2,121 (+5%) | 1mo | $310,999 | $147 | 80 |
| 10835 Sageburrow Dr | 0.31mi | 4/2.0 (+1) | 2,054 (+2%) | 3mo | $264,900 | $129 | 75 |
| 10523 Sagevale Ln | 0.18mi | 4/3.0 (+1) | 2,100 (+4%) | 1mo | $275,000 | $131 | 75 |
| 10711 Sageberry Dr | 0.13mi | 4/2.5 (+1) | 1,860 (-8%) | 2mo | $290,000 | $156 | 72 |
| 10006 Kirkwren Ct | 0.60mi | 3/2.0 | 2,051 (+2%) | 3mo | $314,999 | $154 | 67 |
| 11026 Sageview Dr | 0.56mi | 3/2.0 | 1,906 (-6%) | 4mo | $179,900 | $94 | 61 |
| 10826 Sagecanyon Dr | 0.44mi | 3/2.0 | 1,801 (-11%) | 2mo | $269,000 | $149 | 60 |
| 11414 Newton St | 0.50mi | 3/2.0 | 1,742 (-14%) | 1mo | $245,000 | $141 | 53 |
| 10819 Sageriver Dr | 0.53mi | 3/2.5 | 1,780 (-12%) | 1mo | $239,000 | $134 | 53 |
Match score weights: distance 35% · size 25% · config 20% · recency 20%. Top-matched comps best support the ARV.
Projected returns pro-forma
-3.0% appreciation · 3.48% rent growth · sell at horizon
- IRR
- -12.5%
- Equity multiple
- 0.55×
- Total profit
- $-21,619
- Equity at exit
- $25,333
- IRR
- -2.4%
- Equity multiple
- 0.83×
- Total profit
- $-7,941
- Equity at exit
- $14,690
Cash invested: $47,572 (down + closing). Projections, not guarantees.
Landlord ↔ Tenant lean methodology
- Overall (STATE)
- 87 Strongly Landlord-Friendly
- State Texas
- 87 Strongly Landlord-Friendly · R+5
- County
- — inherits STATE
- City
- — inherits STATE
ZIP-level market 77089
- Rents YoY
- 3.5%
- Active inventory
- 185
- Price-to-rent
- 7.3×
Monthly cashflow live
- Estimated rent
- $1,947 high interval (Pro) →
- Mortgage (P&I)
- −$891
- Tax from tax record
- −$485 /mo · $5,825/yr
- Insurance
- −$71
- HOA
- −$16
- Vacancy / Maint / Mgmt
- −$409
- Net cashflow
- $75
Break-even live
Sensitivity live
| Price | -10% $171 | -5% $123 | +0% $75 | +5% $27 | +10% $-21 |
|---|---|---|---|---|---|
| Rent | -10% $-79 | -5% $-2 | +0% $75 | +5% $152 | +10% $229 |
| Rate | -1.0pp $160 | -0.5pp $118 | base $75 | +0.5pp $31 | +1.0pp $-14 |
UW: 25.0% down · 7.5% · 30yr · 1.5% tax · 5.0% vac · 8.0% maint · 8.0% mgmt
Financing live
Cash to close
- Down payment
- $42,475
- Closing costs
- $5,097
- Reserves months
- —
- Total cash needed
- —
Loan-product check · same deal, 3 products live
Conventional
25% down · 7.5% · 30yr
- Down + closing
- —
- Monthly P&I
- —
- Monthly cashflow
- —
- DSCR
- —
- Eligible?
- —
Personal DTI + credit; lowest rate.
DSCR
20% down · 8.5% · 30yr
- Down + closing
- —
- Monthly P&I
- —
- Monthly cashflow
- —
- DSCR
- —
- Eligible?
- —
No personal income docs; deal must DSCR.
Hard money
10% down · 12.0% · 12mo
- Down + closing
- —
- Monthly P&I
- —
- Monthly cashflow
- —
- DSCR
- —
- Eligible?
- —
Short-term bridge; refi at stabilization.
Rent comps 13 comps
| Address | Beds | Baths | Sqft | Rent | $/sqft | DOM | Units | Dist |
|---|---|---|---|---|---|---|---|---|
| 10819 Sagewind Dr Houston, TX | 4.0 | 2.0 | 1514 | $1,966 | $1.30 | 6d | 1 | 0.20mi |
| 10418 Sagemeadow Ln Houston, TX | 4.0 | 2.0 | 1429 | $1,950 | $1.36 | 44d | 1 | 0.31mi |
| 10606 Kirkwren Dr Houston, TX | 4.0 | 2.0 | 1618 | $8,750 | $5.41 | 22d | 1 | 0.52mi |
| 10606 Kirkwren Dr Unit 1029082P Houston, TX | 4.0 | 2.0 | 1614 | $15,665 | $9.71 | 24d | 1 | 0.52mi |
| 9122 Southbluff Blvd Houston, TX | 3.0 | 2.0 | 1900 | $2,000 | $1.05 | 44d | 1 | 0.54mi |
| 11203 Sagehill Dr Houston, TX | 3.0 | 2.0 | 1766 | $1,900 | $1.08 | 6d | 1 | 0.69mi |
| 11438 Brook Meadow Dr Houston, TX | 3.0 | 2.0 | 1450 | $1,895 | $1.31 | 22d | 1 | 1.10mi |
| 9815 Sagemoss Ln Houston, TX | 3.0 | 2.0 | 1938 | $2,400 | $1.24 | 22d | 1 | 1.11mi |
| 9402 Carmalee St Houston, TX | 3.0 | 2.0 | 1564 | $1,850 | $1.18 | 21d | 1 | 1.15mi |
| 11666 Gulf Pointe Dr Houston, TX | 1.0–3.0 | 1.0–2.0 | 1129 | $2,101 | $1.86 | 2d | 31 | 1.23mi |
| 11034 Slate River Ln Houston, TX | 3.0 | 2.0 | 1713 | $1,900 | $1.11 | 44d | 1 | 1.40mi |
| 9462 Fuqua St Houston, TX | 3.0 | 2.0 | 1409 | $1,750 | $1.24 | 44d | 1 | 1.42mi |
| 9610 Foredale St Houston, TX | 3.0 | 2.0 | 1836 | $1,625 | $0.89 | 3d | 1 | 1.42mi |
HOA detail
- Monthly dues
- $16 · $192/yr
Listing history 18 events
-
2026-06-15days on market $169,900 Pending 34 DOM
-
2026-06-13days on market $169,900 Pending 32 DOM
-
2026-06-10status $169,900 Pending 28 DOM
-
2026-06-09days on market $169,900 Active 28 DOM
-
2026-06-08days on market $169,900 Active 27 DOM
-
2026-06-07days on market $169,900 Active 26 DOM
-
2026-06-04days on market $169,900 Active 23 DOM
-
2026-06-03days on market $169,900 Active 22 DOM
-
2026-06-02days on market $169,900 Active 21 DOM
-
2026-06-01days on market $169,900 Active 20 DOM
-
2026-05-31days on market $169,900 Active 19 DOM
-
2026-05-12$169,900 Active 364-char remark
-
2026-04-30historical
-
2026-02-19price $179,900
-
2026-01-07$189,900 Active
-
2025-12-30historical
-
2025-11-14$199,900 Active
-
2000-01-22soldstatus
ⓘ Source: listings_history table (triggers on properties + properties_extension) + one-shot
backfill from property_details.listing_events for pre-trigger history.
Tax reassessment forecast TX · Resets to sale price
- Current annual tax
- $5,825 · $485/mo
- Projected year-2 tax
- $5,825 · $485/mo
- Expected delta
- $0/yr ($0/mo · 0.0%)
ⓘ Screening estimate from a state-policy table — verify with the county assessor before closing.
Climate risk First Street
- Flood 4/10 Moderate FEMA zone X (shaded) · 23% chance over 30 yrs
- Wildfire 1/10 Low
- Heat 10/10 Extreme 7 d/yr ≥108°F today · 24 d/yr by 30 yrs out
- Wind 9/10 Extreme 99% chance of damaging wind over 30 yrs
- Air quality 2/10 Low 1 unhealthy d/yr today · 2 by 30 yrs out
Nearby sold comps map
Loading sold comps map…
Walkable amenities ~0.75 mi
Loading nearby amenities…
Taxation est. · year 1
- Rental income
- $23,360
- − Mortgage interest
- −$9,517
- − Property taxes
- −$5,825
- − Insurance
- −$850
- − Repairs & maintenance
- −$1,869
- − Management
- −$1,869
- − HOA
- −$192
- − Depreciation
- −$4,943
- Taxable loss
- −$1,703
- Est. tax savings @ 24.0%
- +$409
- After-tax cash flow
- $1,306/yr
For passive investors: Depreciation is non-cash, so a rental often shows a tax loss while cash-flowing — sheltering income. Rental losses are passive: they offset passive income freely, and up to $25,000/yr can offset ordinary (W-2) income if you actively participate and your MAGI is under $100k (phasing out to $0 by $150k); unused losses carry forward. On sale, claimed depreciation is recaptured at up to 25%, and gains may owe capital-gains tax (a 1031 exchange can defer both). Figures are a year-1 estimate at your 24.0% rate — not tax advice; consult a CPA.
Schools (NCES district)
- District
- Pasadena ISD
- NCES district ID
- 4834320
- Math proficiency
- 29% ▼ -17.00%
- Reading proficiency
- 32% ▼ -9.00%
- Median HH income
- $45,163
- Composite
- 26.15/100
- National rank
- #7275
- State rank
- #612 of 826 in TX
Livability — Houston
- Score
- 74/100
- State rank
- #184
- US rank
- #4771
Category grades
Schools grade is shown separately in the Schools card above.
Census & demographics
- County
- Harris County · 4,702,590 people
- City population
- 3,226,434
- Metro
- Houston-The Woodlands-Sugar Land, TX
- Population (ZIP)
- 57,741
- Household income
- $88,140
- Rent vs Own
- Severe rent burden
- 1483.0
Population outlook (Harris County) Hauer SSP2
- Today (2025)
- 5,571,493 people
- By 2030
- 6,089,821 · +9.3%
- By 2040
- 7,142,806 · +28.2%
- By 2050
- 8,185,864 · +46.9%
- By 2075
- 10,574,329 · +89.8%
- By 2100
- 12,109,958 · +117.4%
Race, ethnicity, and origin ACS 2023
- Neighborhood character
- Highly diverse neighborhood (Simpson 0.71)
- Race & ethnicity
- Hispanic / Latino 45% Two or more races 22% White 19% Asian 17% Black 16%
- Hispanic origin (detail)
- Mexican 37%
- Common ancestry
- Lithuanian 2% Italian 2% Romanian 1%
- Foreign-born
- 23% · Canada, Vietnam, China
- Languages at home
- 53% English-only · Spanish 33% Vietnamese 7% Other Indo-European 1%
Political lean MEDSL · Harris
- 2024 margin
- Lean D (+5.5) · D 52.0% · R 46.4% · Other 1.6%
- 2008→2024 swing
- +3.9pp toward D · 2008: 1.6pp · 2024: 5.5pp
- All cycles
- 2024: D+5.5 2020: D+13.3 2016: D+12.4 2012: D+0.1 2008: D+1.6
Not yet ingested
- Civics
- —
Market trends
- HPI YoY
- ▼ -156.31%
- Current HPI
- 249.5438
- Rent YoY
- ▲ 3.48%
- Metro
- Houston-The Woodlands-Sugar Land, TX
- State GDP YoY
- ▲ 3.95%
- F500 in state
- 110
Industry mix (Fortune 500 HQ in TX)
| Industry | F500 HQs | Revenue |
|---|---|---|
| Energy | 16 | $1,198B |
|
||
| Technology | 5 | $198B |
|
||
| Engineering / Construction | 4 | $72B |
|
||
| Energy Services | 3 | $60B |
|
||
| Utilities | 3 | $41B |
|
||
| Healthcare | 2 | $330B |
|
||
Price history
-15.0% since first listed9 events — show timeline
- 2026-06-16 Pending — HARMLS
- 2026-06-09 Pending — HARMLS
- 2026-05-12 Listed $169,900 HARMLS
- 2026-04-30 Listing Removed — HARMLS
- 2026-02-19 Price Changed $179,900 HARMLS
- 2026-01-07 Listed $189,900 HARMLS
- 2025-12-30 Listing Removed — HARMLS
- 2025-11-14 Listed $199,900 HARMLS
- 2000-01-22 Sold (Public Records) — Public Records
Property tax history
+7.5%/yrLatest (2025): $5,825 · -2.9% YoY. Source: county tax records.
Cash-flow waterfall
monthlySold comps — $/sqft
last 12 mo · ≤1 miLoading sold comps…