8022 Timbertree Unit 5-2 · Beckett Ridge, OH
Flood risk 1/10 · Minimal
- FEMA flood zone
- X (unshaded)
- Chance of flooding over 30 yrs
- 0.0%
- Est. flood insurance / yr
- $507 – $1,088
Fire risk 1/10 · Minimal
- Est. fire insurance / yr
- $713 – $1,323
Heat risk 5/10 · Moderate
- Hot days now (above 104°F)
- 7 days/yr
- Hot days in 30 yrs
- 19 days/yr
Wind risk 2/10 · Minimal
- Chance of severe wind over 30 yrs
- 1.0%
Air-quality risk 3/10 · Minor
- Unhealthy air days now
- 2 days/yr
- Unhealthy air days in 30 yrs
- 3 days/yr
Risk factors via First Street. Map © Google.
Why this score? — see what drove the C- grade
The composite is a weighted blend of 9 inputs, each scored 0–100. Each bar is that input's sub-score; the figure is the points it added to the 100-point composite (weight × sub-score).
- Cash flow +17.8/30.0
- 1% rule +7.7/10.0
- ARV discount +7.5/15.0
- Schools +6.3/10.0
- DSCR +5.6/10.0
- Livability +3.5/5.0
- Rent growth +3.3/5.0
- Condition / age +2.5/5.0
- Appreciation +0.0/10.0
$179,900
🖨 Deal sheet 📄 Offer letter ✓ Due diligence
Listing remarks MLS
Looking for the space of a home but carefree lifestyle of ranch condo..this is your home! Lg win ensure gorgeous views overlooking golf course, 3 pvt patio/decks, neutral decor w/WBFP, ceramic flr in kit, updated BA's, oversized 2car gar!
Key facts
- Pool community
- Immediate occupancy
- 1 floor living
Tags
Property features AI
Finance
- Other: Residential zoning
- HOA & community: HOA present with monthly fee; Monthly association fee approximately $485.25; Association fee includes insurance, landscaping, and pool access
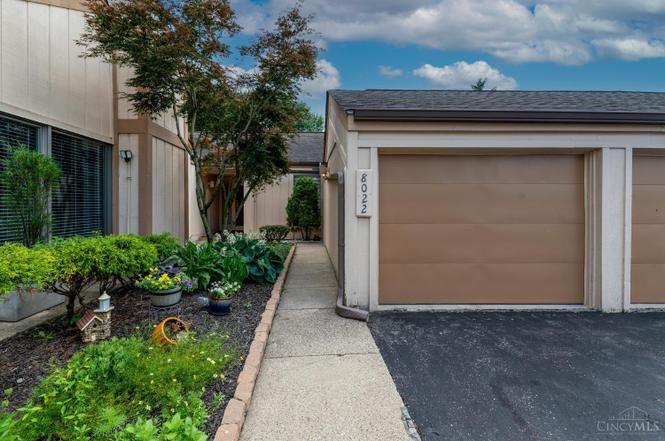
Exterior
- Parking: Detached garage with 2 garage spaces; One assigned parking space
- Utilities: Public water; Public sewer; Natural gas; Electric water heater; Cable available
- Home design: Townhouse (traditional style); Single-story unit with entry level on level 1; Unit entry level is 1
- Construction: Shingle roof; Wood siding; Poured foundation; Built on one level
- Exterior features: Deck; Patio; Wooded yard; Yard lights; Slider and insulated windows
Interior
- Kitchen: Counter bar; Eat-in kitchen; Wood cabinets; Vinyl flooring; Dishwasher; Garbage disposal; Oven/Range; Refrigerator
- Bedrooms: Three bedrooms total; Primary bedroom approximately 16 x 12 (on entry level); Second bedroom approximately 12 x 12 (on entry level); Third bedroom approximately 12 x 10 (on entry level)
- Flooring: Wall-to-wall carpet in living and dining areas; Vinyl in kitchen; Wood floor in entry/foyer
- Bathrooms: Two full bathrooms (both on entry level)
- Heating & cooling: Gas heating; Central air
- Interior features: Seven total rooms; Fireplace with wood burning; Ceiling fan; Smoke alarm; Walkout from living and dining areas; Window treatments
- Laundry & utility: 220 volt service (useful for large appliances)
Neighborhood map
What this means for you Summary
Snapshot
- This is a 3-bed/2.0-bath townhouse listed at $180k.
Deal economics
- At list price, monthly cash flow is $147 ($2k/yr) — positive.
- The deal already cash-flows at list — no discount required.
- Meets the 1% rule at list price ($2k rent vs $180k).
Location & tenants
- Location reads 70/100 on livability (#479 in OH) — a middle-class / working-renter tenant base. Strengths: schools A+, crime A+, employment A+; Watch: amenities D-, commute F, health & safety F.
- Lakota Local (suburban): math 68% / reading 72% proficiency, ranked #107 of 656 in OH (top 16%) — strong family-tenant draw, lease renewals of 3-5y typical; only 18% free/reduced lunch — higher-income household profile.
- Market conditions: Rents rising (+3.3%/yr); 120 active listings in the ZIP; 1 comparable units currently listed for rent nearby; high-income renter base; 1,163 units permitted in Butler County in 2024 (356 in 5+ unit buildings).
Forward outlook
- Local home prices are declining (-3.0%/yr); year-one equity from $1k of loan paydown is wiped out by about $5k of value loss. Plan a longer hold.
Negotiation context
- Only 1 days on market — expect competitive offers; lowballing is unlikely to land.
- 4 sale attempts since 25y ago with the ask held roughly flat each time — persistent listings suggest the price (not the market) is what's stuck; bring a comps-based counter.
- Current owner paid $106k; list at $180k implies a 70% gain — meaningful room to come down on a strong offer.
Risks & watch-outs
- Watch-outs: HOA is 21% of rent.
- Climate carrying-cost: extreme-heat days projected 7→19/yr by 2055 (HVAC capex compounding) — expect insurance premiums to compound above CPI over the hold.
Questions for the listing agent
- Built in 1977 — when were the roof, HVAC, electrical panel, plumbing, and water heater last replaced?
- What does the HOA fee cover, when was the last increase, and are there any pending special assessments or reserve-fund shortfalls?
- Is there a deadline driving the sale (1031 exchange, divorce, estate, relocation)? That informs how much negotiation room exists.
- Schools are A-rated — typically a magnet for longer-tenancy family renters. What's the average tenant stay here, and is there a school-zone premium baked into asking?
- What's the average days-on-market for RENTAL listings here right now (not sales)? A rising rental-DOM trend means longer vacancies and softer asking-rent achievability than the comps imply.
- What's the recent tenant-quality profile in this submarket — average credit score on applications, eviction rate, late-payment / NSF rate, and stable-employment percentage? A property-management company in the area should have these aggregated.
- How much new for-sale + rental construction is in the pipeline within 1–3 miles? Heavy new supply typically softens prices + rents 12–24 months out; constrained supply supports both.
Investment metrics
- 1% rule
- 1.27% ✓
- Cap rate
- 7.27%
- Cash-on-cash
- 3.50%
- DSCR
- 1.16
- GRM
- 6.6
CMA / ARV
No comps found within radius.
Projected returns pro-forma
-3.0% appreciation · 3.34% rent growth · sell at horizon
- IRR
- -10.1%
- Equity multiple
- 0.63×
- Total profit
- $-18,729
- Equity at exit
- $26,824
- IRR
- 0.0%
- Equity multiple
- 1.00×
- Total profit
- $131
- Equity at exit
- $15,554
Cash invested: $50,372 (down + closing). Projections, not guarantees.
Landlord ↔ Tenant lean methodology
- Overall (STATE)
- 73 Landlord-Friendly
- State Ohio
- 73 Landlord-Friendly · R+6
- County
- — inherits STATE
- City
- — inherits STATE
ZIP-level market 45069
- Rents YoY
- 3.3%
- Active inventory
- 120
- Price-to-rent
- 6.6×
Monthly cashflow live
- Estimated rent
- $2,278 medium interval (Pro) →
- Mortgage (P&I)
- −$943
- Tax from tax record
- −$150 /mo · $1,796/yr
- Insurance
- −$75
- HOA
- −$485
- Vacancy / Maint / Mgmt
- −$478
- Net cashflow
- $147
Break-even live
UW: 25.0% down · 7.5% · 30yr · 1.5% tax · 5.0% vac · 8.0% maint · 8.0% mgmt
Financing live
Cash to close
- Down payment
- $44,975
- Closing costs
- $5,397
- Reserves months
- —
- Total cash needed
- —
Loan-product check · same deal, 3 products live
Conventional
25% down · 7.5% · 30yr
- Down + closing
- —
- Monthly P&I
- —
- Monthly cashflow
- —
- DSCR
- —
- Eligible?
- —
Personal DTI + credit; lowest rate.
DSCR
20% down · 8.5% · 30yr
- Down + closing
- —
- Monthly P&I
- —
- Monthly cashflow
- —
- DSCR
- —
- Eligible?
- —
No personal income docs; deal must DSCR.
Hard money
10% down · 12.0% · 12mo
- Down + closing
- —
- Monthly P&I
- —
- Monthly cashflow
- —
- DSCR
- —
- Eligible?
- —
Short-term bridge; refi at stabilization.
Rent comps 1 comps
| Address | Beds | Baths | Sqft | Rent | $/sqft | DOM | Units | Dist |
|---|---|---|---|---|---|---|---|---|
| 4637 Wyndtree Dr West Chester, OH | 2.0–3.0 | 2.0 | 1026 | $2,100 | $2.05 | 1d | 21 | 1.06mi |
HOA detail
- Monthly dues
- $485 · $5,820/yr
Listing history 2 events
-
2026-06-16remarks 285-char remark
-
2026-06-16$179,900 Active 1 DOM
ⓘ Source: listings_history table (triggers on properties + properties_extension) + one-shot
backfill from property_details.listing_events for pre-trigger history.
Tax reassessment forecast OH · Partial reset (capped growth)
- Current annual tax
- $1,796 · $150/mo
- Projected year-2 tax
- $2,301 · $192/mo
- Expected delta
- +$505/yr (+$42/mo · 28.1%)
ⓘ Screening estimate from a state-policy table — verify with the county assessor before closing.
Climate risk First Street
- Flood 1/10 Low FEMA zone X (unshaded) · 0% chance over 30 yrs
- Wildfire 1/10 Low
- Heat 5/10 Major 7 d/yr ≥104°F today · 19 d/yr by 30 yrs out
- Wind 2/10 Low 100% chance of damaging wind over 30 yrs
- Air quality 3/10 Moderate 2 unhealthy d/yr today · 3 by 30 yrs out
Nearby sold comps map
Loading sold comps map…
Walkable amenities ~0.75 mi
Loading nearby amenities…
Taxation est. · year 1
- Rental income
- $27,341
- − Mortgage interest
- −$10,077
- − Property taxes
- −$1,796
- − Insurance
- −$900
- − Repairs & maintenance
- −$2,187
- − Management
- −$2,187
- − HOA
- −$5,820
- − Depreciation
- −$5,233
- Taxable loss
- −$860
- Est. tax savings @ 24.0%
- +$206
- After-tax cash flow
- $1,969/yr
For passive investors: Depreciation is non-cash, so a rental often shows a tax loss while cash-flowing — sheltering income. Rental losses are passive: they offset passive income freely, and up to $25,000/yr can offset ordinary (W-2) income if you actively participate and your MAGI is under $100k (phasing out to $0 by $150k); unused losses carry forward. On sale, claimed depreciation is recaptured at up to 25%, and gains may owe capital-gains tax (a 1031 exchange can defer both). Figures are a year-1 estimate at your 24.0% rate — not tax advice; consult a CPA.
Schools (NCES district)
- District
- Lakota Local
- NCES district ID
- 3904611
- Math proficiency
- 68% ▼ -10.00%
- Reading proficiency
- 72% ▼ -5.00%
- Median HH income
- $90,743
- Composite
- 63.25/100
- National rank
- #631
- State rank
- #107 of 656 in OH
Livability — Beckett Ridge
- Score
- 70/100
- State rank
- #479
- US rank
- #7982
Category grades
Schools grade is shown separately in the Schools card above.
Census & demographics
- Census place
- Beckett Ridge, OH
- County
- Butler County · 381,674 people
- Metro
- Cincinnati, OH-KY-IN
- Population (ZIP)
- 56,037
- Household income
- $114,631
- Rent vs Own
- Severe rent burden
- 1120.0
Population outlook (Butler County) Hauer SSP2
- Today (2025)
- 387,706 people
- By 2030
- 392,028 · +1.1%
- By 2040
- 395,307 · +2.0%
- By 2050
- 391,116 · +0.9%
- By 2075
- 378,642 · -2.3%
- By 2100
- 343,248 · -11.5%
Race, ethnicity, and origin ACS 2023
- Neighborhood character
- Predominantly White (74%)
- Race & ethnicity
- White 74% Asian 9% Black 9% Two or more races 5% Hispanic / Latino 5%
- Common ancestry
- Romanian 3% Slovak 2% Lithuanian 2%
- Foreign-born
- 12% · Canada, China, India
- Languages at home
- 87% English-only · Other Indo-European 3% Spanish 2% Chinese 2%
Political lean MEDSL · Butler
- 2024 margin
- Strong R (+26.3) · D 36.4% · R 62.7%
- 2008→2024 swing
- -3.6pp toward R · 2008: -22.6pp · 2024: -26.3pp
- All cycles
- 2024: R+26.3 2020: R+24.0 2016: R+28.3 2012: R+26.2 2008: R+22.6
Not yet ingested
- Civics
- —
Market trends
- HPI YoY
- ▼ -192.32%
- Current HPI
- 249.8429
- Rent YoY
- ▲ 3.34%
- Metro
- Cincinnati, OH-KY-IN
- State GDP YoY
- ▲ 1.98%
- F500 in state
- 48
Industry mix (Fortune 500 HQ in OH)
| Industry | F500 HQs | Revenue |
|---|---|---|
| Insurance | 3 | $145B |
|
||
| Industrial Machinery | 3 | $49B |
|
||
| Financial Services | 3 | $24B |
|
||
| Consumer Goods | 2 | $93B |
|
||
| Aerospace / Defense | 2 | $47B |
|
||
| Utilities | 2 | $33B |
|
||
Price history
+87.4% since first listed13 events — show timeline
- 2026-06-15 Listed $179,900 Cincy MLS
- 2012-03-28 Sold (Public Records) $106,000 Public Records
- 2012-03-22 Sold (MLS) $106,000 Cincy MLS
- 2012-01-16 Listed $120,000 Cincy MLS
- 2005-06-13 Sold (Public Records) $148,900 Public Records
- 2005-05-10 Sold (MLS) $148,900 Cincy MLS
- 2005-02-10 Listed $154,900 Cincy MLS
- 2001-10-31 Sold (Public Records) $137,500 Public Records
- 2001-10-15 Sold (MLS) $137,500 Cincy MLS
- 2001-08-20 Listed $139,900 Cincy MLS
- 1992-10-27 Sold (Public Records) $101,000 Public Records
- 1988-06-01 Sold (Public Records) $90,000 Public Records
- 1986-05-01 Sold (Public Records) $96,000 Public Records
Property tax history
-0.8%/yrLatest (2025): $1,796 · -18.3% YoY. Source: county tax records.
Cash-flow waterfall
monthlySold comps — $/sqft
last 12 mo · ≤1 miLoading sold comps…