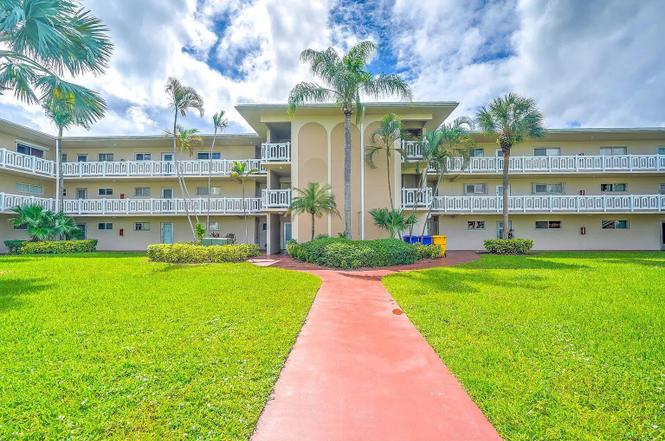
2606 Garden Dr #304 · Palm Springs, FL
Flood risk 1/10 · Minimal
- FEMA flood zone
- X (unshaded)
- Chance of flooding over 30 yrs
- 0.0%
- Est. flood insurance / yr
- $507 – $1,088
Fire risk 1/10 · Minimal
- Est. fire insurance / yr
- $947 – $1,759
Heat risk 10/10 · Severe
- Hot days now (above 105°F)
- 7 days/yr
- Hot days in 30 yrs
- 26 days/yr
Wind risk 10/10 · Severe
- Chance of severe wind over 30 yrs
- 99.0%
Air-quality risk 2/10 · Minimal
- Unhealthy air days now
- 0 days/yr
- Unhealthy air days in 30 yrs
- 2 days/yr
Risk factors via First Street. Map © Google.
Why this score? — see what drove the D grade
The composite is a weighted blend of 9 inputs, each scored 0–100. Each bar is that input's sub-score; the figure is the points it added to the 100-point composite (weight × sub-score).
- 1% rule +10.0/10.0
- Cash flow +9.5/30.0
- ARV discount +7.5/15.0
- Schools +4.3/10.0
- Livability +3.7/5.0
- DSCR +2.7/10.0
- Condition / age +2.5/5.0
- Rent growth +1.9/5.0
- Appreciation +0.0/10.0
$129,900
🖨 Deal sheet (PDF) 📄 Offer letter ✓ Due diligence
Key facts
- $787 HOA
- Parking
- Community pool
Property features AI
Finance
- Other: Senior community
- HOA & community: Association on site; Monthly HOA fee; Building amenities: elevator(s), fitness center, game room, laundry, parking, pool, manager on site, courtesy bus, putting green; HOA covers cable TV, grounds maintenance, sewer, trash, water, and elevator
Exterior
- Parking: Assigned parking space; One open parking space
- Utilities: Public sewer; Water available; Sewer available
- Home design: Condominium; Multi/split levels; Faces southeast; Resale
- Construction: Block/Concrete/CBS construction; 3 total stories; Living area recorded as 1,080 (public records)
- Exterior features: Waterfront; Screen-enclosed pool
Interior
- Bedrooms: 2 bedrooms on the main level
- Flooring: Vinyl flooring
- Bathrooms: 2 full bathrooms on the main level
- Heating & cooling: Central electric heating; Central air conditioning; Ceiling fans
- Interior features: Walk-in closets; Unfurnished; Blinds and drapes
- Laundry & utility: Laundry available (building)
Neighborhood map
What this means for you Summary
Snapshot
- This is a 2-bed/2.0-bath condo listed at $130k.
Deal economics
- At list price, monthly cash flow is $-90 ($-1k/yr) — negative.
- To cash-flow at today's rent, offer at most $114k (12.2% below list).
- Meets the 1% rule at list price ($2k rent vs $130k).
- Recommended offer: $114k (12.2% below list) — sets the bar for cash-flow.
Location & tenants
- Location reads 73/100 on livability (#297 in FL) — a middle-class / working-renter tenant base. Strengths: cost of living A+, housing A+, health & safety A; Watch: employment D+, amenities F, commute F.
- Palm Beach (suburban): math 46% / reading 53% proficiency, ranked #34 of 73 in FL (top 47%) — families likely to look elsewhere, expect single-tenant / working-renter base with shorter leases.
- Zoned schools: Meadow Park Elementary School (math 64% / reading 73%, grade B+, #409 of 2,144 statewide, top 20%, 809 students, 65% FRL); Conniston Middle School (math 35% / reading 38%, grade F, #405 of 571 statewide, top 72%, 1,075 students, 74% FRL); Forest Hill Community High School (math 20% / reading 41%, grade F, #434 of 667 statewide, top 66%, 2,407 students, 66% FRL) — zoned schools average 68% FRL vs 52% district-wide (16 pts higher); higher-poverty schools than district average — tighter screening recommended.
- Market conditions: Rents soft (-2.5%/yr); 276 active listings in the ZIP; 40 comparable units currently listed for rent nearby; rentals at typical pace (median 24d on market — plan ~3-4 weeks tenant-placement turnaround); 3,974 units permitted in Palm Beach County in 2024 (1,012 in 5+ unit buildings).
- This rent runs 38% of the median local income ($62k/yr) — at the standard rent-burdened threshold; future hikes will face affordability resistance.
Forward outlook
- Local home prices are declining (-3.0%/yr); year-one equity from $898 of loan paydown is wiped out by about $4k of value loss. Plan a longer hold.
- Palm Beach County population projected at +30% by 2050 — long-run rental-demand tailwind backs the buy-and-hold thesis.
Negotiation context
- It's been on market 170 days — a 12% lower offer ($114k) is reasonable based on typical stale-listing flexibility.
- 10 sale attempts since 4y ago; this cycle's ask is 7564% above the opening price — seller raised mid-cycle; expect resistance to lowballs.
- Current owner paid $110k; 18% above their basis — modest negotiation headroom, anchor on the comps not their cost.
Risks & watch-outs
- Watch-outs: HOA is 40% of rent.
- Climate carrying-cost: severe wind risk, 99% chance of damaging wind over 30y; extreme-heat days projected 7→26/yr by 2055 (HVAC capex compounding) — expect insurance premiums to compound above CPI over the hold.
Questions for the listing agent
- What do current leases actually rent for vs. the listed asking? Can we see a recent rent roll and the last 12 months of T-12 income?
- It's been on market 170 days. Have you received any prior offers? Is the seller open to a 12% concession, seller financing, or rate buy-down credit?
- Built in 1969 — when were the roof, HVAC, electrical panel, plumbing, and water heater last replaced?
- What does the HOA fee cover, when was the last increase, and are there any pending special assessments or reserve-fund shortfalls?
- Any open or pending special assessments — roof, HVAC, plumbing, elevator, façade? What's the per-unit balance and payoff schedule, and is the seller paying it off at close or rolling it to the buyer?
- Why hasn't it sold? Are there any deal-killer items the seller is aware of (foundation, flood, title, zoning, code violations)?
- Is there a deadline driving the sale (1031 exchange, divorce, estate, relocation)? That informs how much negotiation room exists.
- Schools are D-rated, which usually means shorter tenancies and higher turnover. Who's the typical renter profile here, and what's been the actual vacancy rate?
- The area grade is low — what's the realistic commute time and amenity access for the typical tenant pool here? Any planned neighborhood developments (good or bad) we should know about?
- What's the average days-on-market for RENTAL listings here right now (not sales)? A rising rental-DOM trend means longer vacancies and softer asking-rent achievability than the comps imply.
- What's the recent tenant-quality profile in this submarket — average credit score on applications, eviction rate, late-payment / NSF rate, and stable-employment percentage? A property-management company in the area should have these aggregated.
- How much new apartment / multifamily construction is in the pipeline within 1–3 miles? Heavy new supply (>2% of stock underway) typically softens rents 12–24 months out; light construction supports rent growth.
Investment metrics
- 1% rule
- 1.53% ✓
- Cap rate
- 5.47%
- Cash-on-cash
- -2.96%
- DSCR
- 0.87
- GRM
- 5.5
CMA / ARV
No comps found within radius.
Projected returns pro-forma
-3.0% appreciation · 0.0% rent growth · sell at horizon
- IRR
- -27.5%
- Equity multiple
- 0.12×
- Total profit
- $-32,068
- Equity at exit
- $19,369
- IRR
- -69.9%
- Equity multiple
- -0.53×
- Total profit
- $-55,710
- Equity at exit
- $11,231
Cash invested: $36,372 (down + closing). Projections, not guarantees.
Landlord ↔ Tenant lean methodology
- Overall (STATE)
- 87 Strongly Landlord-Friendly
- State Florida
- 87 Strongly Landlord-Friendly · R+3
- County
- — inherits STATE
- City
- — inherits STATE
ZIP-level market 33461
- Rents YoY
- -2.5%
- Active inventory
- 276
- Price-to-rent
- 5.5×
Monthly cashflow live
- Estimated rent
- $1,983 high interval (Pro) →
- Mortgage (P&I)
- −$681
- Tax from tax record
- −$133 /mo · $1,602/yr
- Insurance
- −$54
- HOA
- −$787
- Vacancy / Maint / Mgmt
- −$416
- Net cashflow
- $-90
Break-even live
Sensitivity live
| Price | -10% $-16 | -5% $-53 | +0% $-90 | +5% $-126 | +10% $-163 |
|---|---|---|---|---|---|
| Rent | -10% $-246 | -5% $-168 | +0% $-90 | +5% $-11 | +10% $67 |
| Rate | -1.0pp $-24 | -0.5pp $-57 | base $-90 | +0.5pp $-123 | +1.0pp $-157 |
UW: 25.0% down · 7.5% · 30yr · 1.5% tax · 5.0% vac · 8.0% maint · 8.0% mgmt
Financing live
Cash to close
- Down payment
- $32,475
- Closing costs
- $3,897
- Reserves months
- —
- Total cash needed
- —
Loan-product check · same deal, 3 products live
Conventional
25% down · 7.5% · 30yr
- Down + closing
- —
- Monthly P&I
- —
- Monthly cashflow
- —
- DSCR
- —
- Eligible?
- —
Personal DTI + credit; lowest rate.
DSCR
20% down · 8.5% · 30yr
- Down + closing
- —
- Monthly P&I
- —
- Monthly cashflow
- —
- DSCR
- —
- Eligible?
- —
No personal income docs; deal must DSCR.
Hard money
10% down · 12.0% · 12mo
- Down + closing
- —
- Monthly P&I
- —
- Monthly cashflow
- —
- DSCR
- —
- Eligible?
- —
Short-term bridge; refi at stabilization.
Rent comps 40 comps
| Address | Beds | Baths | Sqft | Rent | $/sqft | DOM | Units | Dist |
|---|---|---|---|---|---|---|---|---|
| 2566 Garden Dr S Lake Worth Beach, FL | 1.0 | 1.0 | 744 | $1,395 | $1.88 | 26d | 1 | 0.05mi |
| 2724 Garden Dr S #207 Lake Worth, FL | 1.0 | 1.0 | 744 | $1,850 | $2.49 | 0d | 1 | 0.14mi |
| 2668 Garden Dr N #312 Lake Worth, FL | 2.0 | 2.0 | 1080 | $1,500 | $1.39 | 6d | 1 | 0.18mi |
| 2668 Garden Dr N #312 Lake Worth, FL | 2.0 | 2.0 | 1080 | $1,500 | $1.39 | 3d | 1 | 0.18mi |
| 2791 S Florida Mango Rd Lake Worth, FL | 2.0 | 2.0 | 1100 | $1,995 | $1.81 | 22d | 1 | 0.22mi |
| 2581 Garden Dr N #203 Lake Worth, FL | 2.0 | 2.0 | 894 | $1,650 | $1.85 | 16d | 1 | 0.22mi |
| 2581 Garden Dr N #203 Lake Worth, FL | 2.0 | 2.0 | 894 | $1,650 | $1.85 | 9d | 1 | 0.22mi |
| 2428 Waterside Dr Unit 2428 Lake Worth Beach, FL | 2.0 | 2.5 | 1400 | $2,250 | $1.61 | 26d | 1 | 0.25mi |
| 2856 Garden Dr S #112 Lake Worth, FL | 2.0 | 1.0 | 894 | $1,800 | $2.01 | 26d | 1 | 0.26mi |
| 2721 Garden Dr N #105 Lake Worth, FL | 2.0 | 1.0 | 894 | $1,800 | $2.01 | 22d | 1 | 0.26mi |
| 2391 Waterside Dr Unit 22d Lake Worth, FL | 2.0 | 3.0 | 1328 | $2,600 | $1.96 | 26d | 1 | 0.28mi |
| 230 Lake Arbor Dr Palm Springs, FL | 2.0 | 2.0 | 1232 | $2,200 | $1.79 | 26d | 1 | 0.29mi |
| 2508 10th Ave N Lake Worth Beach, FL | 3.0 | 2.0 | 1025 | $2,557 | $2.49 | 26d | 1 | 0.30mi |
| 2508 10th Ave N Lake Worth Beach, FL | 2.0 | 1.0 | 800 | $1,746 | $2.18 | 15d | 1 | 0.30mi |
| 2508 10th Ave N Lake Worth Beach, FL | 2.0 | 1.0 | 800 | $1,672 | $2.09 | 12d | 1 | 0.30mi |
| 910 Rudolf Rd Lake Worth, FL | 3.0 | 1.0 | 1000 | $2,500 | $2.50 | 26d | 1 | 0.33mi |
| 2901 10th Ave N Palm Springs, FL | 2.0 | 1.0 | 900 | $1,795 | $1.99 | 26d | 1 | 0.38mi |
| 3386 Rudolph Rd Lake Worth Beach, FL | 2.0 | 1.0 | 840 | $2,100 | $2.50 | 4d | 1 | 0.40mi |
| 331 Lake Arbor Dr Palm Springs, FL | 2.0 | 2.0 | 1232 | $2,300 | $1.87 | 26d | 1 | 0.42mi |
| 21 Lake Arbor Dr Palm Springs, FL | 2.0 | 2.5 | 1232 | $2,500 | $2.03 | 20d | 1 | 0.46mi |
| 3440 Rudolph Rd Unit 3440-03 Lake Worth Beach, FL | 2.0 | 2.0 | 935 | $2,100 | $2.25 | 20d | 1 | 0.48mi |
| 3431 Helena Dr Unit 3481-11 Lake Worth Beach, FL | 2.0 | 2.0 | 935 | $2,050 | $2.19 | 26d | 1 | 0.48mi |
| 3431 Helena Dr Lake Worth, FL | 2.0 | 2.0 | 935 | $2,075 | $2.22 | 15d | 2 | 0.48mi |
| 3481 Helena Dr Unit 11 Lake Worth Beach, FL | 2.0 | 2.0 | 935 | $2,050 | $2.19 | 26d | 1 | 0.50mi |
| 3300 Boutwell Rd Lake Worth Beach, FL | 1.0–2.0 | 1.0–2.0 | 765 | $2,720 | $3.56 | 26d | 1 | 0.51mi |
| 100 Rex Ave Palm Springs, FL | 2.0 | 2.0 | 1000 | $1,850 | $1.85 | 26d | 3 | 0.52mi |
| 3031 French Ave Lake Worth, FL | 3.0 | 1.0 | 840 | $2,400 | $2.86 | 9d | 1 | 0.59mi |
| 220 Henthorne Dr Palm Springs, FL | 1.0–2.0 | 1.5–2.0 | 900 | $1,850 | $2.06 | 26d | 4 | 0.61mi |
| 3017 Buckley Ave Lake Worth, FL | 2.0 | 1.0 | 720 | $2,200 | $3.06 | 26d | 1 | 0.63mi |
| 124 Abaco Dr Palm Springs, FL | 3.0 | 2.0 | 988 | $2,900 | $2.94 | 17d | 1 | 0.65mi |
| 1065 Manor Dr Palm Springs, FL | 2.0 | 2.0 | 1098 | $2,100 | $1.91 | 4d | 1 | 0.68mi |
| 965 Manor Dr Palm Springs, FL | 2.0 | 1.0 | 687 | $1,995 | $2.90 | 3d | 5 | 0.70mi |
| 1020 Manor Dr Palm Springs, FL | 2.0 | 2.0 | 1098 | $2,200 | $2.00 | 24d | 1 | 0.74mi |
| 1016 Manor Dr Unit 5c Palm Springs, FL | 2.0 | 2.0 | 1098 | $2,256 | $2.05 | 26d | 1 | 0.75mi |
| 1742 W Terrace Dr Lake Worth Beach, FL | 2.0 | 1.5 | 1000 | $2,700 | $2.70 | 26d | 1 | 0.81mi |
| 1802 Waterview Cir #1802 Palm Springs, FL | 2.0 | 2.0 | 951 | $1,925 | $2.02 | 26d | 1 | 0.90mi |
| 2571 Lake Worth Rd Lake Worth, FL | 1.0–2.0 | 1.0–2.0 | 750 | $1,657 | $2.21 | 3d | 2 | 0.95mi |
| 6003 Waterview Cir Palm Springs, FL | 3.0 | 2.5 | 1500 | $2,550 | $1.70 | 26d | 1 | 0.99mi |
| 1719 15th Ave N Lake Worth Beach, FL | 3.0 | 2.0 | 1014 | $3,150 | $3.11 | 1d | 1 | 1.03mi |
| 2220 Lake Worth Rd Lake Worth, FL | 1.0 | 1.0 | 700 | $1,779 | $2.54 | 24d | 1 | 1.04mi |
HOA detail condo
- Monthly dues
- $787 · $9,444/yr
- Assessments
- None detected in remarks — confirm with the listing agent.
Listing history 46 events
-
2026-06-21days on market $129,900 Active 170 DOM
-
2026-06-18days on market $129,900 Active 167 DOM
-
2026-06-17days on market $129,900 Active 166 DOM
-
2026-06-16days on market $129,900 Active 165 DOM
-
2026-06-15days on market $129,900 Active 164 DOM
-
2026-06-13days on market $129,900 Active 162 DOM
-
2026-06-09days on market $129,900 Active 158 DOM
-
2026-06-07days on market $129,900 Active 156 DOM
-
2026-06-04days on market $129,900 Active 153 DOM
-
2026-06-03days on market $129,900 Active 152 DOM
-
2026-06-01days on market $129,900 Active 150 DOM
-
2026-05-31days on market $129,900 Active 149 DOM
-
2026-05-01historical $1,695
-
2026-03-14price $129,900
-
2026-01-04$1,695
-
2026-01-02$139,900 Active
-
2025-12-20historical $1,795
-
2025-12-20price $1,795
-
2025-12-05price $1,995
-
2025-12-04$2,295
-
2025-01-01historical
-
2024-08-10price $149,900
-
2024-07-01historical
-
2024-06-21status Active
-
2024-06-01historical
-
2024-01-03$179,900 Active
-
2023-12-31historical
-
2023-11-22$179,000 Active
-
2023-10-16$179,900 Active
-
2023-10-01historical
-
2023-07-11price $189,900
-
2023-05-17$209,900 Active
-
2023-03-31soldstatus $110,000
-
2023-03-24soldstatus $110,000 Closed
-
2023-01-16price $120,000
-
2023-01-16historical Active Under Contract
-
2023-01-14price $119,000
-
2023-01-14status Active
-
2022-12-31historical
-
2022-12-20price $125,000
-
2022-10-31price $135,000
-
2022-10-17$139,000 Active
-
2003-01-15soldstatus $50,000
-
2000-05-02soldstatus $37,000
-
1993-03-11soldstatus $35,000
-
1981-03-01soldstatus $60,000
ⓘ Source: listings_history table (triggers on properties + properties_extension) + one-shot
backfill from property_details.listing_events for pre-trigger history.
Tax reassessment forecast FL · Resets to sale price
- Current annual tax
- $1,602 · $133/mo
- Projected year-2 tax
- $1,602 · $133/mo
- Expected delta
- $0/yr ($0/mo · 0.0%)
ⓘ Screening estimate from a state-policy table — verify with the county assessor before closing.
Climate risk First Street
- Flood 1/10 Low FEMA zone X (unshaded) · 0% chance over 30 yrs
- Wildfire 1/10 Low
- Heat 10/10 Extreme 7 d/yr ≥105°F today · 26 d/yr by 30 yrs out
- Wind 10/10 Extreme 99% chance of damaging wind over 30 yrs
- Air quality 2/10 Low 0 unhealthy d/yr today · 2 by 30 yrs out
Nearby sold comps map
Loading sold comps map…
Walkable amenities ~0.75 mi
Loading nearby amenities…
Taxation est. · year 1
- Rental income
- $23,791
- − Mortgage interest
- −$7,276
- − Property taxes
- −$1,602
- − Insurance
- −$650
- − Repairs & maintenance
- −$1,903
- − Management
- −$1,903
- − HOA
- −$9,444
- − Depreciation
- −$3,779
- Taxable loss
- −$2,766
- Est. tax savings @ 24.0%
- +$664
- After-tax cash flow
- $-411/yr
For passive investors: Depreciation is non-cash, so a rental often shows a tax loss while cash-flowing — sheltering income. Rental losses are passive: they offset passive income freely, and up to $25,000/yr can offset ordinary (W-2) income if you actively participate and your MAGI is under $100k (phasing out to $0 by $150k); unused losses carry forward. On sale, claimed depreciation is recaptured at up to 25%, and gains may owe capital-gains tax (a 1031 exchange can defer both). Figures are a year-1 estimate at your 24.0% rate — not tax advice; consult a CPA.
Schools (NCES district)
- District
- Palm Beach
- NCES district ID
- 1201500
- Math proficiency
- 46% ▼ -16.00%
- Reading proficiency
- 53% ▼ -4.00%
- Median HH income
- $53,943
- Composite
- 42.72/100
- National rank
- #3160
- State rank
- #34 of 73 in FL
Livability — Palm Springs
- Score
- 73/100
- State rank
- #297
- US rank
- #5045
Category grades
Schools grade is shown separately in the Schools card above.
Census & demographics
- County
- Palm Beach County · 1,438,312 people
- City population
- 49,443
- Metro
- Miami-Fort Lauderdale-Pompano Beach, FL
- Population (ZIP)
- 49,443
- Household income
- $61,963
- Rent vs Own
- Severe rent burden
- 2663.0
Population outlook (Palm Beach County) Hauer SSP2
- Today (2025)
- 1,637,487 people
- By 2030
- 1,743,255 · +6.5%
- By 2040
- 1,948,712 · +19.0%
- By 2050
- 2,132,979 · +30.3%
- By 2075
- 2,530,027 · +54.5%
- By 2100
- 2,706,979 · +65.3%
Race, ethnicity, and origin ACS 2023
- Neighborhood character
- Diverse neighborhood (Simpson 0.59)
- Race & ethnicity
- Hispanic / Latino 59% Two or more races 26% White 20% Black 17% Asian 2%
- Hispanic origin (detail)
- Mexican 11% Puerto Rican 6% Cuban 16% Dominican 2%
- Common ancestry
- Hispanic 9% Romanian 1% Lithuanian 1%
- Foreign-born
- 52% · Canada, Jamaica
- Languages at home
- 31% English-only · Spanish 54% French/Haitian/Cajun 10% Other Indo-European 2%
Political lean MEDSL · Palm Beach
- 2024 margin
- Toss-up / Even · D 50.0% · R 49.2%
- 2008→2024 swing
- -22.1pp toward R · 2008: 22.9pp · 2024: 0.8pp
- All cycles
- 2024: D+0.8 2020: D+12.8 2016: D+15.3 2012: D+17.0 2008: D+22.9
Not yet ingested
- Civics
- —
Market trends
- HPI YoY
- ▼ -269.03%
- Current HPI
- 493.0041
- Rent YoY
- ▼ -2.47%
- Metro
- Miami-Fort Lauderdale-Pompano Beach, FL
- State GDP YoY
- ▲ 3.28%
- F500 in state
- 36
Industry mix (Fortune 500 HQ in FL)
| Industry | F500 HQs | Revenue |
|---|---|---|
| Industrial Technology | 2 | $29B |
|
||
| Insurance | 2 | $17B |
|
||
| Retail | 1 | $60B |
|
||
| Technology Distribution | 1 | $58B |
|
||
| Homebuilding | 1 | $35B |
|
||
| Technology Manufacturing | 1 | $35B |
|
||
Price history
-97.2% since first listed34 events — show timeline
- 2026-05-01 Rental Removed $1,695 GFLMLS
- 2026-03-14 Price Changed $129,900 Beaches MLS
- 2026-01-04 Listed for Rent $1,695 GFLMLS
- 2026-01-02 Listed $139,900 Beaches MLS
- 2025-12-20 Rental Removed $1,795 GFLMLS
- 2025-12-20 Price Changed $1,795 GFLMLS
- 2025-12-05 Price Changed $1,995 GFLMLS
- 2025-12-04 Listed for Rent $2,295 GFLMLS
- 2025-01-01 Listing Removed — Beaches MLS
- 2024-08-10 Price Changed $149,900 Beaches MLS
- 2024-07-01 Listing Removed — MARMLS
- 2024-06-21 Relisted — Beaches MLS
- 2024-06-01 Listing Removed — Beaches MLS
- 2024-01-03 Listed $179,900 Beaches MLS
- 2023-12-31 Listing Removed — Beaches MLS
- 2023-11-22 Listed $179,000 MARMLS
- 2023-10-16 Listed $179,900 Beaches MLS
- 2023-10-01 Listing Removed — Beaches MLS
- 2023-07-11 Price Changed $189,900 Beaches MLS
- 2023-05-17 Listed $209,900 Beaches MLS
- 2023-03-31 Sold (Public Records) $110,000 Public Records
- 2023-03-24 Sold (MLS) $110,000 Beaches MLS
- 2023-01-16 Price Changed $120,000 Beaches MLS
- 2023-01-16 Contingent — Beaches MLS
- 2023-01-14 Price Changed $119,000 Beaches MLS
- 2023-01-14 Relisted — Beaches MLS
- 2022-12-31 Listing Removed — Beaches MLS
- 2022-12-20 Price Changed $125,000 Beaches MLS
- 2022-10-31 Price Changed $135,000 Beaches MLS
- 2022-10-17 Listed $139,000 Beaches MLS
- 2003-01-15 Sold (Public Records) $50,000 Public Records
- 2000-05-02 Sold (Public Records) $37,000 Public Records
- 1993-03-11 Sold (Public Records) $35,000 Public Records
- 1981-03-01 Sold (Public Records) $60,000 Public Records
Property tax history
+11.3%/yrLatest (2025): $1,602 · -12.8% YoY. Source: county tax records.
Cash-flow waterfall
monthlySold comps — $/sqft
last 12 mo · ≤1 miLoading sold comps…