523 S Preston St · Cortland, IL
Flood risk 1/10 · Minimal
- FEMA flood zone
- X (unshaded)
- Chance of flooding over 30 yrs
- 0.0%
- Est. flood insurance / yr
- $507 – $1,088
Fire risk 1/10 · Minimal
- Est. fire insurance / yr
- $804 – $1,492
Heat risk 2/10 · Minimal
- Hot days now (above 100°F)
- 7 days/yr
- Hot days in 30 yrs
- 15 days/yr
Wind risk 2/10 · Minimal
- Chance of severe wind over 30 yrs
- 1.0%
Air-quality risk 3/10 · Minor
- Unhealthy air days now
- 1 days/yr
- Unhealthy air days in 30 yrs
- 3 days/yr
Risk factors via First Street. Map © Google.
Why this score? — see what drove the D grade
The composite is a weighted blend of 9 inputs, each scored 0–100. Each bar is that input's sub-score; the figure is the points it added to the 100-point composite (weight × sub-score).
- Cash flow +12.6/30.0
- ARV discount +8.2/15.0
- 1% rule +3.8/10.0
- Livability +3.8/5.0
- DSCR +3.7/10.0
- Rent growth +2.5/5.0
- Condition / age +2.5/5.0
- Appreciation +2.2/10.0
- Schools +1.2/10.0
$239,900
🖨 Deal sheet (PDF) 📄 Offer letter ✓ Due diligence
Listing remarks MLS
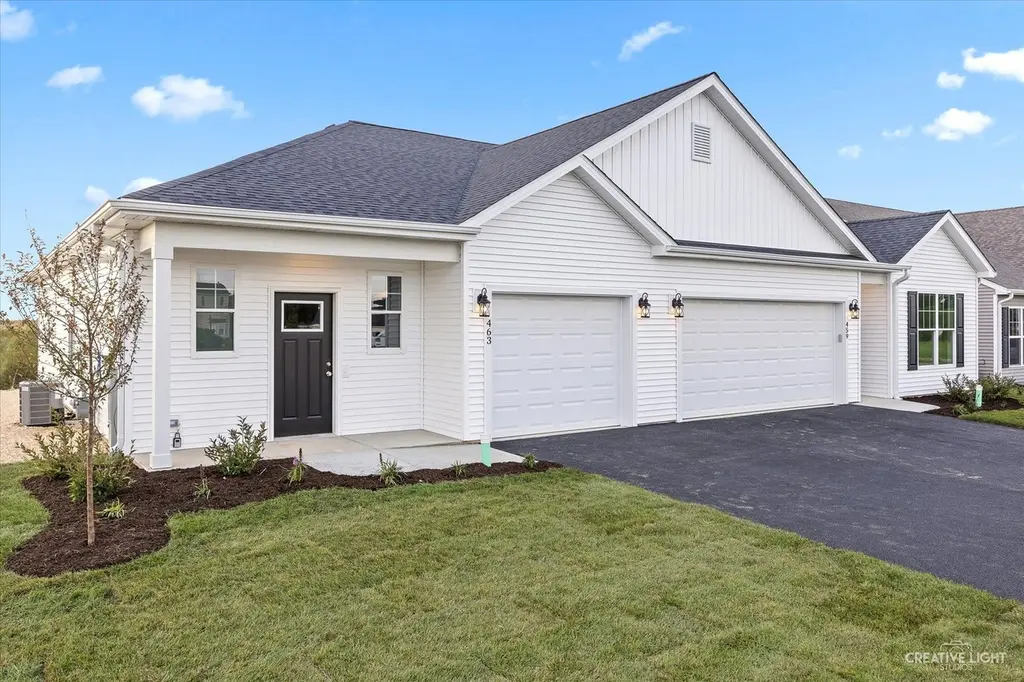
AMAZING, UNDER CONSTRUCTION 1/2 DUPLEX!! Another spectacular new construction project in the desirable Chestnut Grove subdivision! 2 BR, 1 BATH 1/2 duplex features a fantastic open floor plan! Ranch-style living with everything you need on one level! The kitchen features an expanded island with bar stool seating, granite countertops, white or gray cabinetry, aged bronze or nickel fixtures, and stainless steel appliances! Elementary school is located in the subdivision, so kids can walk to school! Minutes from I-88 for commuters or weekend fun! One-car garage! Pull down attic stairs for additional storage! Don't forget to check out the 3D tour of this amazing home! Home to be completed early SEPTEMBER 2026! There is still time to choose the interior finishes. Pictures are from a previous model. Lot dimensions are estimated, and the final plat of the survey will be delivered at closing.
Key facts
- Open floor plan
- Granite countertops
- Expanded island
Tags
Neighborhood map
What this means for you Summary
Snapshot
- This is a 2-bed/1.5-bath other listed at $240k.
Deal economics
- At list price, monthly cash flow is $-33 ($-393/yr) — negative.
- To cash-flow at today's rent, offer at most $235k (2.0% below list).
- To meet the 1% rule (rent ≥ 1% of price), the offer needs to be $211k (12.0% below list).
- Recommended offer: $211k (12.0% below list) — sets the bar for 1% rule.
- Cap rate 6.1% vs local median 3.6% in Cortland — top-decile yield for the area; either an underpriced asset or a hidden risk that comps aren't pricing in. Stress-test before assuming the spread holds.
Location & tenants
- Location reads 76/100 on livability (#184 in IL, #3,520 nationally) — a middle-class / working-renter tenant base. Strengths: crime A+, cost of living A+, housing A+; Watch: amenities F, commute F.
- Dekalb CUSD 428 (suburban): math 11% / reading 16% proficiency, ranked #541 of 620 in IL (top 87%) — low school quality limits family demand, transient renter base, plan for 1-2y turnover.
- Zoned schools: Cortland Elementary School (math 8% / reading 8%, grade F, #1,627 of 2,056 statewide, top 81%, 519 students, 0% FRL); Huntley Middle School (math 12% / reading 16%, grade F, #529 of 665 statewide, top 80%, 934 students, 0% FRL); Dekalb High School (math 18% / reading 28%, grade F, #312 of 693 statewide, top 46%, 2,083 students, 0% FRL) — zoned schools average 0% FRL vs 48% district-wide (48 pts lower); this property's tenant base skews higher-income than the district average.
- Market conditions: 53 active listings in the ZIP; 2 comparable units currently listed for rent nearby; 260 units permitted in DeKalb County in 2024 (73 in 5+ unit buildings).
Forward outlook
- Local home prices are declining (-3.0%/yr); year-one equity from $2k of loan paydown is wiped out by about $7k of value loss. Plan a longer hold.
- DeKalb County population projected to shrink 5% by 2050 — rents likely to lag national; underwrite the cash flow, not the appreciation.
Negotiation context
- It's been on market 88 days — a 6% lower offer ($226k) is reasonable based on typical stale-listing flexibility.
Questions for the listing agent
- What do current leases actually rent for vs. the listed asking? Can we see a recent rent roll and the last 12 months of T-12 income?
- It's been on market 88 days. Have you received any prior offers? Is the seller open to a 12% concession, seller financing, or rate buy-down credit?
- What does the HOA fee cover, when was the last increase, and are there any pending special assessments or reserve-fund shortfalls?
- Why hasn't it sold? Are there any deal-killer items the seller is aware of (foundation, flood, title, zoning, code violations)?
- Is there a deadline driving the sale (1031 exchange, divorce, estate, relocation)? That informs how much negotiation room exists.
- Schools are F-rated, which usually means shorter tenancies and higher turnover. Who's the typical renter profile here, and what's been the actual vacancy rate?
- The area grade is low — what's the realistic commute time and amenity access for the typical tenant pool here? Any planned neighborhood developments (good or bad) we should know about?
- What's the average days-on-market for RENTAL listings here right now (not sales)? A rising rental-DOM trend means longer vacancies and softer asking-rent achievability than the comps imply.
- What's the recent tenant-quality profile in this submarket — average credit score on applications, eviction rate, late-payment / NSF rate, and stable-employment percentage? A property-management company in the area should have these aggregated.
- How much new for-sale + rental construction is in the pipeline within 1–3 miles? Heavy new supply typically softens prices + rents 12–24 months out; constrained supply supports both.
Investment metrics
- 1% rule
- 0.88% ✗
- Cap rate
- 6.13%
- Cash-on-cash
- -0.58%
- DSCR
- 0.97
- GRM
- 9.5
CMA / ARV
- ARV (median comp)
- $243,668
- List price
- $239,900
- Delta
- -1.55%
- Verdict
- FAIR
- Comps
- 20 within 1.0 mi
Projected returns pro-forma
-3.0% appreciation · 3.0% rent growth · sell at horizon
- IRR
- -17.2%
- Equity multiple
- 0.39×
- Total profit
- $-40,900
- Equity at exit
- $35,770
- IRR
- -9.2%
- Equity multiple
- 0.43×
- Total profit
- $-38,064
- Equity at exit
- $20,742
Cash invested: $67,172 (down + closing). Projections, not guarantees.
Landlord ↔ Tenant lean methodology
- Overall (STATE)
- 43 Moderately Tenant-Leaning
- State Illinois
- 43 Moderately Tenant-Leaning · D+7
- County
- — inherits STATE
- City
- — inherits STATE
ZIP-level market 60112
- Home prices YoY
- -2.2%
- Active inventory
- 53
- Price-to-rent
- 9.5×
Monthly cashflow live
- Estimated rent
- $2,110 medium interval (Pro) →
- Mortgage (P&I)
- −$1,258
- Tax est. 1.5%
- −$300 /mo · $3,598/yr
- Insurance
- −$100
- HOA
- −$42
- Vacancy / Maint / Mgmt
- −$443
- Net cashflow
- $-33
Break-even live
Sensitivity live
| Price | -10% $133 | -5% $50 | +0% $-33 | +5% $-116 | +10% $-199 |
|---|---|---|---|---|---|
| Rent | -10% $-199 | -5% $-116 | +0% $-33 | +5% $51 | +10% $134 |
| Rate | -1.0pp $88 | -0.5pp $28 | base $-33 | +0.5pp $-95 | +1.0pp $-158 |
UW: 25.0% down · 7.5% · 30yr · 1.5% tax · 5.0% vac · 8.0% maint · 8.0% mgmt
Financing live
Cash to close
- Down payment
- $59,975
- Closing costs
- $7,197
- Reserves months
- —
- Total cash needed
- —
Loan-product check · same deal, 3 products live
Conventional
25% down · 7.5% · 30yr
- Down + closing
- —
- Monthly P&I
- —
- Monthly cashflow
- —
- DSCR
- —
- Eligible?
- —
Personal DTI + credit; lowest rate.
DSCR
20% down · 8.5% · 30yr
- Down + closing
- —
- Monthly P&I
- —
- Monthly cashflow
- —
- DSCR
- —
- Eligible?
- —
No personal income docs; deal must DSCR.
Hard money
10% down · 12.0% · 12mo
- Down + closing
- —
- Monthly P&I
- —
- Monthly cashflow
- —
- DSCR
- —
- Eligible?
- —
Short-term bridge; refi at stabilization.
Rent comps 2 comps
| Address | Beds | Baths | Sqft | Rent | $/sqft | DOM | Units | Dist |
|---|---|---|---|---|---|---|---|---|
| 344 E Stratford Ave Unit Na Cortland, IL | 2.0 | 1.0 | 1120 | $2,100 | $1.88 | 45d | 1 | 0.17mi |
| 104 N Spruce St Cortland, IL | 3.0 | 1.0 | 1092 | $2,200 | $2.01 | 18d | 1 | 1.42mi |
HOA detail
- Monthly dues
- $42 · $504/yr
Listing history 16 events
-
2026-06-21days on market $239,900 Active 88 DOM
-
2026-06-18days on market $239,900 Active 85 DOM
-
2026-06-17days on market $239,900 Active 84 DOM
-
2026-06-16days on market $239,900 Active 83 DOM
-
2026-06-15days on market $239,900 Active 82 DOM
-
2026-06-13days on market $239,900 Active 80 DOM
-
2026-06-13days on market $239,900 Active 79 DOM
-
2026-06-09days on market $239,900 Active 76 DOM
-
2026-06-08days on market $239,900 Active 75 DOM
-
2026-06-07days on market $239,900 Active 74 DOM
-
2026-06-04days on market $239,900 Active 71 DOM
-
2026-06-03days on market $239,900 Active 70 DOM
-
2026-06-02days on market $239,900 Active 69 DOM
-
2026-06-01days on market $239,900 Active 68 DOM
-
2026-05-31days on market $239,900 Active 67 DOM
-
2026-03-25$239,900 Active 897-char remark
Show marketing remark (897 chars)
AMAZING, UNDER CONSTRUCTION 1/2 DUPLEX!! Another spectacular new construction project in the desirable Chestnut Grove subdivision! 2 BR, 1 BATH 1/2 duplex features a fantastic open floor plan! Ranch-style living with everything you need on one level! The kitchen features an expanded island with bar stool seating, granite countertops, white or gray cabinetry, aged bronze or nickel fixtures, and stainless steel appliances! Elementary school is located in the subdivision, so kids can walk to school! Minutes from I-88 for commuters or weekend fun! One-car garage! Pull down attic stairs for additional storage! Don't forget to check out the 3D tour of this amazing home! Home to be completed early SEPTEMBER 2026! There is still time to choose the interior finishes. Pictures are from a previous model. Lot dimensions are estimated, and the final plat of the survey will be delivered at closing.
ⓘ Source: listings_history table (triggers on properties + properties_extension) + one-shot
backfill from property_details.listing_events for pre-trigger history.
Climate risk First Street
- Flood 1/10 Low FEMA zone X (unshaded) · 0% chance over 30 yrs
- Wildfire 1/10 Low
- Heat 2/10 Low 7 d/yr ≥100°F today · 15 d/yr by 30 yrs out
- Wind 2/10 Low 100% chance of damaging wind over 30 yrs
- Air quality 3/10 Moderate 1 unhealthy d/yr today · 3 by 30 yrs out
Nearby sold comps map
Loading sold comps map…
Walkable amenities ~0.75 mi
Loading nearby amenities…
Taxation est. · year 1
- Rental income
- $25,324
- − Mortgage interest
- −$13,438
- − Property taxes
- −$3,598
- − Insurance
- −$1,200
- − Repairs & maintenance
- −$2,026
- − Management
- −$2,026
- − HOA
- −$504
- − Depreciation
- −$6,979
- Taxable loss
- −$4,447
- Est. tax savings @ 24.0%
- +$1,067
- After-tax cash flow
- $675/yr
For passive investors: Depreciation is non-cash, so a rental often shows a tax loss while cash-flowing — sheltering income. Rental losses are passive: they offset passive income freely, and up to $25,000/yr can offset ordinary (W-2) income if you actively participate and your MAGI is under $100k (phasing out to $0 by $150k); unused losses carry forward. On sale, claimed depreciation is recaptured at up to 25%, and gains may owe capital-gains tax (a 1031 exchange can defer both). Figures are a year-1 estimate at your 24.0% rate — not tax advice; consult a CPA.
Schools (NCES district)
- District
- Dekalb CUSD 428
- NCES district ID
- 1712000
- Math proficiency
- 11% ▼ -9.00%
- Reading proficiency
- 16% ▼ -6.00%
- Median HH income
- $42,007
- Composite
- 11.74/100
- National rank
- #9685
- State rank
- #541 of 620 in IL
Livability — Cortland
- Score
- 76/100
- State rank
- #184
- US rank
- #3520
Category grades
Schools grade is shown separately in the Schools card above.
Census & demographics
- Census place
- Cortland, IL
- City population
- 4,611
- Population (ZIP)
- 4,611
Population outlook (DeKalb County) Hauer SSP2
- Today (2025)
- 104,983 people
- By 2030
- 104,428 · -0.5%
- By 2040
- 102,199 · -2.7%
- By 2050
- 99,303 · -5.4%
- By 2075
- 93,978 · -10.5%
- By 2100
- 88,527 · -15.7%
Race, ethnicity, and origin ACS 2023
- Neighborhood character
- Predominantly White (72%)
- Race & ethnicity
- White 72% Hispanic / Latino 17% Two or more races 10% Black 9%
- Hispanic origin (detail)
- Mexican 12% Puerto Rican 2%
- Common ancestry
- Romanian 10% Iranian 4% Portuguese 3%
- Foreign-born
- 2% · Canada, Jamaica
- Languages at home
- 92% English-only · Spanish 8%
Political lean MEDSL · DeKalb
- 2024 margin
- Toss-up / Even · D 50.1% · R 48.1% · Other 1.7%
- 2008→2024 swing
- -14.8pp toward R · 2008: 16.8pp · 2024: 2.0pp
- All cycles
- 2024: D+2.0 2020: D+5.7 2016: D+3.0 2012: D+5.5 2008: D+16.8
Not yet ingested
- Civics
- —
Market trends
- HPI YoY
- ▼ -5.55%
- Current HPI
- 250.0297
- Rent YoY
- —
- Metro
- —
- State GDP YoY
- ▲ 1.59%
- F500 in state
- 60
Industry mix (Fortune 500 HQ in IL)
| Industry | F500 HQs | Revenue |
|---|---|---|
| Insurance | 4 | $201B |
|
||
| Consumer Goods | 4 | $87B |
|
||
| Industrial Machinery | 3 | $64B |
|
||
| Healthcare | 2 | $55B |
|
||
| Retail / Pharmacy | 1 | $148B |
|
||
| Agriculture / Food | 1 | $86B |
|
||
Price history
1 event — show timeline
- 2026-03-25 Listed $239,900 MRED as Distributed by MLS Grid
Property tax history
-8.0%/yrLatest (2025): $362 · +4.6% YoY. Source: county tax records.
Cash-flow waterfall
monthlySold comps — $/sqft
last 12 mo · ≤1 miLoading sold comps…