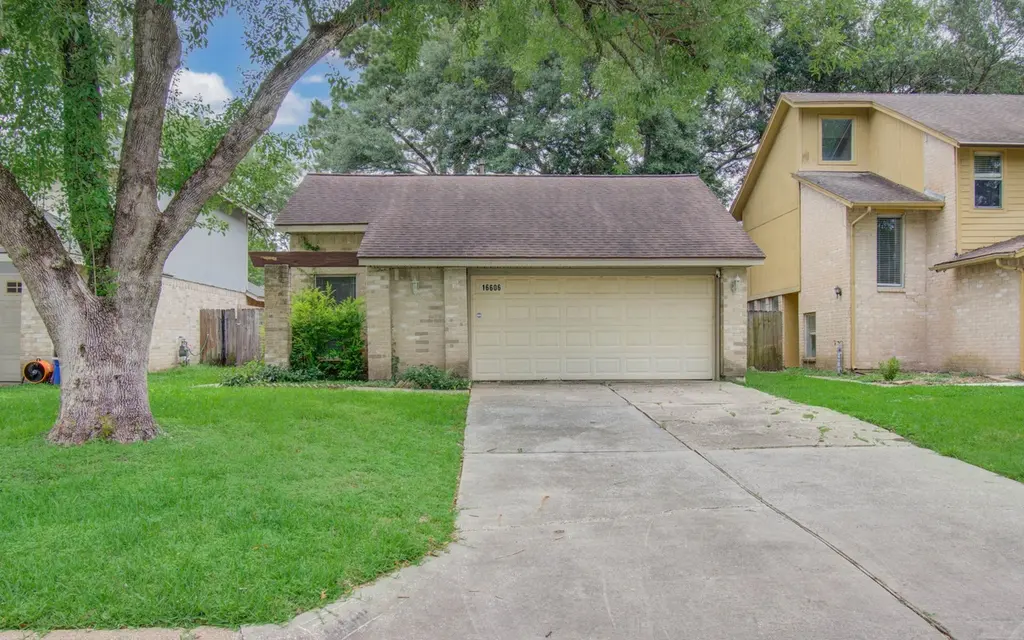
16606 Quiet Trail Dr · Atascocita, TX
Flood risk 3/10 · Minor
- FEMA flood zone
- X (unshaded)
- Chance of flooding over 30 yrs
- 0.2%
- Est. flood insurance / yr
- $507 – $1,088
Fire risk 3/10 · Minor
- Est. fire insurance / yr
- $1,222 – $2,270
Heat risk 9/10 · Severe
- Hot days now (above 110°F)
- 7 days/yr
- Hot days in 30 yrs
- 23 days/yr
Wind risk 9/10 · Severe
- Chance of severe wind over 30 yrs
- 99.0%
Air-quality risk 3/10 · Minor
- Unhealthy air days now
- 3 days/yr
- Unhealthy air days in 30 yrs
- 3 days/yr
Risk factors via First Street. Map © Google.
Why this score? — see what drove the D grade
The composite is a weighted blend of 9 inputs, each scored 0–100. Each bar is that input's sub-score; the figure is the points it added to the 100-point composite (weight × sub-score).
- ARV discount +15.0/15.0
- Cash flow +9.9/30.0
- 1% rule +4.7/10.0
- Schools +3.9/10.0
- Livability +3.5/5.0
- DSCR +2.8/10.0
- Condition / age +2.5/5.0
- Rent growth +1.8/5.0
- Appreciation +0.0/10.0
$160,000
🖨 Deal sheet (PDF) 📄 Offer letter ✓ Due diligence
Listing remarks
Welcome to 16626 Quiet Trail—a 2-bedroom, 2-bathroom home in a quiet, well-established neighborhood. With brand-new paint and updated flooring throughout with no carpet, this home feels fresh, clean, and ready for your personal touch. The open living and dining area offers great natural light and flexible space, perfect for relaxing or entertaining. The kitchen is practical and bright, with ample cabinetry and easy flow into the main living areas. Each bedroom is generously sized, and both bathrooms are well-maintained and functional. Guest bathroom is equipped with a walk in bathtub Enjoy the privacy of a fully fenced backyard—ideal for pets, gardening, or weekend barbecues. Co
Key facts
- Ample cabinetry
- Updated flooring
- Walk in bathtub
Tags
Property features AI
Finance
- Other: Lease not considered; Seller disclosure available
- HOA & community: Atascocita Forest community association with $375 annual fee
Exterior
- Parking: Attached 2-car garage
- Utilities: Public water; Public sewer
- Home design: Residential property; Built in 1982; Slab foundation; Composition roof
- Construction: Brick, cement siding, and wood siding construction
- Exterior features: Subdivision lot
Interior
- Bedrooms: 2 total rooms (includes bedroom count within total rooms)
- Bathrooms: 2 full bathrooms
- Heating & cooling: Central heating (gas); Central electric air conditioning
- Interior features: Gas fireplace
Neighborhood map
What this means for you Summary
Snapshot
- This is a 2-bed/2.0-bath single-family listed at $160k.
Deal economics
- At list price, monthly cash flow is $-101 ($-1k/yr) — negative.
- To cash-flow at today's rent, offer at most $142k (11.1% below list).
- To meet the 1% rule (rent ≥ 1% of price), the offer needs to be $154k (3.5% below list).
- Recommended offer: $142k (11.1% below list) — sets the bar for cash-flow.
- Cap rate 5.5% vs local median 4.0% in Atascocita — top-decile yield for the area; either an underpriced asset or a hidden risk that comps aren't pricing in. Stress-test before assuming the spread holds.
Location & tenants
- Location reads 70/100 on livability (#346 in TX) — a middle-class / working-renter tenant base. Strengths: employment A+, cost of living A+, housing A+; Watch: amenities F, commute F, health & safety F.
- Humble ISD (urban): math 38% / reading 44% proficiency, ranked #262 of 826 in TX (top 32%) — families likely to look elsewhere, expect single-tenant / working-renter base with shorter leases.
- Zoned schools: Whispering Pines El (math 21% / reading 25%, grade F, #3,277 of 4,322 statewide, top 77%, 697 students, 77% FRL); Humble Middle (math 21% / reading 29%, grade F, #1,258 of 1,662 statewide, top 77%, 1,382 students, 81% FRL); Humble H S (math 15% / reading 31%, grade F, #1,348 of 1,632 statewide, top 83%, 2,867 students, 77% FRL) — zoned schools average 78% FRL vs 32% district-wide (46 pts higher); higher-poverty schools than district average — tighter screening recommended.
- Zoned-school proficiency averages 24% at this address vs 41% district-wide (-17 pts) — the specific schools serving this property underperform the Humble ISD average; the district grade overstates school quality for this exact location.
- Market conditions: Rents soft (-2.9%/yr); 260 active listings in the ZIP; 32 comparable units currently listed for rent nearby; rentals leasing fast (median 12d on market — plan ~1-2 weeks tenant-placement turnaround); solid renter incomes; 29,883 units permitted in Harris County in 2024 (8,621 in 5+ unit buildings).
Forward outlook
- Local home prices are declining (-3.0%/yr); year-one equity from $1k of loan paydown is wiped out by about $5k of value loss. Plan a longer hold.
- Harris County population projected at +47% by 2050 — long-run rental-demand tailwind backs the buy-and-hold thesis.
Negotiation context
- It's been on market 41 days — a 3% lower offer ($155k) is reasonable based on typical stale-listing flexibility.
Risks & watch-outs
- Watch-outs: property tax is 2.9% of price.
- Climate carrying-cost: severe wind risk, 99% chance of damaging wind over 30y; extreme-heat days projected 7→23/yr by 2055 (HVAC capex compounding) — expect insurance premiums to compound above CPI over the hold.
Questions for the listing agent
- What do current leases actually rent for vs. the listed asking? Can we see a recent rent roll and the last 12 months of T-12 income?
- It's been on market 41 days. Have you received any prior offers? Is the seller open to a 11% concession, seller financing, or rate buy-down credit?
- Property tax is high relative to price — has the assessment been appealed recently, and will the sale trigger a re-assessment?
- What does the HOA fee cover, when was the last increase, and are there any pending special assessments or reserve-fund shortfalls?
- Is there a deadline driving the sale (1031 exchange, divorce, estate, relocation)? That informs how much negotiation room exists.
- The area grade is low — what's the realistic commute time and amenity access for the typical tenant pool here? Any planned neighborhood developments (good or bad) we should know about?
- What's the average days-on-market for RENTAL listings here right now (not sales)? A rising rental-DOM trend means longer vacancies and softer asking-rent achievability than the comps imply.
- What's the recent tenant-quality profile in this submarket — average credit score on applications, eviction rate, late-payment / NSF rate, and stable-employment percentage? A property-management company in the area should have these aggregated.
- How much new for-sale + rental construction is in the pipeline within 1–3 miles? Heavy new supply typically softens prices + rents 12–24 months out; constrained supply supports both.
Investment metrics
- 1% rule
- 0.97% ✗
- Cap rate
- 5.54%
- Cash-on-cash
- -2.69%
- DSCR
- 0.88
- GRM
- 8.6
CMA / ARV
- ARV (median comp)
- $204,150
- List price
- $160,000
- Delta
- -21.63%
- Verdict
- UNDERPRICED
- Comps
- 20 within 1.0 mi
Show comp detail 9 sales within ~0.75 mi
| Address | Dist | Beds/Ba | Sqft | Sold | Price | $/sf | Match |
|---|---|---|---|---|---|---|---|
| 16626 Quiet Trail Dr | 0.04mi | 2/2.0 | 1,096 (0%) | 6mo | $153,000 | $140 | 93 |
| 16727 Capewood Dr | 0.11mi | 2/2.0 | 1,096 (0%) | 6mo | $150,000 | $137 | 90 |
| 16606 Capewood Dr | 0.06mi | 2/2.0 | 1,096 (0%) | 17mo | $219,500 | $200 | 84 |
| 3614 Cyril Drive Dr | 0.05mi | 2/2.0 | 1,224 (+12%) | 2mo | $189,000 | $154 | 77 |
| 16730 Quiet Trail Dr | 0.12mi | 2/2.0 | 1,096 (0%) | 24mo | $209,000 | $191 | 74 |
| 16618 Shrub Oak Dr | 0.06mi | 2/2.0 | 1,250 (+14%) | 4mo | $199,990 | $160 | 71 |
| 16619 Capewood Dr | 0.04mi | 2/2.0 | 1,248 (+14%) | 7mo | $194,999 | $156 | 70 |
| 16706 Capewood Dr | 0.09mi | 2/2.0 | 1,224 (+12%) | 13mo | $190,000 | $155 | 66 |
| 16718 Highland Villa Ln | 0.56mi | 3/2.0 (+1) | 1,173 (+7%) | 11mo | $225,000 | $192 | 47 |
Match score weights: distance 35% · size 25% · config 20% · recency 20%. Top-matched comps best support the ARV.
Projected returns pro-forma
-3.0% appreciation · 0.0% rent growth · sell at horizon
- IRR
- -24.8%
- Equity multiple
- 0.18×
- Total profit
- $-36,705
- Equity at exit
- $23,857
- IRR
- -37.2%
- Equity multiple
- -0.27×
- Total profit
- $-57,074
- Equity at exit
- $13,834
Cash invested: $44,800 (down + closing). Projections, not guarantees.
Landlord ↔ Tenant lean methodology
- Overall (STATE)
- 87 Strongly Landlord-Friendly
- State Texas
- 87 Strongly Landlord-Friendly · R+5
- County
- — inherits STATE
- City
- — inherits STATE
ZIP-level market 77396
- Home prices YoY
- -22.5%
- Rents YoY
- -2.9%
- Active inventory
- 260
- Price-to-rent
- 8.6×
Monthly cashflow live
- Estimated rent
- $1,545 high interval (Pro) →
- Mortgage (P&I)
- −$839
- Tax from tax record
- −$384 /mo · $4,609/yr
- Insurance
- −$67
- HOA
- −$31
- Vacancy / Maint / Mgmt
- −$324
- Net cashflow
- $-101
Break-even live
Sensitivity live
| Price | -10% $-10 | -5% $-55 | +0% $-101 | +5% $-146 | +10% $-191 |
|---|---|---|---|---|---|
| Rent | -10% $-223 | -5% $-162 | +0% $-101 | +5% $-40 | +10% $21 |
| Rate | -1.0pp $-20 | -0.5pp $-60 | base $-101 | +0.5pp $-142 | +1.0pp $-184 |
UW: 25.0% down · 7.5% · 30yr · 1.5% tax · 5.0% vac · 8.0% maint · 8.0% mgmt
Financing live
Cash to close
- Down payment
- $40,000
- Closing costs
- $4,800
- Reserves months
- —
- Total cash needed
- —
Loan-product check · same deal, 3 products live
Conventional
25% down · 7.5% · 30yr
- Down + closing
- —
- Monthly P&I
- —
- Monthly cashflow
- —
- DSCR
- —
- Eligible?
- —
Personal DTI + credit; lowest rate.
DSCR
20% down · 8.5% · 30yr
- Down + closing
- —
- Monthly P&I
- —
- Monthly cashflow
- —
- DSCR
- —
- Eligible?
- —
No personal income docs; deal must DSCR.
Hard money
10% down · 12.0% · 12mo
- Down + closing
- —
- Monthly P&I
- —
- Monthly cashflow
- —
- DSCR
- —
- Eligible?
- —
Short-term bridge; refi at stabilization.
Rent comps 32 comps
| Address | Beds | Baths | Sqft | Rent | $/sqft | DOM | Units | Dist |
|---|---|---|---|---|---|---|---|---|
| 3623 Village Grove Dr Humble, TX | 3.0 | 2.0 | 1404 | $1,709 | $1.22 | 18d | 1 | 0.35mi |
| 15951 Woodland Hills Dr Humble, TX | 2.0 | 2.0 | 1019 | $1,720 | $1.69 | 26d | 1 | 0.61mi |
| 15951 Woodland Hills Dr Unit 2047 Humble, TX | 2.0 | 2.0 | 1019 | $1,585 | $1.56 | 13d | 1 | 0.68mi |
| 15951 Woodland Hills Dr Unit 1148 Humble, TX | 1.0 | 1.0 | 709 | $1,127 | $1.59 | 0d | 1 | 0.68mi |
| 15951 Woodland Hills Dr Unit 1162 Humble, TX | 1.0 | 1.0 | 709 | $1,138 | $1.61 | 7d | 1 | 0.68mi |
| 15951 Woodland Hills Dr Unit 424 Humble, TX | 2.0 | 2.0 | 1019 | $1,550 | $1.52 | 7d | 1 | 0.68mi |
| 15951 Woodland Hills Dr Unit 2148 Humble, TX | 2.0 | 2.0 | 1019 | $1,575 | $1.55 | 0d | 1 | 0.68mi |
| 15951 Woodland Hills Dr Unit 2112 Humble, TX | 2.0 | 2.0 | 1019 | $1,534 | $1.51 | 0d | 1 | 0.68mi |
| 15951 Woodland Hills Dr Unit 16002 Humble, TX | 1.0 | 1.0 | 709 | $1,127 | $1.59 | 14d | 1 | 0.68mi |
| 15951 Woodland Hills Dr Unit 16008 Humble, TX | 2.0 | 2.0 | 1019 | $1,574 | $1.54 | 12d | 1 | 0.68mi |
| 15951 Woodland Hills Dr Unit 15972 Humble, TX | 1.0 | 1.0 | 709 | $1,177 | $1.66 | 12d | 1 | 0.68mi |
| 15951 Woodland Hills Dr Unit 15972 Humble, TX | 1.0 | 1.0 | 709 | $1,173 | $1.65 | 14d | 1 | 0.68mi |
| 15863 Kinlough Dr Humble, TX | 2.0–3.0 | 2.0–2.5 | 1326 | $2,052 | $1.55 | 4d | 16 | 0.81mi |
| 15713 Saxton Mist Dr Humble, TX | 3.0–4.0 | 2.5–3.5 | 1643 | $2,099 | $1.28 | 0d | 35 | 1.03mi |
| 15729 Ballater Ridge Ln Atascocita, TX | 2.0 | 2.0 | 1122 | $1,995 | $1.78 | 45d | 1 | 1.05mi |
| 3918 Atascocita Rd Humble, TX | 1.0–2.0 | 1.0–2.0 | 945 | $1,650 | $1.75 | 17d | 13 | 1.07mi |
| 19100 Woodland Hills Dr Humble, TX | 1.0–3.0 | 1.0–2.0 | 898 | $1,298 | $1.45 | 0d | 9 | 1.26mi |
| 17935 Hunters Terrace Dr Humble, TX | 1.0–2.0 | 1.0–2.0 | 914 | $2,432 | $2.66 | 17d | 60 | 1.29mi |
| 18110 Hunters Terrace Dr Unit 2165 Humble, TX | 2.0 | 2.0 | 1113 | $1,838 | $1.65 | 0d | 1 | 1.45mi |
| 18110 Hunters Terrace Dr Unit 1165 Humble, TX | 1.0 | 1.0 | 700 | $1,098 | $1.57 | 0d | 1 | 1.45mi |
| 18110 Hunters Terrace Dr Unit 18133 Humble, TX | 2.0 | 2.0 | 1113 | $1,878 | $1.69 | 12d | 1 | 1.46mi |
| 18110 Hunters Terrace Dr Unit 18131 Humble, TX | 1.0 | 1.0 | 713 | $1,219 | $1.71 | 14d | 1 | 1.46mi |
| 18110 Hunters Terrace Dr Unit 18131 Humble, TX | 1.0 | 1.0 | 700 | $1,148 | $1.64 | 12d | 1 | 1.46mi |
| 18110 Hunters Terrace Dr Unit 2148 Humble, TX | 2.0 | 2.0 | 1113 | $1,879 | $1.69 | 0d | 1 | 1.46mi |
| 18110 Hunters Terrace Dr Unit 1162 Humble, TX | 1.0 | 1.0 | 700 | $1,109 | $1.58 | 7d | 1 | 1.46mi |
| 18110 Hunters Terrace Dr Unit 2162 Humble, TX | 2.0 | 2.0 | 1113 | $1,854 | $1.67 | 7d | 1 | 1.46mi |
| 18110 Hunters Terrace Dr Unit 1174 Humble, TX | 1.0 | 1.0 | 700 | $1,139 | $1.63 | 0d | 1 | 1.46mi |
| 18110 Hunters Terrace Dr Unit 18167 Humble, TX | 2.0 | 2.0 | 1030 | $1,589 | $1.54 | 45d | 1 | 1.46mi |
| 18110 Hunters Terrace Dr Humble, TX | 2.0 | 2.0 | 1104 | $1,699 | $1.54 | 14d | 1 | 1.46mi |
| 18110 Hunters Terrace Dr Unit 18161 Humble, TX | 1.0 | 1.0 | 700 | $1,214 | $1.73 | 45d | 1 | 1.46mi |
| 18110 Hunters Terrace Dr Unit 2174 Humble, TX | 2.0 | 2.0 | 1030 | $1,564 | $1.52 | 17d | 1 | 1.46mi |
| 18110 Hunters Terrace Dr Humble, TX | 1.0 | 1.0 | 700 | $1,098 | $1.57 | 14d | 1 | 1.46mi |
HOA detail
- Monthly dues
- $31 · $372/yr
Listing history 18 events
-
2026-06-21days on market $160,000 Active 41 DOM
-
2026-06-18days on market $160,000 Active 38 DOM
-
2026-06-17days on market $160,000 Active 37 DOM
-
2026-06-16days on market $160,000 Active 36 DOM
-
2026-06-15days on market $160,000 Active 35 DOM
-
2026-06-13days on market $160,000 Active 33 DOM
-
2026-06-13days on market $160,000 Active 32 DOM
-
2026-06-09days on market $160,000 Active 29 DOM
-
2026-06-08days on market $160,000 Active 28 DOM
-
2026-06-07days on market $160,000 Active 27 DOM
-
2026-06-04days on market $160,000 Active 24 DOM
-
2026-06-03days on market $160,000 Active 23 DOM
-
2026-06-02days on market $160,000 Active 22 DOM
-
2026-06-01days on market $160,000 Active 21 DOM
-
2026-05-31days on market $160,000 Active 20 DOM
-
2026-05-11$175,000 Active 922-char remark
-
2022-12-09historical
-
1988-02-12soldstatus
ⓘ Source: listings_history table (triggers on properties + properties_extension) + one-shot
backfill from property_details.listing_events for pre-trigger history.
Tax reassessment forecast TX · Resets to sale price
- Current annual tax
- $4,609 · $384/mo
- Projected year-2 tax
- $4,609 · $384/mo
- Expected delta
- $0/yr ($0/mo · 0.0%)
ⓘ Screening estimate from a state-policy table — verify with the county assessor before closing.
Climate risk First Street
- Flood 3/10 Moderate FEMA zone X (unshaded) · 20% chance over 30 yrs
- Wildfire 3/10 Moderate
- Heat 9/10 Extreme 7 d/yr ≥110°F today · 23 d/yr by 30 yrs out
- Wind 9/10 Extreme 99% chance of damaging wind over 30 yrs
- Air quality 3/10 Moderate 3 unhealthy d/yr today · 3 by 30 yrs out
Nearby sold comps map
Loading sold comps map…
Walkable amenities ~0.75 mi
Loading nearby amenities…
Taxation est. · year 1
- Rental income
- $18,535
- − Mortgage interest
- −$8,962
- − Property taxes
- −$4,609
- − Insurance
- −$800
- − Repairs & maintenance
- −$1,483
- − Management
- −$1,483
- − HOA
- −$372
- − Depreciation
- −$4,655
- Taxable loss
- −$3,829
- Est. tax savings @ 24.0%
- +$919
- After-tax cash flow
- $-288/yr
For passive investors: Depreciation is non-cash, so a rental often shows a tax loss while cash-flowing — sheltering income. Rental losses are passive: they offset passive income freely, and up to $25,000/yr can offset ordinary (W-2) income if you actively participate and your MAGI is under $100k (phasing out to $0 by $150k); unused losses carry forward. On sale, claimed depreciation is recaptured at up to 25%, and gains may owe capital-gains tax (a 1031 exchange can defer both). Figures are a year-1 estimate at your 24.0% rate — not tax advice; consult a CPA.
Schools (NCES district)
- District
- Humble ISD
- NCES district ID
- 4823910
- Math proficiency
- 38% ▼ -11.00%
- Reading proficiency
- 44% ▼ -7.00%
- Median HH income
- $83,946
- Composite
- 38.55/100
- National rank
- #4171
- State rank
- #262 of 826 in TX
Livability — Atascocita
- Score
- 70/100
- State rank
- #346
- US rank
- #7586
Category grades
Schools grade is shown separately in the Schools card above.
Census & demographics
- Census place
- Atascocita, TX
- County
- Harris County · 4,702,590 people
- City population
- 79,538
- Metro
- Houston-The Woodlands-Sugar Land, TX
- Population (ZIP)
- 61,735
- Household income
- $78,169
- Rent vs Own
- Severe rent burden
- 1655.0
Population outlook (Harris County) Hauer SSP2
- Today (2025)
- 5,571,493 people
- By 2030
- 6,089,821 · +9.3%
- By 2040
- 7,142,806 · +28.2%
- By 2050
- 8,185,864 · +46.9%
- By 2075
- 10,574,329 · +89.8%
- By 2100
- 12,109,958 · +117.4%
Race, ethnicity, and origin ACS 2023
- Neighborhood character
- Diverse neighborhood (Simpson 0.67)
- Race & ethnicity
- Hispanic / Latino 46% Black 29% Two or more races 19% White 19% Asian 4%
- Hispanic origin (detail)
- Mexican 36%
- Common ancestry
- Lithuanian 1% Slovak 1% Romanian 1%
- Foreign-born
- 18% · Canada, Vietnam, Jamaica
- Languages at home
- 58% English-only · Spanish 37% Other Indo-European 1% Vietnamese 1%
Political lean MEDSL · Harris
- 2024 margin
- Lean D (+5.5) · D 52.0% · R 46.4% · Other 1.6%
- 2008→2024 swing
- +3.9pp toward D · 2008: 1.6pp · 2024: 5.5pp
- All cycles
- 2024: D+5.5 2020: D+13.3 2016: D+12.4 2012: D+0.1 2008: D+1.6
Not yet ingested
- Civics
- —
Market trends
- HPI YoY
- ▼ -70.66%
- Current HPI
- 243.7012
- Rent YoY
- ▼ -2.92%
- Metro
- Houston-The Woodlands-Sugar Land, TX
- State GDP YoY
- ▲ 3.95%
- F500 in state
- 110
Industry mix (Fortune 500 HQ in TX)
| Industry | F500 HQs | Revenue |
|---|---|---|
| Energy | 16 | $1,198B |
|
||
| Technology | 5 | $198B |
|
||
| Engineering / Construction | 4 | $72B |
|
||
| Energy Services | 3 | $60B |
|
||
| Utilities | 3 | $41B |
|
||
| Healthcare | 2 | $330B |
|
||
Price history
-8.6% since first listed4 events — show timeline
- 2026-05-26 Price Changed $160,000 HARMLS
- 2026-05-11 Listed $175,000 HARMLS
- 2022-12-09 Rental Removed — RENT.
- 1988-02-12 Sold (Public Records) — Public Records
Property tax history
+3.9%/yrLatest (2025): $4,609 · -0.3% YoY. Source: county tax records.
Cash-flow waterfall
monthlySold comps — $/sqft
last 12 mo · ≤1 miLoading sold comps…