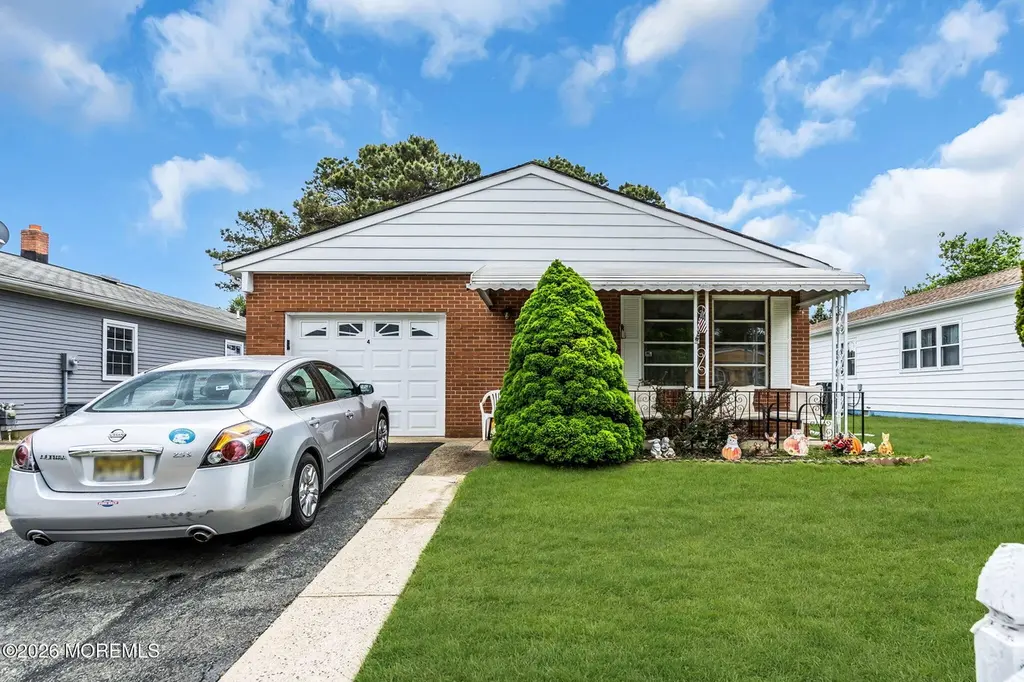
4 Brisbane Ct · Berkeley, NJ
Flood risk 1/10 · Minimal
- FEMA flood zone
- X (unshaded)
- Chance of flooding over 30 yrs
- 0.0%
- Est. flood insurance / yr
- $507 – $1,088
Fire risk 5/10 · Moderate
- Est. fire insurance / yr
- $526 – $976
Heat risk 7/10 · Major
- Hot days now (above 103°F)
- 7 days/yr
- Hot days in 30 yrs
- 15 days/yr
Wind risk 6/10 · Moderate
- Chance of severe wind over 30 yrs
- 65.0%
Air-quality risk 3/10 · Minor
- Unhealthy air days now
- 3 days/yr
- Unhealthy air days in 30 yrs
- 4 days/yr
Risk factors via First Street. Map © Google.
Why this score? — see what drove the D+ grade
The composite is a weighted blend of 9 inputs, each scored 0–100. Each bar is that input's sub-score; the figure is the points it added to the 100-point composite (weight × sub-score).
- ARV discount +15.0/15.0
- Cash flow +14.9/30.0
- DSCR +4.5/10.0
- 1% rule +3.9/10.0
- Schools +2.6/10.0
- Rent growth +2.5/5.0
- Livability +2.5/5.0
- Condition / age +2.5/5.0
- Appreciation +0.0/10.0
$279,000
🖨 Deal sheet 📄 Offer letter ✓ Due diligence
Listing remarks MLS
Time to say goodbye to the home the seller has loved for 33 years!!!! This Capri is on a great street In HC West. Come make this home your own!!! The owner has had everything serviced every year, including sprinkler system, A/C, Furnace, Pest control company.. most systems under service contracts.
Key facts
- 5,662 sq ft lot
- Garage
- Community pool
Neighborhood map
What this means for you Summary
Snapshot
- This is a 2-bed/2.0-bath single-family listed at $279k.
Deal economics
- At list price, monthly cash flow is $80 ($963/yr) — positive.
- The deal already cash-flows at list — no discount required.
- To meet the 1% rule (rent ≥ 1% of price), the offer needs to be $249k (10.6% below list).
- Recommended offer: $249k (10.6% below list) — sets the bar for 1% rule.
Location & tenants
- Location reads: area grade D — affects rentability + tenant quality, not the cash-flow math above.
- Central Regional School District (suburban): math 17% / reading 43% proficiency, ranked #357 of 472 in NJ (top 76%) — families likely to look elsewhere, expect single-tenant / working-renter base with shorter leases.
- Market conditions: 491 active listings in the ZIP; 7 comparable units currently listed for rent nearby; rentals leasing fast (median 2d on market — plan ~1-2 weeks tenant-placement turnaround); 4,434 units permitted in Ocean County in 2024 (868 in 5+ unit buildings).
- At $2,493/mo this rent would consume 51% of the median local household income ($58k/yr) (locally 1010% of renters already pay >50% of income on rent) — very limited rent-growth headroom before tenants either downsize or default.
Forward outlook
- Local home prices are declining (-3.0%/yr); year-one equity from $2k of loan paydown is wiped out by about $8k of value loss. Plan a longer hold.
- Ocean County population projected to shrink 8% by 2050 — rents likely to lag national; underwrite the cash flow, not the appreciation.
Negotiation context
- It's been on market 23 days — a 2% lower offer ($275k) is reasonable based on typical stale-listing flexibility.
- Current owner paid $80k; list at $279k implies a 249% gain — meaningful room to come down on a strong offer.
Risks & watch-outs
- Climate carrying-cost: major wind risk, 65% chance of damaging wind over 30y; moderate wildfire risk; extreme-heat days projected 7→15/yr by 2055 (HVAC capex compounding) — expect insurance premiums to compound above CPI over the hold.
Questions for the listing agent
- What does the HOA fee cover, when was the last increase, and are there any pending special assessments or reserve-fund shortfalls?
- Is there a deadline driving the sale (1031 exchange, divorce, estate, relocation)? That informs how much negotiation room exists.
- The area grade is low — what's the realistic commute time and amenity access for the typical tenant pool here? Any planned neighborhood developments (good or bad) we should know about?
- What's the average days-on-market for RENTAL listings here right now (not sales)? A rising rental-DOM trend means longer vacancies and softer asking-rent achievability than the comps imply.
- What's the recent tenant-quality profile in this submarket — average credit score on applications, eviction rate, late-payment / NSF rate, and stable-employment percentage? A property-management company in the area should have these aggregated.
- How much new for-sale + rental construction is in the pipeline within 1–3 miles? Heavy new supply typically softens prices + rents 12–24 months out; constrained supply supports both.
Investment metrics
- 1% rule
- 0.89% ✗
- Cap rate
- 6.64%
- Cash-on-cash
- 1.23%
- DSCR
- 1.05
- GRM
- 9.3
CMA / ARV
- ARV (on-the-fly)
- $361,216
- Comps found
- 12
Show comp detail 12 sales within ~0.75 mi
| Address | Dist | Beds/Ba | Sqft | Sold | Price | $/sf | Match |
|---|---|---|---|---|---|---|---|
| 6 Preston Ct | 0.19mi | 2/2.0 | 1,232 (-7%) | 0mo | $350,000 | $284 | 79 |
| 1 Redlands Ct | 0.19mi | 2/2.0 | 1,232 (-7%) | 1mo | $349,000 | $283 | 78 |
| 13 Greenville Ct | 0.58mi | 2/2.0 | 1,328 (0%) | 0mo | $329,900 | $248 | 73 |
| 373 Costa Mesa Dr | 0.39mi | 2/2.0 | 1,232 (-7%) | 0mo | $418,500 | $340 | 69 |
| 409 Costa Mesa Dr | 0.42mi | 2/2.0 | 1,424 (+7%) | 1mo | $360,000 | $253 | 67 |
| 211 Bonaire Dr | 0.58mi | 2/2.0 | 1,264 (-5%) | 1mo | $305,000 | $241 | 64 |
| 76 Troumaka St | 0.52mi | 2/2.0 | 1,232 (-7%) | 1mo | $286,000 | $232 | 63 |
| 5 Corfu Ct | 0.52mi | 2/2.0 | 1,440 (+8%) | 1mo | $515,000 | $358 | 60 |
| 139 Torrey Pines Dr | 0.35mi | 2/2.0 | 1,508 (+14%) | 1mo | $410,000 | $272 | 60 |
| 3 Montego St | 0.60mi | 2/2.0 | 1,232 (-7%) | 1mo | $254,500 | $207 | 59 |
| 1 Miramar Ct | 0.74mi | 2/2.0 | 1,232 (-7%) | 1mo | $335,000 | $272 | 53 |
| 71 Winterton Dr | 0.57mi | 2/2.0 | 1,502 (+13%) | 1mo | $329,900 | $220 | 51 |
Match score weights: distance 35% · size 25% · config 20% · recency 20%. Top-matched comps best support the ARV.
Projected returns pro-forma
-3.0% appreciation · 3.0% rent growth · sell at horizon
- IRR
- -14.3%
- Equity multiple
- 0.49×
- Total profit
- $-40,083
- Equity at exit
- $41,600
- IRR
- -5.6%
- Equity multiple
- 0.64×
- Total profit
- $-28,263
- Equity at exit
- $24,123
Cash invested: $78,120 (down + closing). Projections, not guarantees.
Landlord ↔ Tenant lean methodology
- Overall (STATE)
- 21 Tenant-Leaning
- State New Jersey
- 21 Tenant-Leaning · D+6
- County
- — inherits STATE
- City
- — inherits STATE
ZIP-level market 08757
- Active inventory
- 491
- Price-to-rent
- 9.3×
Monthly cashflow live
- Estimated rent
- $2,493 high interval (Pro) →
- Mortgage (P&I)
- −$1,463
- Tax from tax record
- −$268 /mo · $3,214/yr
- Insurance
- −$116
- HOA
- −$42
- Vacancy / Maint / Mgmt
- −$524
- Net cashflow
- $80
Break-even live
UW: 25.0% down · 7.5% · 30yr · 1.5% tax · 5.0% vac · 8.0% maint · 8.0% mgmt
Financing live
Cash to close
- Down payment
- $69,750
- Closing costs
- $8,370
- Reserves months
- —
- Total cash needed
- —
Loan-product check · same deal, 3 products live
Conventional
25% down · 7.5% · 30yr
- Down + closing
- —
- Monthly P&I
- —
- Monthly cashflow
- —
- DSCR
- —
- Eligible?
- —
Personal DTI + credit; lowest rate.
DSCR
20% down · 8.5% · 30yr
- Down + closing
- —
- Monthly P&I
- —
- Monthly cashflow
- —
- DSCR
- —
- Eligible?
- —
No personal income docs; deal must DSCR.
Hard money
10% down · 12.0% · 12mo
- Down + closing
- —
- Monthly P&I
- —
- Monthly cashflow
- —
- DSCR
- —
- Eligible?
- —
Short-term bridge; refi at stabilization.
Rent comps 7 comps
| Address | Beds | Baths | Sqft | Rent | $/sqft | DOM | Units | Dist |
|---|---|---|---|---|---|---|---|---|
| 10 Purnell St Toms River, NJ | 2.0 | 2.0 | 1232 | $2,300 | $1.87 | 1d | 1 | 0.11mi |
| 510 Jamaica Blvd Toms River, NJ | 2.0 | 2.0 | 1264 | $2,500 | $1.98 | 1d | 1 | 0.96mi |
| 159 Fort de France Ave Toms River, NJ | 2.0 | 2.0 | 1440 | $2,475 | $1.72 | 6d | 1 | 0.99mi |
| 56 Auburn Rd Toms River, NJ | 2.0 | 2.0 | 1514 | $2,650 | $1.75 | 1d | 1 | 1.17mi |
| 1700 New Jersey 37 Unit 112-11 Toms River, NJ | 2.0 | 2.0 | 1224 | $2,299 | $1.88 | 1d | 1 | 1.29mi |
| 59 Guadeloupe Dr Toms River, NJ | 2.0 | 2.0 | 1126 | $2,300 | $2.04 | 1d | 1 | 1.35mi |
| 2035 Route 37 Manchester, NJ | 2.0 | 2.0 | 1375 | $2,775 | $2.02 | 1d | 3 | 1.42mi |
HOA detail
- Monthly dues
- $42 · $504/yr
Listing history 7 events
-
2026-06-03days on market $279,000 Active 23 DOM
-
2026-06-02days on market $279,000 Active 22 DOM
-
2026-06-01days on market $279,000 Active 21 DOM
-
2026-05-31days on market $279,000 Active 20 DOM
-
2026-05-18price $279,000 301-char remark
Show marketing remark (301 chars)
Time to say goodbye to the home the seller has loved for 33 years!!!! This Capri is on a great street In HC West. Come make this home your own!!! The owner has had everything serviced every year, including sprinkler system, A/C, Furnace, Pest control company.. most systems under service contracts.
-
2026-05-11$289,500 Active 301-char remark
Show marketing remark (301 chars)
Time to say goodbye to the home the seller has loved for 33 years!!!! This Capri is on a great street In HC West. Come make this home your own!!! The owner has had everything serviced every year, including sprinkler system, A/C, Furnace, Pest control company.. most systems under service contracts.
-
1992-07-29soldstatus $80,000
ⓘ Source: listings_history table (triggers on properties + properties_extension) + one-shot
backfill from property_details.listing_events for pre-trigger history.
Tax reassessment forecast NJ · Partial reset (capped growth)
- Current annual tax
- $3,214 · $268/mo
- Projected year-2 tax
- $5,081 · $423/mo
- Expected delta
- +$1,866/yr (+$156/mo · 58.1%)
ⓘ Screening estimate from a state-policy table — verify with the county assessor before closing.
Climate risk First Street
- Flood 1/10 Low FEMA zone X (unshaded) · 0% chance over 30 yrs
- Wildfire 5/10 Major
- Heat 7/10 Severe 7 d/yr ≥103°F today · 15 d/yr by 30 yrs out
- Wind 6/10 Major 65% chance of damaging wind over 30 yrs
- Air quality 3/10 Moderate 3 unhealthy d/yr today · 4 by 30 yrs out
Nearby sold comps map
Loading sold comps map…
Walkable amenities ~0.75 mi
Loading nearby amenities…
Taxation est. · year 1
- Rental income
- $29,916
- − Mortgage interest
- −$15,628
- − Property taxes
- −$3,214
- − Insurance
- −$1,395
- − Repairs & maintenance
- −$2,393
- − Management
- −$2,393
- − HOA
- −$504
- − Depreciation
- −$8,116
- Taxable loss
- −$3,728
- Est. tax savings @ 24.0%
- +$895
- After-tax cash flow
- $1,858/yr
For passive investors: Depreciation is non-cash, so a rental often shows a tax loss while cash-flowing — sheltering income. Rental losses are passive: they offset passive income freely, and up to $25,000/yr can offset ordinary (W-2) income if you actively participate and your MAGI is under $100k (phasing out to $0 by $150k); unused losses carry forward. On sale, claimed depreciation is recaptured at up to 25%, and gains may owe capital-gains tax (a 1031 exchange can defer both). Figures are a year-1 estimate at your 24.0% rate — not tax advice; consult a CPA.
Schools (NCES district)
- District
- Central Regional School District
- NCES district ID
- 3402910
- Math proficiency
- 17% ▼ -14.00%
- Reading proficiency
- 43% ▲ 7.00%
- Median HH income
- $44,676
- Composite
- 25.59/100
- National rank
- #7422
- State rank
- #357 of 472 in NJ
Livability — Berkeley
No livability data for this city. (Only ~50 U.S. cities are tracked.)
Census & demographics
- Census place
- Holiday City-Berkeley, NJ
- County
- Ocean County · 439,426 people
- Metro
- New York-Newark-Jersey City, NY-NJ-PA
- Population (ZIP)
- 36,087
- Household income
- $58,319
- Rent vs Own
- Severe rent burden
- 1010.0
Population outlook (Ocean County) Hauer SSP2
- Today (2025)
- 586,991 people
- By 2030
- 581,403 · -1.0%
- By 2040
- 564,913 · -3.8%
- By 2050
- 538,149 · -8.3%
- By 2075
- 468,845 · -20.1%
- By 2100
- 350,297 · -40.3%
Race, ethnicity, and origin ACS 2023
- Neighborhood character
- Predominantly White (75%)
- Race & ethnicity
- White 75% Hispanic / Latino 15% Two or more races 9% Black 5% Asian 2%
- Hispanic origin (detail)
- Mexican 4% Puerto Rican 6% Dominican 1%
- Common ancestry
- Romanian 9% Slovak 2% Iranian 2%
- Foreign-born
- 11% · Canada, Jamaica
- Languages at home
- 85% English-only · Spanish 7% Other Indo-European 3% Russian/Polish/Slavic 2%
Political lean MEDSL · Ocean
- 2024 margin
- Solid R (+36.0) · D 31.4% · R 67.4% · Other 1.2%
- 2008→2024 swing
- -17.6pp toward R · 2008: -18.4pp · 2024: -36.0pp
- All cycles
- 2024: R+36.0 2020: R+28.7 2016: R+34.0 2012: R+17.7 2008: R+18.4
Not yet ingested
- Civics
- —
Market trends
- HPI YoY
- ▼ -429.32%
- Current HPI
- 305.1341
- Rent YoY
- —
- Metro
- New York-Newark-Jersey City, NY-NJ-PA
- State GDP YoY
- ▲ 2.05%
- F500 in state
- 34
Industry mix (Fortune 500 HQ in NJ)
| Industry | F500 HQs | Revenue |
|---|---|---|
| Consumer Goods | 3 | $31B |
|
||
| Pharmaceuticals | 2 | $153B |
|
||
| Technology | 2 | $21B |
|
||
| Insurance | 2 | $20B |
|
||
| Healthcare | 2 | $19B |
|
||
| Financial Services | 1 | $70B |
|
||
Price history
+248.7% since first listed3 events — show timeline
- 2026-05-18 Price Changed $279,000 MOMLS
- 2026-05-11 Listed $289,500 MOMLS
- 1992-07-29 Sold (Public Records) $80,000 Public Records
Property tax history
+0.7%/yrLatest (2025): $3,214 · +7.4% YoY. Source: county tax records.
Cash-flow waterfall
monthlySold comps — $/sqft
last 12 mo · ≤1 miLoading sold comps…