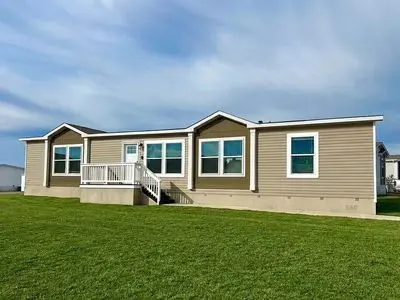
4901 Berdoll Bnd · Austin, TX
Flood risk 1/10 · Minimal
- FEMA flood zone
- X (unshaded)
- Chance of flooding over 30 yrs
- 0.0%
- Est. flood insurance / yr
- $507 – $1,088
Fire risk 5/10 · Moderate
- Est. fire insurance / yr
- $1,222 – $2,270
Heat risk 8/10 · Major
- Hot days now (above 108°F)
- 7 days/yr
- Hot days in 30 yrs
- 22 days/yr
Wind risk 8/10 · Major
- Chance of severe wind over 30 yrs
- 80.0%
Air-quality risk 1/10 · Minimal
- Unhealthy air days now
- 0 days/yr
- Unhealthy air days in 30 yrs
- 0 days/yr
Risk factors via First Street. Map © Google.
Why this score? — see what drove the B- grade
The composite is a weighted blend of 9 inputs, each scored 0–100. Each bar is that input's sub-score; the figure is the points it added to the 100-point composite (weight × sub-score).
- Cash flow +27.8/30.0
- DSCR +9.8/10.0
- 1% rule +7.6/10.0
- ARV discount +7.5/15.0
- Livability +4.1/5.0
- Condition / age +4.0/5.0
- Appreciation +3.4/10.0
- Rent growth +2.4/5.0
- Schools +1.9/10.0
$164,999
🖨 Deal sheet 📄 Offer letter ✓ Due diligence
Listing remarks
Next Open House: Sunday, March 29 from 2-4 pm Stunning 1,800 sq. ft. home situated on the largest lot in the Oak Ranch Community, just steps from the future amenity center. Designed with both style and functionality in mind, the spacious open-concept floor plan is filled with natural light from abundant windows, creating a bright and inviting atmosphere throughout. The heart of the home is the chef& apos; s kitchen featuring a huge center island, upgraded appliances and ample cabinet space. Just off the kitchen, you& apos; ll find a spacious laundry room with built-in shelving and cabinets, and the washer and dryer are included for added convenience. The private primary suite is a
Key facts
- Huge center island
- Largest lot
- Built-in shelving
Tags
Property features AI
Exterior
- Home design: Built in 2022
- Construction: Built in 2022
- Exterior features: Located in the Del Valle subdivision
Neighborhood map
What this means for you Summary
Snapshot
- This is a 3-bed/3.0-bath other listed at $165k. Condition is rated good.
Deal economics
- At list price, monthly cash flow is $502 ($6k/yr) — positive.
- The deal already cash-flows at list — no discount required.
- Meets the 1% rule at list price ($2k rent vs $165k).
- Cap rate 9.9% vs local median 1.8% in Austin — top-decile yield for the area; either an underpriced asset or a hidden risk that comps aren't pricing in. Stress-test before assuming the spread holds.
Location & tenants
- Location reads 82/100 on livability (#16 in TX, #1,208 nationally) — a professional / high-income tenant draw. Strengths: amenities A+, commute A+, employment A+; Watch: cost of living D, crime F.
- Del Valle ISD (rural): math 19% / reading 26% proficiency, ranked #749 of 826 in TX (top 91%) — low school quality limits family demand, transient renter base, plan for 1-2y turnover; 77% free/reduced lunch — lower-income household profile, screen leases tightly.
- Market conditions: Rents soft (-0.4%/yr); 246 active listings in the ZIP; 25 comparable units currently listed for rent nearby; rentals at typical pace (median 17d on market — plan ~3-4 weeks tenant-placement turnaround); 17,121 units permitted in Travis County in 2024 (11,963 in 5+ unit buildings).
- This rent runs 35% of the median local income ($72k/yr) — at the standard rent-burdened threshold; future hikes will face affordability resistance.
Forward outlook
- Local home prices are declining (-3.0%/yr); year-one equity from $1k of loan paydown is wiped out by about $5k of value loss. Plan a longer hold.
- Travis County population projected at +60% by 2050 — long-run rental-demand tailwind backs the buy-and-hold thesis.
Negotiation context
- Only 1 days on market — expect competitive offers; lowballing is unlikely to land.
Risks & watch-outs
- Climate carrying-cost: severe wind risk, 80% chance of damaging wind over 30y; moderate wildfire risk; extreme-heat days projected 7→22/yr by 2055 (HVAC capex compounding) — expect insurance premiums to compound above CPI over the hold.
Questions for the listing agent
- Is there a deadline driving the sale (1031 exchange, divorce, estate, relocation)? That informs how much negotiation room exists.
- Crime grade is F in this area — have there been break-ins, vandalism, or insurance claims at this property in the last 3 years? What carrier currently insures it and at what premium?
- What's the average days-on-market for RENTAL listings here right now (not sales)? A rising rental-DOM trend means longer vacancies and softer asking-rent achievability than the comps imply.
- What's the recent tenant-quality profile in this submarket — average credit score on applications, eviction rate, late-payment / NSF rate, and stable-employment percentage? A property-management company in the area should have these aggregated.
- How much new for-sale + rental construction is in the pipeline within 1–3 miles? Heavy new supply typically softens prices + rents 12–24 months out; constrained supply supports both.
Investment metrics
- 1% rule
- 1.26% ✓
- Cap rate
- 9.94%
- Cash-on-cash
- 13.03%
- DSCR
- 1.58
- GRM
- 6.6
CMA / ARV
No comps found within radius.
Projected returns pro-forma
-3.0% appreciation · 0.0% rent growth · sell at horizon
- IRR
- -0.5%
- Equity multiple
- 0.98×
- Total profit
- $-853
- Equity at exit
- $24,602
- IRR
- 5.7%
- Equity multiple
- 1.37×
- Total profit
- $16,978
- Equity at exit
- $14,266
Cash invested: $46,200 (down + closing). Projections, not guarantees.
Landlord ↔ Tenant lean methodology
- Overall (STATE)
- 87 Strongly Landlord-Friendly
- State Texas
- 87 Strongly Landlord-Friendly · R+5
- County
- — inherits STATE
- City
- — inherits STATE
ZIP-level market 78617
- Home prices YoY
- -1.7%
- Rents YoY
- -0.4%
- Active inventory
- 246
- Price-to-rent
- 6.6×
Monthly cashflow live
- Estimated rent
- $2,078 high interval (Pro) →
- Mortgage (P&I)
- −$865
- Tax est. 1.5%
- −$206 /mo · $2,475/yr
- Insurance
- −$69
- HOA
- −$0
- Vacancy / Maint / Mgmt
- −$436
- Net cashflow
- $502
Break-even live
UW: 25.0% down · 7.5% · 30yr · 1.5% tax · 5.0% vac · 8.0% maint · 8.0% mgmt
Financing live
Cash to close
- Down payment
- $41,250
- Closing costs
- $4,950
- Reserves months
- —
- Total cash needed
- —
Loan-product check · same deal, 3 products live
Conventional
25% down · 7.5% · 30yr
- Down + closing
- —
- Monthly P&I
- —
- Monthly cashflow
- —
- DSCR
- —
- Eligible?
- —
Personal DTI + credit; lowest rate.
DSCR
20% down · 8.5% · 30yr
- Down + closing
- —
- Monthly P&I
- —
- Monthly cashflow
- —
- DSCR
- —
- Eligible?
- —
No personal income docs; deal must DSCR.
Hard money
10% down · 12.0% · 12mo
- Down + closing
- —
- Monthly P&I
- —
- Monthly cashflow
- —
- DSCR
- —
- Eligible?
- —
Short-term bridge; refi at stabilization.
Rent comps 25 comps
| Address | Beds | Baths | Sqft | Rent | $/sqft | DOM | Units | Dist |
|---|---|---|---|---|---|---|---|---|
| 5032 Irvine Ln Del Valle, TX | 4.0 | 2.5 | 2499 | $2,200 | $0.88 | 22d | 1 | 0.40mi |
| 4917 Stockton Ln Del Valle, TX | 4.0 | 2.5 | 2334 | $2,400 | $1.03 | 44d | 1 | 0.42mi |
| 5501 Ross Rd Del Valle, TX | 1.0–3.0 | 1.0–2.0 | 950 | $1,876 | $1.97 | 2d | 16 | 0.58mi |
| 12417 Sky Harbor Dr Del Valle, TX | 3.0 | 2.0 | 1586 | $1,975 | $1.25 | 24d | 1 | 0.74mi |
| 13109 Lofton Cliff Dr Del Valle, TX | 3.0 | 2.0 | 1917 | $2,075 | $1.08 | 12d | 1 | 0.76mi |
| 12604 Paloma Blanca Way Del Valle, TX | 3.0 | 2.0 | 1423 | $1,700 | $1.19 | 16d | 1 | 0.81mi |
| 6101 Ross Rd Del Valle, TX | 1.0–2.0 | 10.0 | 937 | $2,140 | $2.28 | 2d | 43 | 0.89mi |
| 13229 Coomes Dr Del Valle, TX | 3.0 | 2.0 | 1703 | $1,995 | $1.17 | 12d | 1 | 0.90mi |
| 13400 Coomes Dr Del Valle, TX | 3.0 | 2.5 | 1625 | $1,895 | $1.17 | 3d | 1 | 0.98mi |
| 13400 Coomes Dr Del Valle, TX | 3.0 | 2.0 | 1625 | $1,895 | $1.17 | 4d | 1 | 0.98mi |
| 6200 Albany Sleigh Dr Del Valle, TX | 3.0 | 2.0 | 1647 | $2,350 | $1.43 | 44d | 1 | 1.05mi |
| 5521 Victory Gallop Dr Del Valle, TX | 3.0 | 2.5 | 1788 | $2,000 | $1.12 | 15d | 1 | 1.09mi |
| 5525 Victory Gallop Dr Del Valle, TX | 3.0 | 2.5 | 1788 | $1,850 | $1.03 | 44d | 1 | 1.09mi |
| 5600 War Admiral Dr Del Valle, TX | 4.0 | 2.5 | 2101 | $2,200 | $1.05 | 3d | 1 | 1.11mi |
| 6316 Carriage Pines Dr Del Valle, TX | 3.0 | 2.5 | 2305 | $2,300 | $1.00 | 44d | 1 | 1.12mi |
| 6400 Wagon Spring St Del Valle, TX | 3.0 | 2.5 | 1665 | $1,975 | $1.19 | 4d | 1 | 1.14mi |
| 6408 Wagon Spring St Del Valle, TX | 4.0 | 3.0 | 2497 | $2,495 | $1.00 | 44d | 1 | 1.15mi |
| 6409 Wagon Spring St Del Valle, TX | 4.0 | 2.0 | 1421 | $1,895 | $1.33 | 16d | 1 | 1.15mi |
| 6417 Wagon Spring St Del Valle, TX | 3.0 | 2.5 | 2230 | $2,149 | $0.96 | 44d | 1 | 1.17mi |
| 6417 Wagon Spring St Del Valle, TX | 3.0 | 2.5 | 2230 | $2,100 | $0.94 | 12d | 1 | 1.17mi |
| 6420 Carriage Pines Dr Del Valle, TX | 3.0 | 2.5 | 1665 | $1,995 | $1.20 | 44d | 1 | 1.17mi |
| 12821 Stoney Ridge Bnd Del Valle, TX | 3.0 | 2.5 | 2281 | $2,250 | $0.99 | 18d | 1 | 1.31mi |
| 12316 Noel Bain Cv Del Valle, TX | 3.0 | 2.5 | 2281 | $2,100 | $0.92 | 3d | 1 | 1.38mi |
| 13817 Gilwell Dr Del Valle, TX | 4.0 | 3.0 | 1878 | $2,195 | $1.17 | 44d | 1 | 1.45mi |
| 13917 Gilwell Dr Del Valle, TX | 3.0 | 2.5 | 1743 | $2,100 | $1.20 | 18d | 1 | 1.49mi |
Listing history 1 events
-
2026-05-26$164,999 Active
ⓘ Source: listings_history table (triggers on properties + properties_extension) + one-shot
backfill from property_details.listing_events for pre-trigger history.
Climate risk First Street
- Flood 1/10 Low FEMA zone X (unshaded) · 0% chance over 30 yrs
- Wildfire 5/10 Major
- Heat 8/10 Severe 7 d/yr ≥108°F today · 22 d/yr by 30 yrs out
- Wind 8/10 Severe 80% chance of damaging wind over 30 yrs
- Air quality 1/10 Low 0 unhealthy d/yr today · 0 by 30 yrs out
Nearby sold comps map
Loading sold comps map…
Walkable amenities ~0.75 mi
Loading nearby amenities…
Taxation est. · year 1
- Rental income
- $24,939
- − Mortgage interest
- −$9,243
- − Property taxes
- −$2,475
- − Insurance
- −$825
- − Repairs & maintenance
- −$1,995
- − Management
- −$1,995
- − Depreciation
- −$4,800
- Taxable income
- $3,606
- Est. tax owed @ 24.0%
- −$865
- After-tax cash flow
- $5,153/yr
For passive investors: Depreciation is non-cash, so a rental often shows a tax loss while cash-flowing — sheltering income. Rental losses are passive: they offset passive income freely, and up to $25,000/yr can offset ordinary (W-2) income if you actively participate and your MAGI is under $100k (phasing out to $0 by $150k); unused losses carry forward. On sale, claimed depreciation is recaptured at up to 25%, and gains may owe capital-gains tax (a 1031 exchange can defer both). Figures are a year-1 estimate at your 24.0% rate — not tax advice; consult a CPA.
Condition & rehab AI · 1 photo
This 1,800 sq. ft. home in the Oak Ranch Community is in excellent condition with a spacious floor plan and modern amenities. It is move-in ready and offers a great opportunity for both resale and rental value with minor updates.
Value-add opportunities
- Both Painting exterior and interior walls — Fresh paint enhances curb appeal and interior aesthetics.
- Both Landscaping improvements — Enhances curb appeal and adds value to the property.
- Resale Upgrading kitchen appliances — Modern appliances improve the home's appeal to potential buyers.
- Resale Upgrading bathrooms with modern fixtures — Modern bathrooms attract more buyers and renters.
- Both Adding smart home features — Enhances convenience and adds value to the property for both buyers and renters.
Renovation cost estimate screening
Value-add ROI direction
- Both Painting exterior and interior walls — Fresh paint enhances curb appeal and interior aesthetics. ↑
- Both Landscaping improvements — Enhances curb appeal and adds value to the property. ↑
- Resale Upgrading kitchen appliances — Modern appliances improve the home's appeal to potential buyers. ↑
- Resale Upgrading bathrooms with modern fixtures — Modern bathrooms attract more buyers and renters. ↑
- Both Adding smart home features — Enhances convenience and adds value to the property for both buyers and renters. ↑
ⓘ Cost ranges are severity-bucket heuristics (US national rule-of-thumb). Get contractor quotes + a written scope before underwriting a rehab budget.
Schools (NCES district)
- District
- Del Valle ISD
- NCES district ID
- 4816620
- Math proficiency
- 19% ▼ -13.00%
- Reading proficiency
- 26% ▼ -2.00%
- Median HH income
- $41,322
- Composite
- 19.13/100
- National rank
- #8830
- State rank
- #749 of 826 in TX
Livability — Austin
- Score
- 82/100
- State rank
- #16
- US rank
- #1208
Category grades
Schools grade is shown separately in the Schools card above.
Census & demographics
- Census place
- Austin, TX
- County
- Travis County · 1,299,254 people
- City population
- 1,066,854
- Metro
- Austin-Round Rock-Georgetown, TX
- Population (ZIP)
- 30,756
- Household income
- $71,640
- Rent vs Own
- Severe rent burden
- 681.0
Population outlook (Travis County) Hauer SSP2
- Today (2025)
- 1,545,133 people
- By 2030
- 1,729,269 · +11.9%
- By 2040
- 2,097,596 · +35.8%
- By 2050
- 2,463,890 · +59.5%
- By 2075
- 3,249,374 · +110.3%
- By 2100
- 3,801,868 · +146.1%
Race, ethnicity, and origin ACS 2023
- Neighborhood character
- Predominantly Hispanic (75%)
- Race & ethnicity
- Hispanic / Latino 75% Two or more races 33% White 16% Black 6% Asian 1%
- Hispanic origin (detail)
- Mexican 68% Puerto Rican 1%
- Common ancestry
- Romanian 1%
- Foreign-born
- 26% · Canada
- Languages at home
- 41% English-only · Spanish 57% Other Asian/Pacific 1%
Political lean MEDSL · Travis
- 2024 margin
- Solid D (+39.3) · D 68.8% · R 29.4% · Other 1.8%
- 2008→2024 swing
- +9.9pp toward D · 2008: 29.4pp · 2024: 39.3pp
- All cycles
- 2024: D+39.3 2020: D+45.0 2016: D+38.9 2012: D+23.9 2008: D+29.4
Not yet ingested
- Civics
- —
Market trends
- HPI YoY
- ▼ -3.24%
- Current HPI
- 192.3518
- Rent YoY
- ▼ -0.36%
- Metro
- Austin-Round Rock-Georgetown, TX
- State GDP YoY
- ▲ 3.95%
- F500 in state
- 110
Industry mix (Fortune 500 HQ in TX)
| Industry | F500 HQs | Revenue |
|---|---|---|
| Energy | 16 | $1,198B |
|
||
| Technology | 5 | $198B |
|
||
| Engineering / Construction | 4 | $72B |
|
||
| Energy Services | 3 | $60B |
|
||
| Utilities | 3 | $41B |
|
||
| Healthcare | 2 | $330B |
|
||
Price history
1 event — show timeline
- 2026-05-26 Listed $164,999 FSBO.com
Cash-flow waterfall
monthlySold comps — $/sqft
last 12 mo · ≤1 miLoading sold comps…