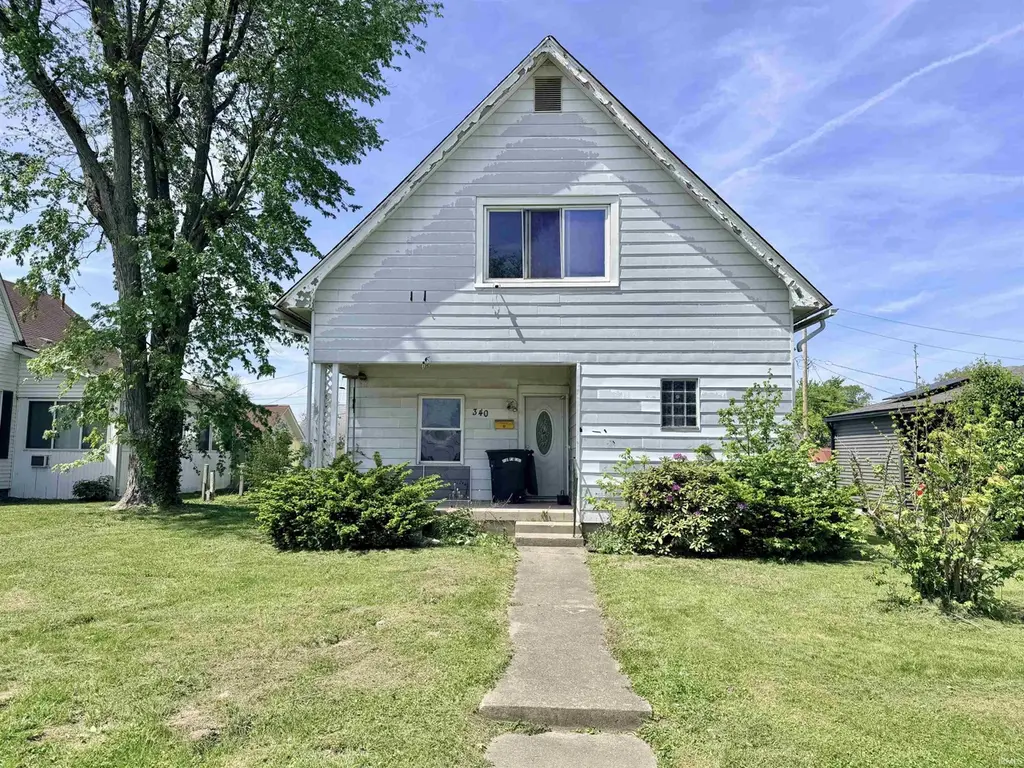
340 NE 10th St · Linton, IN
Flood risk 1/10 · Minimal
- FEMA flood zone
- X (unshaded)
- Chance of flooding over 30 yrs
- 0.0%
- Est. flood insurance / yr
- $507 – $1,088
Fire risk 1/10 · Minimal
- Est. fire insurance / yr
- $717 – $1,331
Heat risk 4/10 · Minor
- Hot days now (above 104°F)
- 7 days/yr
- Hot days in 30 yrs
- 19 days/yr
Wind risk 2/10 · Minimal
- Chance of severe wind over 30 yrs
- 1.0%
Air-quality risk 3/10 · Minor
- Unhealthy air days now
- 2 days/yr
- Unhealthy air days in 30 yrs
- 3 days/yr
Risk factors via First Street. Map © Google.
Why this score? — see what drove the B- grade
The composite is a weighted blend of 9 inputs, each scored 0–100. Each bar is that input's sub-score; the figure is the points it added to the 100-point composite (weight × sub-score).
- Cash flow +30.0/30.0
- 1% rule +10.0/10.0
- DSCR +10.0/10.0
- ARV discount +7.5/15.0
- Livability +3.6/5.0
- Schools +3.5/10.0
- Rent growth +2.5/5.0
- Condition / age +2.5/5.0
- Appreciation +0.0/10.0
$50,000
🖨 Deal sheet 📄 Offer letter ✓ Due diligence
Listing remarks MLS
Looking for your next flip? Here it is! Located on NE side of Linton. Good bones ready to put your own touches on it.
Key facts
- 7,405 sq ft lot
- Built 1900
- Listed 54 days
Neighborhood map
What this means for you Summary
Snapshot
- This is a 3-bed/1.5-bath single-family listed at $50k.
Deal economics
- At list price, monthly cash flow is $709 ($9k/yr) — positive.
- The deal already cash-flows at list — no discount required.
- Meets the 1% rule at list price ($1k rent vs $50k).
- Recommended offer: $48k (3.0% below list) — sets the bar for market timing.
- Cap rate 23.3% vs local median 5.2% in Linton — top-decile yield for the area; either an underpriced asset or a hidden risk that comps aren't pricing in. Stress-test before assuming the spread holds.
Location & tenants
- Location reads 71/100 on livability (#129 in IN) — a middle-class / working-renter tenant base. Strengths: cost of living A+, housing A+, health & safety A+; Watch: schools D+, amenities F, commute F.
- Linton-Stockton School Corporation (town): math 39% / reading 45% proficiency, ranked #128 of 301 in IN (top 42%) — families likely to look elsewhere, expect single-tenant / working-renter base with shorter leases.
- Market conditions: 66 active listings in the ZIP.
Forward outlook
- Local home prices are declining (-3.0%/yr); year-one equity from $346 of loan paydown is wiped out by about $2k of value loss. Plan a longer hold.
- Greene County population projected at -22% by 2050 — secular population decline; favor cash flow + early exit over multi-decade hold.
- At projected returns (-3.0% appreciation + 3.0% rent growth), your $14k cash investment doubles in ~2 years — after that, you're playing with house money.
Negotiation context
- It's been on market 55 days — a 3% lower offer ($48k) is reasonable based on typical stale-listing flexibility.
- 2 sale attempts since 12y ago with the ask held roughly flat each time — persistent listings suggest the price (not the market) is what's stuck; bring a comps-based counter.
Risks & watch-outs
- Watch-outs: built in 1900 — expect roof / HVAC / electrical / plumbing capex.
Questions for the listing agent
- It's been on market 55 days. Have you received any prior offers? Is the seller open to a 3% concession, seller financing, or rate buy-down credit?
- Built in 1900 — when were the roof, HVAC, electrical panel, plumbing, and water heater last replaced?
- Is there a deadline driving the sale (1031 exchange, divorce, estate, relocation)? That informs how much negotiation room exists.
- Schools are D-rated, which usually means shorter tenancies and higher turnover. Who's the typical renter profile here, and what's been the actual vacancy rate?
- What's the average days-on-market for RENTAL listings here right now (not sales)? A rising rental-DOM trend means longer vacancies and softer asking-rent achievability than the comps imply.
- What's the recent tenant-quality profile in this submarket — average credit score on applications, eviction rate, late-payment / NSF rate, and stable-employment percentage? A property-management company in the area should have these aggregated.
- How much new for-sale + rental construction is in the pipeline within 1–3 miles? Heavy new supply typically softens prices + rents 12–24 months out; constrained supply supports both.
Investment metrics
- 1% rule
- 2.66% ✓
- Cap rate
- 23.31%
- Cash-on-cash
- 60.77%
- DSCR
- 3.70
- GRM
- 3.1
CMA / ARV
- ARV (median comp)
- $201,350
- List price
- $50,000
- Delta
- -75.17%
- Verdict
- UNDERPRICED
- Comps
- 20 within 1.0 mi
Show comp detail 9 sales within ~0.75 mi
| Address | Dist | Beds/Ba | Sqft | Sold | Price | $/sf | Match |
|---|---|---|---|---|---|---|---|
| 340 NE 10th St | 0.00mi | 3/3.0 | 2,218 (0%) | 0mo | $42,000 | $19 | 94 |
| 290 NE 7th St | 0.18mi | 4/2.0 (+1) | 2,352 (+6%) | 8mo | $248,000 | $105 | 68 |
| 610 NE 10 St | 0.17mi | 4/2.0 (+1) | 2,060 (-7%) | 9mo | $200,000 | $97 | 66 |
| 969 SE A St | 0.08mi | 4/2.0 (+1) | 2,305 (+4%) | 21mo | $215,000 | $93 | 65 |
| 889 7th St. St NE | 0.37mi | 3/2.0 | 2,024 (-9%) | 5mo | $249,500 | $123 | 62 |
| 209 B St St SE | 0.45mi | 3/3.0 | 2,268 (+2%) | 9mo | $165,000 | $73 | 62 |
| 389 NE 10th St | 0.04mi | 4/2.0 (+1) | 2,074 (-6%) | 23mo | $182,000 | $88 | 61 |
| 1110 NE A St | 0.10mi | 3/3.0 | 1,932 (-13%) | 17mo | $221,000 | $114 | 54 |
| 289 NE Sixth St. St | 0.21mi | 4/1.0 (+1) | 1,898 (-14%) | 20mo | $135,000 | $71 | 43 |
Match score weights: distance 35% · size 25% · config 20% · recency 20%. Top-matched comps best support the ARV.
Projected returns pro-forma
-3.0% appreciation · 3.0% rent growth · sell at horizon
- IRR
- 59.6%
- Equity multiple
- 3.65×
- Total profit
- $37,072
- Equity at exit
- $7,455
- IRR
- 64.3%
- Equity multiple
- 7.46×
- Total profit
- $90,500
- Equity at exit
- $4,323
Cash invested: $14,000 (down + closing). Projections, not guarantees.
Landlord ↔ Tenant lean methodology
- Overall (STATE)
- 90 Strongly Landlord-Friendly
- State Indiana
- 90 Strongly Landlord-Friendly · R+11
- County
- — inherits STATE
- City
- — inherits STATE
ZIP-level market 47441
- Home prices YoY
- -31.3%
- Active inventory
- 66
- Price-to-rent
- 3.1×
Monthly cashflow live
- Estimated rent
- $1,330 medium interval (Pro) →
- Mortgage (P&I)
- −$262
- Tax from tax record
- −$59 /mo · $708/yr
- Insurance
- −$21
- HOA
- −$0
- Vacancy / Maint / Mgmt
- −$279
- Net cashflow
- $709
Break-even live
UW: 25.0% down · 7.5% · 30yr · 1.5% tax · 5.0% vac · 8.0% maint · 8.0% mgmt
Financing live
Cash to close
- Down payment
- $12,500
- Closing costs
- $1,500
- Reserves months
- —
- Total cash needed
- —
Loan-product check · same deal, 3 products live
Conventional
25% down · 7.5% · 30yr
- Down + closing
- —
- Monthly P&I
- —
- Monthly cashflow
- —
- DSCR
- —
- Eligible?
- —
Personal DTI + credit; lowest rate.
DSCR
20% down · 8.5% · 30yr
- Down + closing
- —
- Monthly P&I
- —
- Monthly cashflow
- —
- DSCR
- —
- Eligible?
- —
No personal income docs; deal must DSCR.
Hard money
10% down · 12.0% · 12mo
- Down + closing
- —
- Monthly P&I
- —
- Monthly cashflow
- —
- DSCR
- —
- Eligible?
- —
Short-term bridge; refi at stabilization.
Listing history 14 events
-
2026-06-15days on market $50,000 Active 55 DOM
-
2026-06-13days on market $50,000 Active 53 DOM
-
2026-06-12days on market $50,000 Active 52 DOM
-
2026-06-09days on market $50,000 Active 49 DOM
-
2026-06-08days on market $50,000 Active 48 DOM
-
2026-06-07days on market $50,000 Active 47 DOM
-
2026-06-07days on market $50,000 Active 46 DOM
-
2026-06-04days on market $50,000 Active 43 DOM
-
2026-06-02days on market $50,000 Active 42 DOM
-
2026-06-01days on market $50,000 Active 41 DOM
-
2026-05-31days on market $50,000 Active 40 DOM
-
2026-05-31days on market $50,000 Active 39 DOM
-
2026-04-21$50,000 Active 117-char remark
Show marketing remark (117 chars)
Looking for your next flip? Here it is! Located on NE side of Linton. Good bones ready to put your own touches on it.
-
2014-07-26$64,900
ⓘ Source: listings_history table (triggers on properties + properties_extension) + one-shot
backfill from property_details.listing_events for pre-trigger history.
Tax reassessment forecast IN · Partial reset (capped growth)
- Current annual tax
- $708 · $59/mo
- Projected year-2 tax
- $708 · $59/mo
- Expected delta
- $0/yr ($0/mo · 0.0%)
ⓘ Screening estimate from a state-policy table — verify with the county assessor before closing.
Climate risk First Street
- Flood 1/10 Low FEMA zone X (unshaded) · 0% chance over 30 yrs
- Wildfire 1/10 Low
- Heat 4/10 Moderate 7 d/yr ≥104°F today · 19 d/yr by 30 yrs out
- Wind 2/10 Low 100% chance of damaging wind over 30 yrs
- Air quality 3/10 Moderate 2 unhealthy d/yr today · 3 by 30 yrs out
Nearby sold comps map
Loading sold comps map…
Walkable amenities ~0.75 mi
Loading nearby amenities…
Taxation est. · year 1
- Rental income
- $15,965
- − Mortgage interest
- −$2,801
- − Property taxes
- −$708
- − Insurance
- −$250
- − Repairs & maintenance
- −$1,277
- − Management
- −$1,277
- − Depreciation
- −$1,455
- Taxable income
- $8,197
- Est. tax owed @ 24.0%
- −$1,967
- After-tax cash flow
- $6,541/yr
For passive investors: Depreciation is non-cash, so a rental often shows a tax loss while cash-flowing — sheltering income. Rental losses are passive: they offset passive income freely, and up to $25,000/yr can offset ordinary (W-2) income if you actively participate and your MAGI is under $100k (phasing out to $0 by $150k); unused losses carry forward. On sale, claimed depreciation is recaptured at up to 25%, and gains may owe capital-gains tax (a 1031 exchange can defer both). Figures are a year-1 estimate at your 24.0% rate — not tax advice; consult a CPA.
Schools (NCES district)
- District
- Linton-Stockton School Corporation
- NCES district ID
- 1805910
- Math proficiency
- 39% ▼ -6.00%
- Reading proficiency
- 45% ▼ -5.00%
- Median HH income
- $40,257
- Composite
- 35.2/100
- National rank
- #4990
- State rank
- #128 of 301 in IN
Livability — Linton
- Score
- 71/100
- State rank
- #129
- US rank
- #6717
Category grades
Schools grade is shown separately in the Schools card above.
Census & demographics
- Census place
- Linton, IN
- City population
- 8,755
- Population (ZIP)
- 8,755
Population outlook (Greene County) Hauer SSP2
- Today (2025)
- 30,724 people
- By 2030
- 29,506 · -4.0%
- By 2040
- 26,744 · -13.0%
- By 2050
- 23,879 · -22.3%
- By 2075
- 18,341 · -40.3%
- By 2100
- 13,976 · -54.5%
Race, ethnicity, and origin ACS 2023
- Neighborhood character
- Predominantly White (96%)
- Race & ethnicity
- White 96% Hispanic / Latino 2% Two or more races 1%
- Common ancestry
- Lithuanian 7% Slovak 2% Iranian 1%
- Foreign-born
- 1% · Canada
Political lean MEDSL · Greene
- 2024 margin
- Solid R (+53.7) · D 22.4% · R 76.1% · Other 1.6%
- 2008→2024 swing
- -39.2pp toward R · 2008: -14.5pp · 2024: -53.7pp
- All cycles
- 2024: R+53.7 2020: R+52.2 2016: R+53.4 2012: R+31.4 2008: R+14.5
Not yet ingested
- Civics
- —
Market trends
- HPI YoY
- ▼ -87.46%
- Current HPI
- 191.9718
- Rent YoY
- —
- Metro
- —
- State GDP YoY
- ▲ 2.90%
- F500 in state
- 18
Industry mix (Fortune 500 HQ in IN)
| Industry | F500 HQs | Revenue |
|---|---|---|
| Industrial Machinery | 2 | $37B |
|
||
| Healthcare | 1 | $177B |
|
||
| Pharmaceuticals | 1 | $45B |
|
||
| Metals / Steel | 1 | $18B |
|
||
| Agriculture | 1 | $17B |
|
||
| Packaging | 1 | $12B |
|
||
Price history
-23.0% since first listed2 events — show timeline
- 2026-04-21 Listed $50,000 IRMLS
- 2014-07-26 Listed $64,900 IRMLS
Property tax history
+4.2%/yrLatest (2024): $708 · +2.6% YoY. Source: county tax records.
Cash-flow waterfall
monthlySold comps — $/sqft
last 12 mo · ≤1 miLoading sold comps…