58 Jeb Stuart Ln · Falling Waters, WV
Flood risk 9/10 · Severe
- FEMA flood zone
- X (unshaded)
- Chance of flooding over 30 yrs
- 0.99%
- Est. flood insurance / yr
- $473 – $860
Fire risk 3/10 · Minor
- Est. fire insurance / yr
- $787 – $1,461
Heat risk 5/10 · Moderate
- Hot days now (above 102°F)
- 7 days/yr
- Hot days in 30 yrs
- 16 days/yr
Wind risk 2/10 · Minimal
- Chance of severe wind over 30 yrs
- 2.0%
Air-quality risk 1/10 · Minimal
- Unhealthy air days now
- 0 days/yr
- Unhealthy air days in 30 yrs
- 0 days/yr
Risk factors via First Street. Map © Google.
Why this score? — see what drove the B grade
The composite is a weighted blend of 9 inputs, each scored 0–100. Each bar is that input's sub-score; the figure is the points it added to the 100-point composite (weight × sub-score).
- Cash flow +30.0/30.0
- ARV discount +12.5/15.0
- 1% rule +10.0/10.0
- DSCR +10.0/10.0
- Livability +3.3/5.0
- Schools +2.6/10.0
- Rent growth +2.5/5.0
- Condition / age +2.5/5.0
- Appreciation +0.0/10.0
$65,000
🖨 Deal sheet 📄 Offer letter ✓ Due diligence
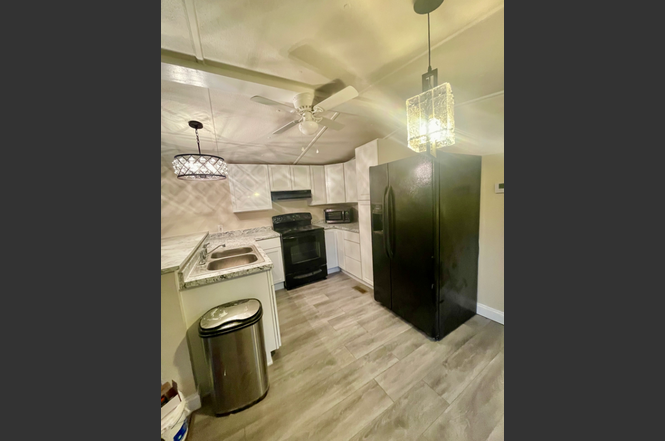
Listing remarks
Completely remodeled mobile home for sale in the Rocky Glen mobile home community just minutes from all the convenancies in Spring Mills West Virginia The home had three bedrooms two baths and has been completely remodeled New lvp flooring though out New updated kitchen with brand new cabinets new kitchen sink new countertops and a new breakfast bar installed Home comes with all appliances Refrigerator stove microwave washer & dryer All new light fixtures throughout the entire house all new electrical switches and plugs were installed Brand new remodeled bathroom with new tub new shower surround a new vanity sink and a new mirror were installed New Ceiling fans in all 3 bedrooms a
Key facts
- Remodeled bathroom
- New ceiling fans
- Updated kitchen
Tags
Property features AI
Exterior
- Home design: House
- Construction: Approximately 950 sq ft living area
- Exterior features: Approximately 1,000 sq ft lot
Neighborhood map
What this means for you Summary
Snapshot
- This is a 3-bed/1.5-bath single-family listed at $65k.
Deal economics
- At list price, monthly cash flow is $911 ($11k/yr) — positive.
- The deal already cash-flows at list — no discount required.
- Meets the 1% rule at list price ($2k rent vs $65k).
- Recommended offer: $57k (12.0% below list) — sets the bar for market timing.
- Cap rate 24.1% vs local median 4.0% in Falling Waters — top-decile yield for the area; either an underpriced asset or a hidden risk that comps aren't pricing in. Stress-test before assuming the spread holds.
Location & tenants
- Location reads 66/100 on livability (#116 in WV) — a middle-class / working-renter tenant base. Strengths: crime A+, employment A+, cost of living A+; Watch: schools F, amenities F, commute F.
- Berkeley County Schools (other): math 21% / reading 38% proficiency, ranked #24 of 55 in WV (top 44%) — low school quality limits family demand, transient renter base, plan for 1-2y turnover.
- Market conditions: 255 active listings in the ZIP; solid renter incomes; 1,460 units permitted in Berkeley County in 2024 (16 in 5+ unit buildings).
Forward outlook
- Local home prices are declining (-3.0%/yr); year-one equity from $449 of loan paydown is wiped out by about $2k of value loss. Plan a longer hold.
- Berkeley County population projected at +25% by 2050 — long-run rental-demand tailwind backs the buy-and-hold thesis.
- At projected returns (-3.0% appreciation + 3.0% rent growth), your $18k cash investment doubles in ~2 years — after that, you're playing with house money.
Negotiation context
- It's been on market 170 days — a 12% lower offer ($57k) is reasonable based on typical stale-listing flexibility.
Risks & watch-outs
- Watch-outs: flood insurance adds $56/mo.
- Climate carrying-cost: severe flood risk; extreme-heat days projected 7→16/yr by 2055 (HVAC capex compounding) — expect insurance premiums to compound above CPI over the hold.
Questions for the listing agent
- It's been on market 170 days. Have you received any prior offers? Is the seller open to a 12% concession, seller financing, or rate buy-down credit?
- What's the actual annual flood-insurance premium (NFIP or private), and is the property in a SFHA with mandatory coverage?
- Why hasn't it sold? Are there any deal-killer items the seller is aware of (foundation, flood, title, zoning, code violations)?
- Is there a deadline driving the sale (1031 exchange, divorce, estate, relocation)? That informs how much negotiation room exists.
- Schools are F-rated, which usually means shorter tenancies and higher turnover. Who's the typical renter profile here, and what's been the actual vacancy rate?
- What's the average days-on-market for RENTAL listings here right now (not sales)? A rising rental-DOM trend means longer vacancies and softer asking-rent achievability than the comps imply.
- What's the recent tenant-quality profile in this submarket — average credit score on applications, eviction rate, late-payment / NSF rate, and stable-employment percentage? A property-management company in the area should have these aggregated.
- How much new for-sale + rental construction is in the pipeline within 1–3 miles? Heavy new supply typically softens prices + rents 12–24 months out; constrained supply supports both.
Investment metrics
- 1% rule
- 2.76% ✓
- Cap rate
- 24.13%
- Cash-on-cash
- 63.70%
- DSCR
- 3.83
- GRM
- 3.0
CMA / ARV
- ARV (on-the-fly)
- $73,150
- Comps found
- 3
Show comp detail 3 sales within ~0.75 mi
| Address | Dist | Beds/Ba | Sqft | Sold | Price | $/sf | Match |
|---|---|---|---|---|---|---|---|
| 606 Fancy Filly Cir | 0.28mi | 2/2.0 (-1) | 975 (+3%) | 10mo | $75,000 | $77 | 67 |
| 164 Appomattox Dr | 0.07mi | 3/2.0 | 858 (-10%) | 16mo | $48,000 | $56 | 65 |
| 527 Fancy Filly Cir | 0.20mi | 3/2.0 | 1,000 (+5%) | 20mo | $106,000 | $106 | 63 |
Match score weights: distance 35% · size 25% · config 20% · recency 20%. Top-matched comps best support the ARV.
Projected returns pro-forma
-3.0% appreciation · 3.0% rent growth · sell at horizon
- IRR
- 58.8%
- Equity multiple
- 3.61×
- Total profit
- $47,522
- Equity at exit
- $9,692
- IRR
- 63.6%
- Equity multiple
- 7.39×
- Total profit
- $116,306
- Equity at exit
- $5,620
Cash invested: $18,200 (down + closing). Projections, not guarantees.
Landlord ↔ Tenant lean methodology
- Overall (STATE)
- 83 Strongly Landlord-Friendly
- State West Virginia
- 83 Strongly Landlord-Friendly · R+22
- County
- — inherits STATE
- City
- — inherits STATE
ZIP-level market 25403
- Home prices YoY
- -15.2%
- Active inventory
- 255
- Price-to-rent
- 3.0×
Monthly cashflow live
- Estimated rent
- $1,792 medium interval (Pro) →
- Mortgage (P&I)
- −$341
- Tax est. 1.5%
- −$81 /mo · $975/yr
- Insurance
- −$27
- Flood insurance flood zone
- −$56 /mo · $666/yr
- HOA
- −$0
- Vacancy / Maint / Mgmt
- −$376
- Net cashflow
- $911
Break-even live
UW: 25.0% down · 7.5% · 30yr · 1.5% tax · 5.0% vac · 8.0% maint · 8.0% mgmt
Financing live
Cash to close
- Down payment
- $16,250
- Closing costs
- $1,950
- Reserves months
- —
- Total cash needed
- —
Loan-product check · same deal, 3 products live
Conventional
25% down · 7.5% · 30yr
- Down + closing
- —
- Monthly P&I
- —
- Monthly cashflow
- —
- DSCR
- —
- Eligible?
- —
Personal DTI + credit; lowest rate.
DSCR
20% down · 8.5% · 30yr
- Down + closing
- —
- Monthly P&I
- —
- Monthly cashflow
- —
- DSCR
- —
- Eligible?
- —
No personal income docs; deal must DSCR.
Hard money
10% down · 12.0% · 12mo
- Down + closing
- —
- Monthly P&I
- —
- Monthly cashflow
- —
- DSCR
- —
- Eligible?
- —
Short-term bridge; refi at stabilization.
Listing history 15 events
-
2026-06-18days on market $65,000 Active 170 DOM
-
2026-06-17days on market $65,000 Active 169 DOM
-
2026-06-16days on market $65,000 Active 168 DOM
-
2026-06-15days on market $65,000 Active 167 DOM
-
2026-06-14days on market $65,000 Active 165 DOM
-
2026-06-13days on market $65,000 Active 164 DOM
-
2026-06-10days on market $65,000 Active 162 DOM
-
2026-06-09days on market $65,000 Active 161 DOM
-
2026-06-08days on market $65,000 Active 160 DOM
-
2026-06-07days on market $65,000 Active 159 DOM
-
2026-06-02days on market $65,000 Active 154 DOM
-
2026-06-01days on market $65,000 Active 153 DOM
-
2026-05-31days on market $65,000 Active 152 DOM
-
2026-05-30days on market $65,000 Active 151 DOM
-
2025-12-30$65,000 Active
ⓘ Source: listings_history table (triggers on properties + properties_extension) + one-shot
backfill from property_details.listing_events for pre-trigger history.
Climate risk First Street
- Flood 9/10 Extreme FEMA zone X (unshaded) · 99% chance over 30 yrs
- Wildfire 3/10 Moderate
- Heat 5/10 Major 7 d/yr ≥102°F today · 16 d/yr by 30 yrs out
- Wind 2/10 Low 2% chance of damaging wind over 30 yrs
- Air quality 1/10 Low 0 unhealthy d/yr today · 0 by 30 yrs out
Nearby sold comps map
Loading sold comps map…
Walkable amenities ~0.75 mi
Loading nearby amenities…
Taxation est. · year 1
- Rental income
- $21,498
- − Mortgage interest
- −$3,641
- − Property taxes
- −$975
- − Insurance
- −$992
- − Repairs & maintenance
- −$1,720
- − Management
- −$1,720
- − Depreciation
- −$1,891
- Taxable income
- $10,560
- Est. tax owed @ 24.0%
- −$2,534
- After-tax cash flow
- $8,392/yr
For passive investors: Depreciation is non-cash, so a rental often shows a tax loss while cash-flowing — sheltering income. Rental losses are passive: they offset passive income freely, and up to $25,000/yr can offset ordinary (W-2) income if you actively participate and your MAGI is under $100k (phasing out to $0 by $150k); unused losses carry forward. On sale, claimed depreciation is recaptured at up to 25%, and gains may owe capital-gains tax (a 1031 exchange can defer both). Figures are a year-1 estimate at your 24.0% rate — not tax advice; consult a CPA.
Schools (NCES district)
- District
- Berkeley County Schools
- NCES district ID
- 5400060
- Math proficiency
- 21% ▼ -12.00%
- Reading proficiency
- 38% ▼ -6.00%
- Median HH income
- $54,599
- Composite
- 26.16/100
- National rank
- #7273
- State rank
- #24 of 55 in WV
Livability — Falling Waters
- Score
- 66/100
- State rank
- #116
- US rank
- #12314
Category grades
Schools grade is shown separately in the Schools card above.
Census & demographics
- County
- Berkeley County · 85,235 people
- City population
- 13,201
- Metro
- Hagerstown-Martinsburg, MD-WV
- Population (ZIP)
- 16,470
- Household income
- $87,512
- Rent vs Own
- Severe rent burden
- 120.0
Population outlook (Berkeley County) Hauer SSP2
- Today (2025)
- 127,359 people
- By 2030
- 134,684 · +5.8%
- By 2040
- 148,219 · +16.4%
- By 2050
- 159,300 · +25.1%
- By 2075
- 179,920 · +41.3%
- By 2100
- 183,896 · +44.4%
Race, ethnicity, and origin ACS 2023
- Neighborhood character
- Predominantly White (74%)
- Race & ethnicity
- White 74% Hispanic / Latino 10% Black 8% Two or more races 8% Asian 1%
- Hispanic origin (detail)
- Mexican 3%
- Common ancestry
- Italian 2% Romanian 2% Slovak 1%
- Foreign-born
- 6% · Canada, Guatemala, Vietnam
- Languages at home
- 90% English-only · Spanish 6% Vietnamese 1%
Political lean MEDSL · Berkeley
- 2024 margin
- Solid R (+35.8) · D 31.2% · R 67.0% · Other 1.8%
- 2008→2024 swing
- -22.8pp toward R · 2008: -13.0pp · 2024: -35.8pp
- All cycles
- 2024: R+35.8 2020: R+31.2 2016: R+37.2 2012: R+21.3 2008: R+13.0
Not yet ingested
- Civics
- —
Market trends
- HPI YoY
- ▼ -34.15%
- Current HPI
- 190.9235
- Rent YoY
- —
- Metro
- Hagerstown-Martinsburg, MD-WV
- State GDP YoY
- —
- F500 in state
- 0
Price history
1 event — show timeline
- 2025-12-30 Listed $65,000 ForSaleByOwner.com
Cash-flow waterfall
monthlySold comps — $/sqft
last 12 mo · ≤1 miLoading sold comps…