806 Nys Route 22 · Westport, NY
Flood risk 1/10 · Minimal
- FEMA flood zone
- X
- Chance of flooding over 30 yrs
- 0.0%
- Est. flood insurance / yr
- $473 – $860
Fire risk 3/10 · Minor
- Est. fire insurance / yr
- $691 – $1,283
Heat risk 3/10 · Minor
- Hot days now (above 95°F)
- 7 days/yr
- Hot days in 30 yrs
- 15 days/yr
Wind risk 1/10 · Minimal
- Chance of severe wind over 30 yrs
- 1.0%
Air-quality risk 2/10 · Minimal
- Unhealthy air days now
- 1 days/yr
- Unhealthy air days in 30 yrs
- 1 days/yr
Risk factors via First Street. Map © Google.
Why this score? — see what drove the B- grade
The composite is a weighted blend of 9 inputs, each scored 0–100. Each bar is that input's sub-score; the figure is the points it added to the 100-point composite (weight × sub-score).
- Cash flow +20.4/30.0
- ARV discount +15.0/15.0
- Appreciation +8.1/10.0
- DSCR +6.5/10.0
- 1% rule +5.9/10.0
- Schools +5.0/10.0
- Livability +3.2/5.0
- Rent growth +2.5/5.0
- Condition / age +2.5/5.0
$135,000
🖨 Deal sheet (PDF) 📄 Offer letter ✓ Due diligence
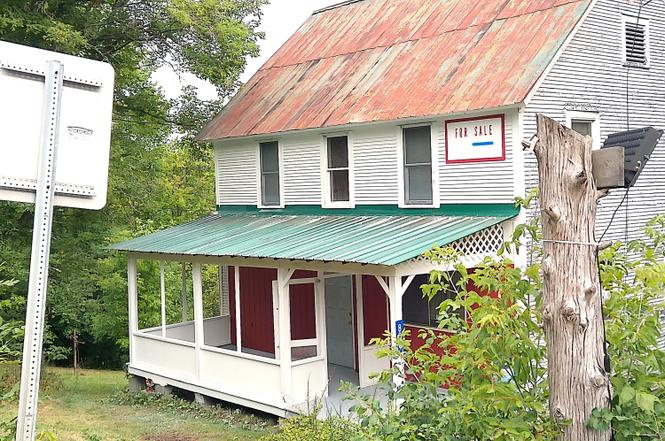
Listing remarks
Part of our Heritage Collection. Fixer-Upper Opportunity in Historic Wadhams, NY. This 5-bedroom, 2-bathroom center hall Colonial built in 1900 sits on a beautiful half-acre lot with a one car detached garage in the charming hamlet of Wadhams, NY. Perfect for a handyman, investor, or house flipper. It is perfectly livable, so you can renovate a room at a time, if you wish. The home has a newer oil hot water boiler and a 2 year old oil tank, plus a hot air wood furnace. The foundation is rock solid, and it has municipal water and sewer. The home offers a classic layout with spacious rooms and great bones. The exterior and interior needs paint, including on the good metal roof, and the interi
Key facts
- Formal dining room
- Two covered porches
- Spacious living room
Tags
Property features AI
Exterior
- Parking: Total of 7 parking spaces; Attached garage (faces rear) with workshop — 1 garage space; On-site open parking pad with 6 open spaces
- Security: Smoke detectors; Carbon monoxide detectors
- Utilities: Public water; Public sewer; Electricity connected with 200+ amp service and circuit breakers
- Home design: Single-family house; Two levels; Property listed as fixer condition
- Construction: Clapboard frame construction with batt insulation; Metal roof; Block and stone foundation; Built above grade with finished area
- Exterior features: Multiple covered porches (front, rear, side) including a screened porch; Sloped, mostly private lot with few trees; State road frontage on paved/asphalt road; Has view
Interior
- Kitchen: Gas range; Oven; Dishwasher; Refrigerator; Electric water heater
- Bedrooms: One main-level bedroom
- Flooring: Hardwood; Carpet; Linoleum; Combination flooring
- Bathrooms: Two full bathrooms (one on the main level)
- Heating & cooling: Baseboard heating; Hot water heating; Wood heating; No central cooling
- Interior features: Laminate counters; Built-in storage; Double-pane windows with wood frames
- Laundry & utility: Washer and dryer included; Laundry in basement; Full, unfinished basement with interior and exterior entry (concrete)
Neighborhood map
What this means for you Summary
Snapshot
- This is a 5-bed/2.0-bath single-family listed at $135k.
Deal economics
- At list price, monthly cash flow is $175 ($2k/yr) — positive.
- The deal already cash-flows at list — no discount required.
- Meets the 1% rule at list price ($1k rent vs $135k).
- Recommended offer: $119k (12.0% below list) — sets the bar for market timing.
Location & tenants
- Location reads 64/100 on livability (#777 in NY) — a middle-class / working-renter tenant base. Strengths: cost of living A+, housing A+; Watch: employment C-, crime D-, amenities F.
- Market conditions: 19 active listings in the ZIP; 218 units permitted in Essex County in 2024 (63 in 5+ unit buildings).
Forward outlook
- In year one you build about $9k of equity ($933 loan paydown + $8k appreciation (6.2% local appreciation)).
- Essex County population projected at -20% by 2050 — secular population decline; favor cash flow + early exit over multi-decade hold.
- At projected returns (6.2% appreciation + 3.0% rent growth), your $38k cash investment doubles in ~4 years — after that, you're playing with house money.
- By year 4, paydown + projected appreciation supports a ~$32k cash-out refi (75% LTV) — recoverable capital for the next deal without selling this one.
Negotiation context
- It's been on market 363 days — a 12% lower offer ($119k) is reasonable based on typical stale-listing flexibility.
- Current owner paid $45k; list at $135k implies a 200% gain — meaningful room to come down on a strong offer.
Risks & watch-outs
- Watch-outs: built in 1900 — expect roof / HVAC / electrical / plumbing capex.
Questions for the listing agent
- It's been on market 363 days. Have you received any prior offers? Is the seller open to a 12% concession, seller financing, or rate buy-down credit?
- Built in 1900 — when were the roof, HVAC, electrical panel, plumbing, and water heater last replaced?
- Why hasn't it sold? Are there any deal-killer items the seller is aware of (foundation, flood, title, zoning, code violations)?
- Is there a deadline driving the sale (1031 exchange, divorce, estate, relocation)? That informs how much negotiation room exists.
- Crime grade is D in this area — have there been break-ins, vandalism, or insurance claims at this property in the last 3 years? What carrier currently insures it and at what premium?
- What's the average days-on-market for RENTAL listings here right now (not sales)? A rising rental-DOM trend means longer vacancies and softer asking-rent achievability than the comps imply.
- What's the recent tenant-quality profile in this submarket — average credit score on applications, eviction rate, late-payment / NSF rate, and stable-employment percentage? A property-management company in the area should have these aggregated.
- How much new for-sale + rental construction is in the pipeline within 1–3 miles? Heavy new supply typically softens prices + rents 12–24 months out; constrained supply supports both.
Investment metrics
- 1% rule
- 1.09% ✓
- Cap rate
- 7.85%
- Cash-on-cash
- 5.57%
- DSCR
- 1.25
- GRM
- 7.7
CMA / ARV
- ARV (on-the-fly)
- $178,752
- Comps found
- 1
Show comp detail 1 sale within ~0.75 mi
| Address | Dist | Beds/Ba | Sqft | Sold | Price | $/sf | Match |
|---|---|---|---|---|---|---|---|
| 24 Decker Rd | 0.20mi | 5/2.5 | 2,052 (-4%) | 15mo | $173,040 | $84 | 70 |
Match score weights: distance 35% · size 25% · config 20% · recency 20%. Top-matched comps best support the ARV.
Projected returns pro-forma
6.25% appreciation · 3.0% rent growth · sell at horizon
- IRR
- 20.5%
- Equity multiple
- 2.38×
- Total profit
- $52,207
- Equity at exit
- $87,001
- IRR
- 19.6%
- Equity multiple
- 4.82×
- Total profit
- $144,422
- Equity at exit
- $159,647
Cash invested: $37,800 (down + closing). Projections, not guarantees.
Landlord ↔ Tenant lean methodology
- Overall (STATE)
- 15 Strongly Tenant-Friendly
- State New York
- 15 Strongly Tenant-Friendly · D+10
- County
- — inherits STATE
- City
- — inherits STATE
ZIP-level market 12993
- Home prices YoY
- 2.0%
- Active inventory
- 19
- Price-to-rent
- 7.7×
Monthly cashflow live
- Estimated rent
- $1,469 medium interval (Pro) →
- Mortgage (P&I)
- −$708
- Tax from tax record
- −$221 /mo · $2,649/yr
- Insurance
- −$56
- HOA
- −$0
- Vacancy / Maint / Mgmt
- −$308
- Net cashflow
- $175
Break-even live
Sensitivity live
| Price | -10% $252 | -5% $214 | +0% $175 | +5% $137 | +10% $99 |
|---|---|---|---|---|---|
| Rent | -10% $59 | -5% $117 | +0% $175 | +5% $233 | +10% $291 |
| Rate | -1.0pp $243 | -0.5pp $210 | base $175 | +0.5pp $140 | +1.0pp $105 |
UW: 25.0% down · 7.5% · 30yr · 1.5% tax · 5.0% vac · 8.0% maint · 8.0% mgmt
Financing live
Cash to close
- Down payment
- $33,750
- Closing costs
- $4,050
- Reserves months
- —
- Total cash needed
- —
Loan-product check · same deal, 3 products live
Conventional
25% down · 7.5% · 30yr
- Down + closing
- —
- Monthly P&I
- —
- Monthly cashflow
- —
- DSCR
- —
- Eligible?
- —
Personal DTI + credit; lowest rate.
DSCR
20% down · 8.5% · 30yr
- Down + closing
- —
- Monthly P&I
- —
- Monthly cashflow
- —
- DSCR
- —
- Eligible?
- —
No personal income docs; deal must DSCR.
Hard money
10% down · 12.0% · 12mo
- Down + closing
- —
- Monthly P&I
- —
- Monthly cashflow
- —
- DSCR
- —
- Eligible?
- —
Short-term bridge; refi at stabilization.
Listing history 20 events
-
2026-06-21statusdays on market $135,000 Pending 363 DOM
-
2026-06-18days on market $135,000 Active 361 DOM
-
2026-06-17days on market $135,000 Active 360 DOM
-
2026-06-16days on market $135,000 Active 359 DOM
-
2026-06-15days on market $135,000 Active 358 DOM
-
2026-06-13days on market $135,000 Active 356 DOM
-
2026-06-12days on market $135,000 Active 355 DOM
-
2026-06-09days on market $135,000 Active 352 DOM
-
2026-06-08days on market $135,000 Active 351 DOM
-
2026-06-07days on market $135,000 Active 350 DOM
-
2026-06-07days on market $135,000 Active 349 DOM
-
2026-06-04days on market $135,000 Active 346 DOM
-
2026-06-02days on market $135,000 Active 345 DOM
-
2026-06-01days on market $135,000 Active 344 DOM
-
2026-05-31days on market $135,000 Active 343 DOM
-
2025-08-20price $135,000
-
2025-06-22$145,000 Active
-
2024-09-19price $145,000
-
2005-10-17soldstatus $45,000
-
1997-08-21soldstatus $41,500
ⓘ Source: listings_history table (triggers on properties + properties_extension) + one-shot
backfill from property_details.listing_events for pre-trigger history.
Tax reassessment forecast NY · Partial reset (capped growth)
- Current annual tax
- $2,649 · $221/mo
- Projected year-2 tax
- $2,649 · $221/mo
- Expected delta
- $0/yr ($0/mo · 0.0%)
ⓘ Screening estimate from a state-policy table — verify with the county assessor before closing.
Climate risk First Street
- Flood 1/10 Low FEMA zone X · 0% chance over 30 yrs
- Wildfire 3/10 Moderate
- Heat 3/10 Moderate 7 d/yr ≥95°F today · 15 d/yr by 30 yrs out
- Wind 1/10 Low 100% chance of damaging wind over 30 yrs
- Air quality 2/10 Low 1 unhealthy d/yr today · 1 by 30 yrs out
Nearby sold comps map
Loading sold comps map…
Walkable amenities ~0.75 mi
Loading nearby amenities…
Taxation est. · year 1
- Rental income
- $17,625
- − Mortgage interest
- −$7,562
- − Property taxes
- −$2,649
- − Insurance
- −$675
- − Repairs & maintenance
- −$1,410
- − Management
- −$1,410
- − Depreciation
- −$3,927
- Taxable loss
- −$8
- Est. tax savings @ 24.0%
- +$2
- After-tax cash flow
- $2,106/yr
For passive investors: Depreciation is non-cash, so a rental often shows a tax loss while cash-flowing — sheltering income. Rental losses are passive: they offset passive income freely, and up to $25,000/yr can offset ordinary (W-2) income if you actively participate and your MAGI is under $100k (phasing out to $0 by $150k); unused losses carry forward. On sale, claimed depreciation is recaptured at up to 25%, and gains may owe capital-gains tax (a 1031 exchange can defer both). Figures are a year-1 estimate at your 24.0% rate — not tax advice; consult a CPA.
Schools (NCES district)
No district data.
Livability — Westport
- Score
- 64/100
- State rank
- #777
- US rank
- #14817
Category grades
Schools grade is shown separately in the Schools card above.
Census & demographics
- Population (ZIP)
- 1,730
Population outlook (Essex County) Hauer SSP2
- Today (2025)
- 36,758 people
- By 2030
- 35,697 · -2.9%
- By 2040
- 32,697 · -11.0%
- By 2050
- 29,248 · -20.4%
- By 2075
- 22,641 · -38.4%
- By 2100
- 16,602 · -54.8%
Race, ethnicity, and origin ACS 2023
- Neighborhood character
- Predominantly White (96%)
- Race & ethnicity
- White 96% Two or more races 3%
- Common ancestry
- Lithuanian 9% Serbian 8% Slovak 5%
- Foreign-born
- 2% · Canada
- Languages at home
- 99% English-only · Spanish 1%
Political lean MEDSL · Essex
- 2024 margin
- Toss-up / Even · D 50.2% · R 49.8%
- 2008→2024 swing
- -12.8pp toward R · 2008: 13.3pp · 2024: 0.5pp
- All cycles
- 2024: D+0.5 2020: D+5.0 2016: R+3.4 2012: D+15.0 2008: D+13.3
Not yet ingested
- Civics
- —
Market trends
- HPI YoY
- ▲ 6.25%
- Current HPI
- 322.8909
- Rent YoY
- —
- Metro
- —
- State GDP YoY
- ▲ 2.60%
- F500 in state
- 92
Industry mix (Fortune 500 HQ in NY)
| Industry | F500 HQs | Revenue |
|---|---|---|
| Financial Services | 10 | $950B |
|
||
| Consumer Goods | 9 | $162B |
|
||
| Insurance | 4 | $225B |
|
||
| Telecommunications | 2 | $144B |
|
||
| Pharmaceuticals | 2 | $112B |
|
||
| Media / Entertainment | 2 | $69B |
|
||
Price history
+225.3% since first listed5 events — show timeline
- 2025-08-20 Price Changed $135,000 ACVMLS
- 2025-06-22 Listed $145,000 ACVMLS
- 2024-09-19 Price Changed $145,000 ACVMLS
- 2005-10-17 Sold (Public Records) $45,000 Public Records
- 1997-08-21 Sold (Public Records) $41,500 Public Records
Property tax history
+2.4%/yrLatest (2025): $2,649 · +2.4% YoY. Source: county tax records.
Cash-flow waterfall
monthlySold comps — $/sqft
last 12 mo · ≤1 miLoading sold comps…