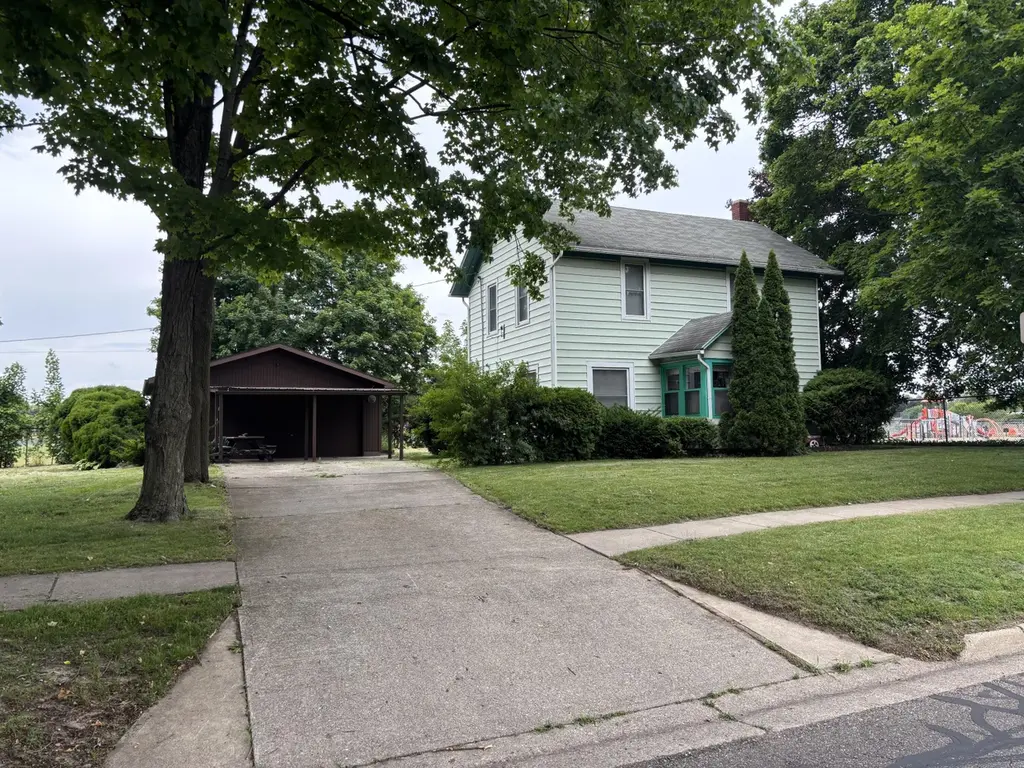
600 E Lafayette St · Sturgis, MI
Flood risk 1/10 · Minimal
- FEMA flood zone
- X (unshaded)
- Chance of flooding over 30 yrs
- 0.0%
- Est. flood insurance / yr
- $473 – $860
Fire risk 1/10 · Minimal
- Est. fire insurance / yr
- $784 – $1,456
Heat risk 2/10 · Minimal
- Hot days now (above 99°F)
- 7 days/yr
- Hot days in 30 yrs
- 16 days/yr
Wind risk 2/10 · Minimal
- Chance of severe wind over 30 yrs
- —
Air-quality risk 2/10 · Minimal
- Unhealthy air days now
- 1 days/yr
- Unhealthy air days in 30 yrs
- 2 days/yr
Risk factors via First Street. Map © Google.
Why this score? — see what drove the C- grade
The composite is a weighted blend of 9 inputs, each scored 0–100. Each bar is that input's sub-score; the figure is the points it added to the 100-point composite (weight × sub-score).
- Cash flow +17.3/30.0
- ARV discount +14.1/15.0
- DSCR +5.4/10.0
- 1% rule +4.0/10.0
- Livability +3.7/5.0
- Rent growth +2.5/5.0
- Condition / age +2.5/5.0
- Schools +2.2/10.0
- Appreciation +0.0/10.0
$147,000
🖨 Deal sheet (PDF) 📄 Offer letter ✓ Due diligence
Listing remarks MLS
3 bedroom, 2 bath home, located in a desirable neighborhood in the city of Sturgis. The home is located next door to wall elementary school (Which has fields, playgrounds, etc. ). Many amenities include: a spacious yard of . 72 acres. A 2 car garage and a 1 car garage as well as an oversized storge shed. The large garage has a workshop as well. Vinyl siding, replacement windows throughout, front porch, concrete driveways. The interior offers a spacious kitchen, 2 living rooms (1 upstairs, 1 on the main floor), a main floor primary bedroom. The interior of the home needs some updating but the home seems to have really solid bones and is priced to sell quickly. The basement is a large DRY Michigan basement. It is not known at this time if upstairs bath is in working order, selller will not be making repairs. Set up your personal tour today!
Key facts
- Spacious yard
- Vinyl siding
- Workshop
Tags
Property features AI
Finance
- Other: Living area approximately 1,451 total building area
- HOA & community: No association fee
Exterior
- Parking: Detached garage; 3-car garage (detached)
- Utilities: Public water; Natural gas available; Electricity available
- Home design: Traditional single-family home; Built in 1940
- Construction: Vinyl siding; Composition roof; Built 1940
- Exterior features: Sidewalk; Shed(s); Paved road access
Interior
- Kitchen: Range
- Bedrooms: Primary bedroom (8 x 16); Bedroom 2 (9 x 15); Bedroom 3 (8 x 14)
- Bathrooms: 2 full bathrooms; Primary bathroom (5 x 9); Second bathroom (8 x 14)
- Heating & cooling: Forced air heating
- Interior features: Eat-in kitchen; Replacement windows; Michigan-style basement; 8 total rooms
- Laundry & utility: Natural gas water heater
Neighborhood map
What this means for you Summary
Snapshot
- This is a 4-bed/1.0-bath single-family listed at $147k.
Deal economics
- At list price, monthly cash flow is $108 ($1k/yr) — positive.
- The deal already cash-flows at list — no discount required.
- To meet the 1% rule (rent ≥ 1% of price), the offer needs to be $132k (10.3% below list).
- Recommended offer: $132k (10.3% below list) — sets the bar for 1% rule.
- Cap rate 7.2% vs local median 4.0% in Sturgis — top-decile yield for the area; either an underpriced asset or a hidden risk that comps aren't pricing in. Stress-test before assuming the spread holds.
Location & tenants
- Location reads 73/100 on livability (#226 in MI) — a middle-class / working-renter tenant base. Strengths: cost of living A+, housing A+, health & safety A+; Watch: crime D-, amenities F, commute F.
- Sturgis Public Schools (town): math 20% / reading 32% proficiency, ranked #413 of 540 in MI (top 76%) — low school quality limits family demand, transient renter base, plan for 1-2y turnover.
- Zoned schools: Eastwood School (math 26% / reading 31%, grade F, #915 of 1,397 statewide, top 66%, 665 students, 71% FRL); Sturgis Middle School (math 13% / reading 30%, grade F, #415 of 493 statewide, top 85%, 643 students, 67% FRL); Sturgis High School (math 22% / reading 42%, grade F, #405 of 713 statewide, top 59%, 993 students, 55% FRL).
- Market conditions: 117 active listings in the ZIP; 125 units permitted in St. Joseph County in 2024 (0 in 5+ unit buildings).
Forward outlook
- Local home prices are declining (-3.0%/yr); year-one equity from $1k of loan paydown is wiped out by about $4k of value loss. Plan a longer hold.
- St. Joseph County population projected at -16% by 2050 — secular population decline; favor cash flow + early exit over multi-decade hold.
Negotiation context
- Only 11 days on market — expect competitive offers; lowballing is unlikely to land.
- 3 sale attempts with the ask held roughly flat each time — persistent listings suggest the price (not the market) is what's stuck; bring a comps-based counter.
Risks & watch-outs
- Watch-outs: built in 1940 — expect roof / HVAC / electrical / plumbing capex.
Questions for the listing agent
- Built in 1940 — when were the roof, HVAC, electrical panel, plumbing, and water heater last replaced?
- Is there a deadline driving the sale (1031 exchange, divorce, estate, relocation)? That informs how much negotiation room exists.
- Schools are D-rated, which usually means shorter tenancies and higher turnover. Who's the typical renter profile here, and what's been the actual vacancy rate?
- Crime grade is D in this area — have there been break-ins, vandalism, or insurance claims at this property in the last 3 years? What carrier currently insures it and at what premium?
- What's the average days-on-market for RENTAL listings here right now (not sales)? A rising rental-DOM trend means longer vacancies and softer asking-rent achievability than the comps imply.
- What's the recent tenant-quality profile in this submarket — average credit score on applications, eviction rate, late-payment / NSF rate, and stable-employment percentage? A property-management company in the area should have these aggregated.
- How much new for-sale + rental construction is in the pipeline within 1–3 miles? Heavy new supply typically softens prices + rents 12–24 months out; constrained supply supports both.
Investment metrics
- 1% rule
- 0.90% ✗
- Cap rate
- 7.17%
- Cash-on-cash
- 3.15%
- DSCR
- 1.14
- GRM
- 9.3
CMA / ARV
- ARV (on-the-fly)
- $172,302
- Comps found
- 12
Show comp detail 12 sales within ~0.75 mi
| Address | Dist | Beds/Ba | Sqft | Sold | Price | $/sf | Match |
|---|---|---|---|---|---|---|---|
| 707 E Jerolene St | 0.19mi | 4/1.0 | 1,277 (+4%) | 8mo | $180,000 | $141 | 77 |
| 505 N 4th St | 0.26mi | 3/1.0 (-1) | 1,260 (+3%) | 3mo | $147,500 | $117 | 75 |
| 519 N Prospect St | 0.17mi | 3/1.0 (-1) | 1,300 (+6%) | 11mo | $65,000 | $50 | 67 |
| 408 N Lakeview Ave | 0.29mi | 3/1.0 (-1) | 1,336 (+9%) | 1mo | $173,000 | $129 | 65 |
| 418 Center Ave | 0.21mi | 3/2.0 (-1) | 1,098 (-10%) | 2mo | $220,000 | $200 | 62 |
| 1016 Greenlawn Dr | 0.56mi | 4/1.5 | 1,248 (+2%) | 9mo | $195,000 | $156 | 61 |
| 805 N Nottawa St | 0.31mi | 3/2.0 (-1) | 1,124 (-8%) | 4mo | $205,000 | $182 | 60 |
| 221 N Lakeview Ave | 0.55mi | 3/1.0 (-1) | 1,236 (+1%) | 10mo | $163,000 | $132 | 59 |
| 517 N Fourth St | 0.20mi | 3/1.0 (-1) | 1,104 (-10%) | 14mo | $150,000 | $136 | 58 |
| 204 Merryview Dr | 0.39mi | 3/1.5 (-1) | 1,114 (-9%) | 6mo | $75,000 | $67 | 55 |
| 201 Ilene St | 0.66mi | 3/1.0 (-1) | 1,160 (-5%) | 2mo | $170,000 | $147 | 54 |
| 908 Meadowlane Dr | 0.47mi | 3/1.0 (-1) | 1,100 (-10%) | 10mo | $182,700 | $166 | 48 |
Match score weights: distance 35% · size 25% · config 20% · recency 20%. Top-matched comps best support the ARV.
Projected returns pro-forma
-3.0% appreciation · 3.0% rent growth · sell at horizon
- IRR
- -11.4%
- Equity multiple
- 0.59×
- Total profit
- $-16,976
- Equity at exit
- $21,918
- IRR
- -2.2%
- Equity multiple
- 0.85×
- Total profit
- $-6,053
- Equity at exit
- $12,710
Cash invested: $41,160 (down + closing). Projections, not guarantees.
Landlord ↔ Tenant lean methodology
- Overall (STATE)
- 62 Landlord-Friendly
- State Michigan
- 62 Landlord-Friendly · EVEN
- County
- — inherits STATE
- City
- — inherits STATE
ZIP-level market 49091
- Active inventory
- 117
- Price-to-rent
- 9.3×
Monthly cashflow live
- Estimated rent
- $1,319 medium interval (Pro) →
- Mortgage (P&I)
- −$771
- Tax from tax record
- −$102 /mo · $1,224/yr
- Insurance
- −$61
- HOA
- −$0
- Vacancy / Maint / Mgmt
- −$277
- Net cashflow
- $108
Break-even live
Sensitivity live
| Price | -10% $191 | -5% $150 | +0% $108 | +5% $66 | +10% $25 |
|---|---|---|---|---|---|
| Rent | -10% $4 | -5% $56 | +0% $108 | +5% $160 | +10% $212 |
| Rate | -1.0pp $182 | -0.5pp $145 | base $108 | +0.5pp $70 | +1.0pp $31 |
UW: 25.0% down · 7.5% · 30yr · 1.5% tax · 5.0% vac · 8.0% maint · 8.0% mgmt
Financing live
Cash to close
- Down payment
- $36,750
- Closing costs
- $4,410
- Reserves months
- —
- Total cash needed
- —
Loan-product check · same deal, 3 products live
Conventional
25% down · 7.5% · 30yr
- Down + closing
- —
- Monthly P&I
- —
- Monthly cashflow
- —
- DSCR
- —
- Eligible?
- —
Personal DTI + credit; lowest rate.
DSCR
20% down · 8.5% · 30yr
- Down + closing
- —
- Monthly P&I
- —
- Monthly cashflow
- —
- DSCR
- —
- Eligible?
- —
No personal income docs; deal must DSCR.
Hard money
10% down · 12.0% · 12mo
- Down + closing
- —
- Monthly P&I
- —
- Monthly cashflow
- —
- DSCR
- —
- Eligible?
- —
Short-term bridge; refi at stabilization.
Listing history 10 events
-
2026-06-22days on market $147,000 Active 11 DOM
-
2026-06-21days on market $147,000 Active 10 DOM
-
2026-06-21days on market $147,000 Active 9 DOM
-
2026-06-18days on market $147,000 Active 7 DOM
-
2026-06-17days on market $147,000 Active 6 DOM
-
2026-06-16days on market $147,000 Active 5 DOM
-
2026-06-16days on market $147,000 Active 4 DOM
-
2026-06-13days on market $147,000 Active 2 DOM
-
2026-06-12remarks 699-char remark
-
2026-06-12$147,000 Active 1 DOM
ⓘ Source: listings_history table (triggers on properties + properties_extension) + one-shot
backfill from property_details.listing_events for pre-trigger history.
Tax reassessment forecast MI · Partial reset (capped growth)
- Current annual tax
- $1,224 · $102/mo
- Projected year-2 tax
- $1,744 · $145/mo
- Expected delta
- +$520/yr (+$43/mo · 42.4%)
ⓘ Screening estimate from a state-policy table — verify with the county assessor before closing.
Climate risk First Street
- Flood 1/10 Low FEMA zone X (unshaded) · 0% chance over 30 yrs
- Wildfire 1/10 Low
- Heat 2/10 Low 7 d/yr ≥99°F today · 16 d/yr by 30 yrs out
- Wind 2/10 Low
- Air quality 2/10 Low 1 unhealthy d/yr today · 2 by 30 yrs out
Nearby sold comps map
Loading sold comps map…
Walkable amenities ~0.75 mi
Loading nearby amenities…
Taxation est. · year 1
- Rental income
- $15,830
- − Mortgage interest
- −$8,234
- − Property taxes
- −$1,224
- − Insurance
- −$735
- − Repairs & maintenance
- −$1,266
- − Management
- −$1,266
- − Depreciation
- −$4,276
- Taxable loss
- −$1,173
- Est. tax savings @ 24.0%
- +$282
- After-tax cash flow
- $1,577/yr
For passive investors: Depreciation is non-cash, so a rental often shows a tax loss while cash-flowing — sheltering income. Rental losses are passive: they offset passive income freely, and up to $25,000/yr can offset ordinary (W-2) income if you actively participate and your MAGI is under $100k (phasing out to $0 by $150k); unused losses carry forward. On sale, claimed depreciation is recaptured at up to 25%, and gains may owe capital-gains tax (a 1031 exchange can defer both). Figures are a year-1 estimate at your 24.0% rate — not tax advice; consult a CPA.
Schools (NCES district)
- District
- Sturgis Public Schools
- NCES district ID
- 2633090
- Math proficiency
- 20% ▼ -4.00%
- Reading proficiency
- 32% ▼ -6.00%
- Median HH income
- $40,702
- Composite
- 21.95/100
- National rank
- #8220
- State rank
- #413 of 540 in MI
Livability — Sturgis
- Score
- 73/100
- State rank
- #226
- US rank
- #5687
Category grades
Schools grade is shown separately in the Schools card above.
Census & demographics
- Census place
- Sturgis, MI
- Population (ZIP)
- 19,448
Population outlook (St. Joseph County) Hauer SSP2
- Today (2025)
- 58,726 people
- By 2030
- 57,030 · -2.9%
- By 2040
- 53,266 · -9.3%
- By 2050
- 49,343 · -16.0%
- By 2075
- 40,441 · -31.1%
- By 2100
- 31,981 · -45.5%
Race, ethnicity, and origin ACS 2023
- Neighborhood character
- Predominantly White (76%)
- Race & ethnicity
- White 76% Hispanic / Latino 18% Two or more races 12% Native American 1%
- Hispanic origin (detail)
- Mexican 18%
- Common ancestry
- Italian 10% Romanian 4% Iranian 2%
- Foreign-born
- 8% · Canada, China
- Languages at home
- 79% English-only · Spanish 16% German/W. Germanic 4%
Political lean MEDSL · St. Joseph
- 2024 margin
- Solid R (+34.0) · D 32.2% · R 66.2% · Other 1.5%
- 2008→2024 swing
- -31.8pp toward R · 2008: -2.2pp · 2024: -34.0pp
- All cycles
- 2024: R+34.0 2020: R+31.7 2016: R+31.0 2012: R+12.3 2008: R+2.2
Not yet ingested
- Civics
- —
Market trends
- HPI YoY
- ▼ -121.64%
- Current HPI
- 205.9474
- Rent YoY
- —
- Metro
- —
- State GDP YoY
- ▲ 1.37%
- F500 in state
- 28
Industry mix (Fortune 500 HQ in MI)
| Industry | F500 HQs | Revenue |
|---|---|---|
| Automotive Parts | 3 | $48B |
|
||
| Automotive | 2 | $372B |
|
||
| Chemicals | 1 | $45B |
|
||
| Automotive Retail | 1 | $29B |
|
||
| Healthcare / Medical Devices | 1 | $23B |
|
||
| Automotive Technology | 1 | $20B |
|
||
Price history
+0.0% since first listed3 events — show timeline
- 2026-06-11 Listed $147,000 MiRealSource-MiMLS
- 2026-06-11 Listed $147,000 REALCOMP
- 2026-06-11 Listed $147,000 SW Michigan MLS
Property tax history
+2.6%/yrLatest (2025): $1,224 · -16.2% YoY. Source: county tax records.
Cash-flow waterfall
monthlySold comps — $/sqft
last 12 mo · ≤1 miLoading sold comps…