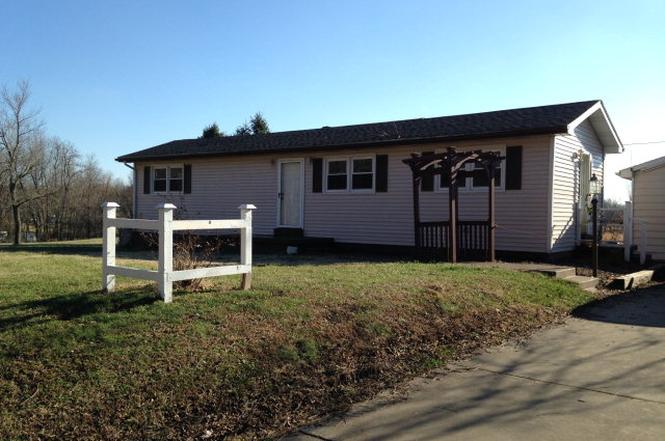
156 E Harmons Ferry Rd · Utica, KY
Flood risk No data
- FEMA flood zone
- —
- Chance of flooding over 30 yrs
- —
- Est. flood insurance / yr
- —
Fire risk No data
- Est. fire insurance / yr
- —
Heat risk No data
- Hot days now (above threshold)
- —
- Hot days in 30 yrs
- —
Wind risk No data
- Chance of severe wind over 30 yrs
- —
Air-quality risk No data
- Unhealthy air days now
- —
- Unhealthy air days in 30 yrs
- —
Risk factors via First Street. Map © Google.
Why this score? — see what drove the B grade
The composite is a weighted blend of 9 inputs, each scored 0–100. Each bar is that input's sub-score; the figure is the points it added to the 100-point composite (weight × sub-score).
- Cash flow +30.0/30.0
- ARV discount +15.0/15.0
- DSCR +10.0/10.0
- 1% rule +8.2/10.0
- Schools +3.2/10.0
- Livability +3.0/5.0
- Rent growth +2.5/5.0
- Condition / age +2.5/5.0
- Appreciation +0.0/10.0
$129,000
🖨 Deal sheet (PDF) 📄 Offer letter ✓ Due diligence
Listing remarks MLS
NOT A MOBILE HOME! Affordable country living in Liva, KY! 1.55 acres right on Daviess/McLean County line. Newer roof, HVAC, windows, carpet. 2 decks, 1 car detached garage plus out buildings. Great garden area too! Minutes from gas station and Dollar Store! Plat on file. Occupied - call for an appointment to see inside.
Key facts
- Storage building
- Detached garage
- 1.55 acre lot
Tags
Property features AI
Exterior
- Parking: Gravel parking
- Utilities: Septic tank sewer
- Home design: Single family residential property
- Construction: Vinyl siding; Built with standard foundation
- Exterior features: Outbuilding; Shingle roof
Interior
- Kitchen: Dishwasher; Microwave
- Flooring: Carpet; Laminate; Tile; Vinyl
- Bathrooms: 2 full bathrooms
- Heating & cooling: Floor furnace heating; Electric heating; Central air conditioning
- Interior features: Dishwasher; Microwave; Electric water heater
- Laundry & utility: Electric water heater
Neighborhood map
What this means for you Summary
Snapshot
- This is a 2-bed/1.0-bath single-family listed at $129k.
Deal economics
- At list price, monthly cash flow is $490 ($6k/yr) — positive.
- The deal already cash-flows at list — no discount required.
- Meets the 1% rule at list price ($2k rent vs $129k).
- Recommended offer: $117k (9.0% below list) — sets the bar for market timing.
Location & tenants
- Location reads 60/100 on livability (#400 in KY) — a middle-class / working-renter tenant base. Strengths: cost of living A+, crime A, schools B; Watch: amenities F, commute F, health & safety F.
- Daviess County (suburban): math 33% / reading 41% proficiency, ranked #43 of 165 in KY (top 26%) — families likely to look elsewhere, expect single-tenant / working-renter base with shorter leases.
- Market conditions: 52 active listings in the ZIP; 226 units permitted in Daviess County in 2024 (6 in 5+ unit buildings).
Forward outlook
- Local home prices are declining (-3.0%/yr); year-one equity from $892 of loan paydown is wiped out by about $4k of value loss. Plan a longer hold.
- Daviess County population projected at +6% by 2050 — modest demand growth; plan on rents tracking national, not racing it.
- At projected returns (-3.0% appreciation + 3.0% rent growth), your $36k cash investment doubles in ~8 years — after that, you're playing with house money.
Negotiation context
- It's been on market 91 days — a 9% lower offer ($117k) is reasonable based on typical stale-listing flexibility.
- 4 sale attempts since 13y ago; this cycle's ask has dropped $20k (13%) from the opening price — seller is motivated, your offer sets the floor, not the list.
Questions for the listing agent
- It's been on market 91 days. Have you received any prior offers? Is the seller open to a 9% concession, seller financing, or rate buy-down credit?
- Built in 1976 — when were the roof, HVAC, electrical panel, plumbing, and water heater last replaced?
- Why hasn't it sold? Are there any deal-killer items the seller is aware of (foundation, flood, title, zoning, code violations)?
- Is there a deadline driving the sale (1031 exchange, divorce, estate, relocation)? That informs how much negotiation room exists.
- Schools are B-rated — typically a magnet for longer-tenancy family renters. What's the average tenant stay here, and is there a school-zone premium baked into asking?
- What's the average days-on-market for RENTAL listings here right now (not sales)? A rising rental-DOM trend means longer vacancies and softer asking-rent achievability than the comps imply.
- What's the recent tenant-quality profile in this submarket — average credit score on applications, eviction rate, late-payment / NSF rate, and stable-employment percentage? A property-management company in the area should have these aggregated.
- How much new for-sale + rental construction is in the pipeline within 1–3 miles? Heavy new supply typically softens prices + rents 12–24 months out; constrained supply supports both.
Investment metrics
- 1% rule
- 1.32% ✓
- Cap rate
- 10.85%
- Cash-on-cash
- 16.27%
- DSCR
- 1.72
- GRM
- 6.3
CMA / ARV
- ARV (on-the-fly)
- $255,816
- Comps found
- 1
Show comp detail 1 sale within ~0.75 mi
| Address | Dist | Beds/Ba | Sqft | Sold | Price | $/sf | Match |
|---|---|---|---|---|---|---|---|
| 185 E Harmons Ferry Rd | 0.09mi | 3/1.0 (+1) | 1,232 (-5%) | 2mo | $243,900 | $198 | 82 |
Match score weights: distance 35% · size 25% · config 20% · recency 20%. Top-matched comps best support the ARV.
Projected returns pro-forma
-3.0% appreciation · 3.0% rent growth · sell at horizon
- IRR
- 7.3%
- Equity multiple
- 1.28×
- Total profit
- $10,293
- Equity at exit
- $19,234
- IRR
- 16.6%
- Equity multiple
- 2.36×
- Total profit
- $49,145
- Equity at exit
- $11,154
Cash invested: $36,120 (down + closing). Projections, not guarantees.
Landlord ↔ Tenant lean methodology
- Overall (STATE)
- 83 Strongly Landlord-Friendly
- State Kentucky
- 83 Strongly Landlord-Friendly · R+16
- County
- — inherits STATE
- City
- — inherits STATE
ZIP-level market 42376
- Home prices YoY
- -24.9%
- Active inventory
- 52
- Price-to-rent
- 6.3×
Monthly cashflow live
- Estimated rent
- $1,704 medium interval (Pro) →
- Mortgage (P&I)
- −$676
- Tax from tax record
- −$126 /mo · $1,516/yr
- Insurance
- −$54
- HOA
- −$0
- Vacancy / Maint / Mgmt
- −$358
- Net cashflow
- $490
Break-even live
Sensitivity live
| Price | -10% $563 | -5% $526 | +0% $490 | +5% $453 | +10% $417 |
|---|---|---|---|---|---|
| Rent | -10% $355 | -5% $422 | +0% $490 | +5% $557 | +10% $624 |
| Rate | -1.0pp $555 | -0.5pp $523 | base $490 | +0.5pp $456 | +1.0pp $422 |
UW: 25.0% down · 7.5% · 30yr · 1.5% tax · 5.0% vac · 8.0% maint · 8.0% mgmt
Financing live
Cash to close
- Down payment
- $32,250
- Closing costs
- $3,870
- Reserves months
- —
- Total cash needed
- —
Loan-product check · same deal, 3 products live
Conventional
25% down · 7.5% · 30yr
- Down + closing
- —
- Monthly P&I
- —
- Monthly cashflow
- —
- DSCR
- —
- Eligible?
- —
Personal DTI + credit; lowest rate.
DSCR
20% down · 8.5% · 30yr
- Down + closing
- —
- Monthly P&I
- —
- Monthly cashflow
- —
- DSCR
- —
- Eligible?
- —
No personal income docs; deal must DSCR.
Hard money
10% down · 12.0% · 12mo
- Down + closing
- —
- Monthly P&I
- —
- Monthly cashflow
- —
- DSCR
- —
- Eligible?
- —
Short-term bridge; refi at stabilization.
Listing history 25 events
-
2026-06-10days on market $129,000 Active 91 DOM
-
2026-06-09days on market $129,000 Active 90 DOM
-
2026-06-08days on market $129,000 Active 89 DOM
-
2026-06-07days on market $129,000 Active 88 DOM
-
2026-06-05days on market $129,000 Active 85 DOM
-
2026-06-03days on market $129,000 Active 84 DOM
-
2026-06-02days on market $129,000 Active 83 DOM
-
2026-06-01days on market $129,000 Active 82 DOM
-
2026-05-31days on market $129,000 Active 81 DOM
-
2026-05-30days on market $129,000 Active 80 DOM
-
2026-04-28price $129,000
-
2026-04-23price $141,500
-
2026-04-15status Active
-
2026-04-08historical Active Under Contract
-
2026-03-23price $144,000
-
2026-03-11$149,000 Active
-
2025-01-17soldstatus $398,800
-
2024-08-19soldstatus $140,000
-
2016-03-07soldstatus $59,000 321-char remark
Show marketing remark (321 chars)
NOT A MOBILE HOME! Affordable country living in Liva, KY! 1.55 acres right on Daviess/McLean County line. Newer roof, HVAC, windows, carpet. 2 decks, 1 car detached garage plus out buildings. Great garden area too! Minutes from gas station and Dollar Store! Plat on file. Occupied - call for an appointment to see inside.
-
2016-01-13$69,900 321-char remark
Show marketing remark (321 chars)
NOT A MOBILE HOME! Affordable country living in Liva, KY! 1.55 acres right on Daviess/McLean County line. Newer roof, HVAC, windows, carpet. 2 decks, 1 car detached garage plus out buildings. Great garden area too! Minutes from gas station and Dollar Store! Plat on file. Occupied - call for an appointment to see inside.
-
2013-06-25soldstatus $37,000
-
2013-06-24soldstatus $37,000 271-char remark
Show marketing remark (271 chars)
A real deal! 2 lots, 1.5 acres. Needs some work. 3 out buildings include 1 car det. garage. Right off hwy 431, behind the old Barmet land. Sits gently on a hill. Garden area, newer roof and CA and Heat. McClean county but on Daviess County line. Private see no neighbors.
-
2013-05-20$39,900 271-char remark
Show marketing remark (271 chars)
A real deal! 2 lots, 1.5 acres. Needs some work. 3 out buildings include 1 car det. garage. Right off hwy 431, behind the old Barmet land. Sits gently on a hill. Garden area, newer roof and CA and Heat. McClean county but on Daviess County line. Private see no neighbors.
-
1997-05-01soldstatus $47,500
-
1993-06-01soldstatus $43,755
ⓘ Source: listings_history table (triggers on properties + properties_extension) + one-shot
backfill from property_details.listing_events for pre-trigger history.
Tax reassessment forecast KY · Resets to sale price
- Current annual tax
- $1,516 · $126/mo
- Projected year-2 tax
- $1,516 · $126/mo
- Expected delta
- $0/yr ($0/mo · 0.0%)
ⓘ Screening estimate from a state-policy table — verify with the county assessor before closing.
Nearby sold comps map
Loading sold comps map…
Walkable amenities ~0.75 mi
Loading nearby amenities…
Taxation est. · year 1
- Rental income
- $20,451
- − Mortgage interest
- −$7,226
- − Property taxes
- −$1,516
- − Insurance
- −$645
- − Repairs & maintenance
- −$1,636
- − Management
- −$1,636
- − Depreciation
- −$3,753
- Taxable income
- $4,039
- Est. tax owed @ 24.0%
- −$969
- After-tax cash flow
- $4,908/yr
For passive investors: Depreciation is non-cash, so a rental often shows a tax loss while cash-flowing — sheltering income. Rental losses are passive: they offset passive income freely, and up to $25,000/yr can offset ordinary (W-2) income if you actively participate and your MAGI is under $100k (phasing out to $0 by $150k); unused losses carry forward. On sale, claimed depreciation is recaptured at up to 25%, and gains may owe capital-gains tax (a 1031 exchange can defer both). Figures are a year-1 estimate at your 24.0% rate — not tax advice; consult a CPA.
Schools (NCES district)
- District
- Daviess County
- NCES district ID
- 2101470
- Math proficiency
- 33% ▼ -17.00%
- Reading proficiency
- 41% ▼ -16.00%
- Median HH income
- $52,303
- Composite
- 32.2/100
- National rank
- #5778
- State rank
- #43 of 165 in KY
Livability — Utica
- Score
- 60/100
- State rank
- #400
- US rank
- #19155
Category grades
Schools grade is shown separately in the Schools card above.
Census & demographics
- Population (ZIP)
- 6,800
Population outlook (Daviess County) Hauer SSP2
- Today (2025)
- 103,810 people
- By 2030
- 105,722 · +1.8%
- By 2040
- 108,731 · +4.7%
- By 2050
- 110,295 · +6.2%
- By 2075
- 113,056 · +8.9%
- By 2100
- 106,257 · +2.4%
Race, ethnicity, and origin ACS 2023
- Neighborhood character
- Predominantly White (95%)
- Race & ethnicity
- White 95% Hispanic / Latino 2% Two or more races 2%
- Common ancestry
- Slovak 1% Serbian 1%
- Foreign-born
- 1% · Canada, South Korea
Political lean MEDSL · Daviess
- 2024 margin
- Solid R (+31.9) · D 33.3% · R 65.2% · Other 1.5%
- 2008→2024 swing
- -21.8pp toward R · 2008: -10.1pp · 2024: -31.9pp
- All cycles
- 2024: R+31.9 2020: R+27.9 2016: R+32.2 2012: R+21.1 2008: R+10.1
Not yet ingested
- Civics
- —
Market trends
- HPI YoY
- ▼ -76.02%
- Current HPI
- 229.5493
- Rent YoY
- —
- Metro
- —
- State GDP YoY
- ▲ 1.81%
- F500 in state
- 4
Industry mix (Fortune 500 HQ in KY)
| Industry | F500 HQs | Revenue |
|---|---|---|
| Healthcare | 1 | $118B |
|
||
| Food / Beverage | 1 | $7B |
|
||
Price history
+194.8% since first listed15 events — show timeline
- 2026-04-28 Price Changed $129,000 RASKMLS
- 2026-04-23 Price Changed $141,500 RASKMLS
- 2026-04-15 Relisted — RASKMLS
- 2026-04-08 Contingent — RASKMLS
- 2026-03-23 Price Changed $144,000 RASKMLS
- 2026-03-11 Listed $149,000 RASKMLS
- 2025-01-17 Sold (Public Records) $398,800 Public Records
- 2024-08-19 Sold (Public Records) $140,000 Public Records
- 2016-03-07 Sold (MLS) $59,000 GORAMLS
- 2016-01-13 Listed $69,900 GORAMLS
- 2013-06-25 Sold (Public Records) $37,000 Public Records
- 2013-06-24 Sold (MLS) $37,000 GORAMLS
- 2013-05-20 Listed $39,900 GORAMLS
- 1997-05-01 Sold (Public Records) $47,500 Public Records
- 1993-06-01 Sold (Public Records) $43,755 Public Records
Property tax history
+9.4%/yrLatest (2025): $1,516 · +105.2% YoY. Source: county tax records.
Cash-flow waterfall
monthlySold comps — $/sqft
last 12 mo · ≤1 miLoading sold comps…