1515 W Logan St · Bellwood, PA
Flood risk 1/10 · Minimal
- FEMA flood zone
- X (unshaded)
- Chance of flooding over 30 yrs
- 0.0%
- Est. flood insurance / yr
- $507 – $1,088
Fire risk 3/10 · Minor
- Est. fire insurance / yr
- $511 – $949
Heat risk 3/10 · Minor
- Hot days now (above 92°F)
- 7 days/yr
- Hot days in 30 yrs
- 18 days/yr
Wind risk 2/10 · Minimal
- Chance of severe wind over 30 yrs
- —
Air-quality risk 2/10 · Minimal
- Unhealthy air days now
- 1 days/yr
- Unhealthy air days in 30 yrs
- 3 days/yr
Risk factors via First Street. Map © Google.
Why this score? — see what drove the B- grade
The composite is a weighted blend of 9 inputs, each scored 0–100. Each bar is that input's sub-score; the figure is the points it added to the 100-point composite (weight × sub-score).
- Cash flow +22.6/30.0
- ARV discount +15.0/15.0
- DSCR +7.2/10.0
- 1% rule +5.9/10.0
- Appreciation +4.8/10.0
- Schools +4.1/10.0
- Livability +3.5/5.0
- Rent growth +2.5/5.0
- Condition / age +2.5/5.0
$99,900
🖨 Deal sheet (PDF) 📄 Offer letter ✓ Due diligence
Listing remarks MLS
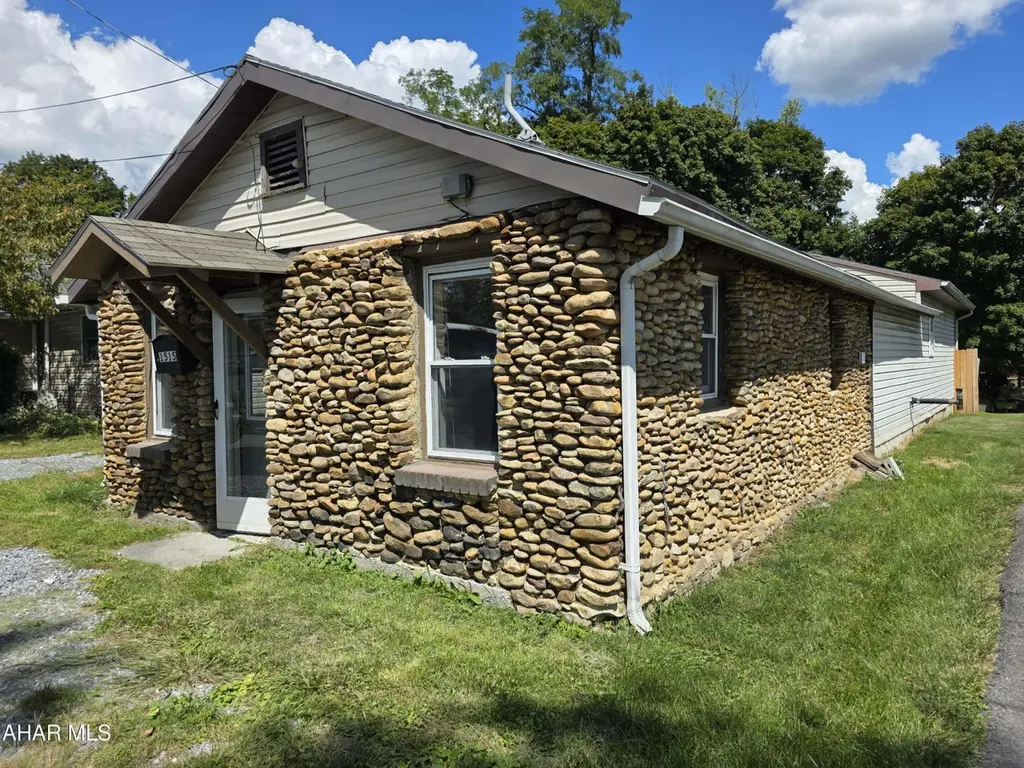
Stone-front ranch with fenced yard! This home features a distinctive stone exterior and a fenced backyard with patio, fire pit, and storage shed. Inside, you'll find a spacious kitchen with painted cabinetry and plenty of counter space, along with two bedrooms and a full bath. Off-street parking is available along the side drive. The property does need some work but offers great potential for the right buyer.
Key facts
- Spacious kitchen
- Storage shed
- Fire pit
Tags
Neighborhood map
What this means for you Summary
Snapshot
- This is a 2-bed/1.0-bath single-family listed at $100k.
Deal economics
- At list price, monthly cash flow is $170 ($2k/yr) — positive.
- The deal already cash-flows at list — no discount required.
- Meets the 1% rule at list price ($1k rent vs $100k).
- Recommended offer: $94k (6.0% below list) — sets the bar for market timing.
Location & tenants
- Location reads 70/100 on livability (#737 in PA) — a middle-class / working-renter tenant base. Strengths: crime A+, cost of living A+, housing A+; Watch: amenities F, commute F, employment F.
- Bellwood-Antis SD (suburban): math 36% / reading 58% proficiency, ranked #224 of 539 in PA (top 42%) — families likely to look elsewhere, expect single-tenant / working-renter base with shorter leases.
- Zoned schools: Lewis M Myers El Sch (math 42% / reading 62%, grade C-, #586 of 1,518 statewide, top 42%, 400 students, 42% FRL); Bellwood Antis Ms (math 27% / reading 56%, grade F, #234 of 512 statewide, top 47%, 371 students, 43% FRL); Bellwood-Antis Hs (math 84%, 392 students, 32% FRL).
- Market conditions: 10 active listings in the ZIP; 99 units permitted in Blair County in 2024 (0 in 5+ unit buildings).
Forward outlook
- In year one you build about $348 of equity ($691 loan paydown + $-343 appreciation (-0.3% local appreciation)).
- Blair County population projected at -18% by 2050 — secular population decline; favor cash flow + early exit over multi-decade hold.
- At projected returns (-0.3% appreciation + 3.0% rent growth), your $28k cash investment doubles in ~8 years — after that, you're playing with house money.
Negotiation context
- It's been on market 69 days — a 6% lower offer ($94k) is reasonable based on typical stale-listing flexibility.
- 4 sale attempts since 19y ago with the ask held roughly flat each time — persistent listings suggest the price (not the market) is what's stuck; bring a comps-based counter.
Risks & watch-outs
- Watch-outs: built in 1916 — expect roof / HVAC / electrical / plumbing capex.
Questions for the listing agent
- It's been on market 69 days. Have you received any prior offers? Is the seller open to a 6% concession, seller financing, or rate buy-down credit?
- Built in 1916 — when were the roof, HVAC, electrical panel, plumbing, and water heater last replaced?
- Why hasn't it sold? Are there any deal-killer items the seller is aware of (foundation, flood, title, zoning, code violations)?
- Is there a deadline driving the sale (1031 exchange, divorce, estate, relocation)? That informs how much negotiation room exists.
- Schools are B-rated — typically a magnet for longer-tenancy family renters. What's the average tenant stay here, and is there a school-zone premium baked into asking?
- What's the average days-on-market for RENTAL listings here right now (not sales)? A rising rental-DOM trend means longer vacancies and softer asking-rent achievability than the comps imply.
- What's the recent tenant-quality profile in this submarket — average credit score on applications, eviction rate, late-payment / NSF rate, and stable-employment percentage? A property-management company in the area should have these aggregated.
- How much new for-sale + rental construction is in the pipeline within 1–3 miles? Heavy new supply typically softens prices + rents 12–24 months out; constrained supply supports both.
Investment metrics
- 1% rule
- 1.09% ✓
- Cap rate
- 8.33%
- Cash-on-cash
- 7.29%
- DSCR
- 1.32
- GRM
- 7.6
CMA / ARV
- ARV (median comp)
- $149,574
- List price
- $99,900
- Delta
- -33.21%
- Verdict
- UNDERPRICED
- Comps
- 20 within 1.0 mi
Show comp detail 7 sales within ~0.75 mi
| Address | Dist | Beds/Ba | Sqft | Sold | Price | $/sf | Match |
|---|---|---|---|---|---|---|---|
| 1510 W W Logan St | 0.03mi | 3/1.0 (+1) | 1,312 (+0%) | 4mo | $150,000 | $114 | 90 |
| 711 N 7th St | 0.10mi | 2/1.0 | 1,160 (-12%) | 4mo | $140,000 | $121 | 73 |
| 312 N 4th St N | 0.41mi | 3/2.0 (+1) | 1,344 (+2%) | 3mo | $127,500 | $95 | 65 |
| 618 N 12th St | 0.26mi | 3/1.5 (+1) | 1,232 (-6%) | 16mo | $145,000 | $118 | 58 |
| 616 E 5th St | 0.74mi | 3/1.0 (+1) | 1,342 (+2%) | 3mo | $155,000 | $115 | 54 |
| 1220 N Cambria St | 0.33mi | 3/1.5 (+1) | 1,192 (-9%) | 22mo | $151,750 | $127 | 44 |
| 700 East 4th St | 0.68mi | 3/1.0 (+1) | 1,494 (+14%) | 11mo | $150,000 | $100 | 30 |
Match score weights: distance 35% · size 25% · config 20% · recency 20%. Top-matched comps best support the ARV.
Projected returns pro-forma
-0.34% appreciation · 3.0% rent growth · sell at horizon
- IRR
- 4.9%
- Equity multiple
- 1.23×
- Total profit
- $6,309
- Equity at exit
- $27,304
- IRR
- 10.5%
- Equity multiple
- 2.10×
- Total profit
- $30,815
- Equity at exit
- $31,490
Cash invested: $27,972 (down + closing). Projections, not guarantees.
Landlord ↔ Tenant lean methodology
- Overall (STATE)
- 62 Landlord-Friendly
- State Pennsylvania
- 62 Landlord-Friendly · EVEN
- County
- — inherits STATE
- City
- — inherits STATE
ZIP-level market 16617
- Home prices YoY
- -0.3%
- Active inventory
- 10
- Price-to-rent
- 7.6×
Monthly cashflow live
- Estimated rent
- $1,090 medium interval (Pro) →
- Mortgage (P&I)
- −$524
- Tax from tax record
- −$126 /mo · $1,510/yr
- Insurance
- −$42
- HOA
- −$0
- Vacancy / Maint / Mgmt
- −$229
- Net cashflow
- $170
Break-even live
Sensitivity live
| Price | -10% $226 | -5% $198 | +0% $170 | +5% $142 | +10% $113 |
|---|---|---|---|---|---|
| Rent | -10% $84 | -5% $127 | +0% $170 | +5% $213 | +10% $256 |
| Rate | -1.0pp $220 | -0.5pp $195 | base $170 | +0.5pp $144 | +1.0pp $118 |
UW: 25.0% down · 7.5% · 30yr · 1.5% tax · 5.0% vac · 8.0% maint · 8.0% mgmt
Financing live
Cash to close
- Down payment
- $24,975
- Closing costs
- $2,997
- Reserves months
- —
- Total cash needed
- —
Loan-product check · same deal, 3 products live
Conventional
25% down · 7.5% · 30yr
- Down + closing
- —
- Monthly P&I
- —
- Monthly cashflow
- —
- DSCR
- —
- Eligible?
- —
Personal DTI + credit; lowest rate.
DSCR
20% down · 8.5% · 30yr
- Down + closing
- —
- Monthly P&I
- —
- Monthly cashflow
- —
- DSCR
- —
- Eligible?
- —
No personal income docs; deal must DSCR.
Hard money
10% down · 12.0% · 12mo
- Down + closing
- —
- Monthly P&I
- —
- Monthly cashflow
- —
- DSCR
- —
- Eligible?
- —
Short-term bridge; refi at stabilization.
Listing history 29 events
-
2026-06-19days on market $99,900 Active 69 DOM
-
2026-06-18days on market $99,900 Active 68 DOM
-
2026-06-17days on market $99,900 Active 67 DOM
-
2026-06-16days on market $99,900 Active 66 DOM
-
2026-06-15days on market $99,900 Active 65 DOM
-
2026-06-14days on market $99,900 Active 63 DOM
-
2026-06-13days on market $99,900 Active 62 DOM
-
2026-06-10days on market $99,900 Active 60 DOM
-
2026-06-09days on market $99,900 Active 59 DOM
-
2026-06-08days on market $99,900 Active 58 DOM
-
2026-06-07days on market $99,900 Active 57 DOM
-
2026-06-02days on market $99,900 Active 52 DOM
-
2026-06-01days on market $99,900 Active 51 DOM
-
2026-05-31days on market $99,900 Active 50 DOM
-
2026-05-30days on market $99,900 Active 49 DOM
-
2026-04-30price $99,900 413-char remark
Show marketing remark (413 chars)
Stone-front ranch with fenced yard! This home features a distinctive stone exterior and a fenced backyard with patio, fire pit, and storage shed. Inside, you'll find a spacious kitchen with painted cabinetry and plenty of counter space, along with two bedrooms and a full bath. Off-street parking is available along the side drive. The property does need some work but offers great potential for the right buyer.
-
2026-04-11$105,000 Active 413-char remark
Show marketing remark (413 chars)
Stone-front ranch with fenced yard! This home features a distinctive stone exterior and a fenced backyard with patio, fire pit, and storage shed. Inside, you'll find a spacious kitchen with painted cabinetry and plenty of counter space, along with two bedrooms and a full bath. Off-street parking is available along the side drive. The property does need some work but offers great potential for the right buyer.
-
2025-11-17price $109,900
-
2025-10-13price $114,900
-
2023-06-08soldstatus $105,000 Closed
-
2023-05-07status Pending
-
2023-05-03price $105,000
-
2023-04-29$107,500 Active
-
2014-12-16soldstatus $69,900
-
2014-12-15soldstatus $69,900
-
2014-10-16$69,900
-
2007-09-06soldstatus $30,000
-
2007-08-20soldstatus $30,000
-
2007-04-25$29,900
ⓘ Source: listings_history table (triggers on properties + properties_extension) + one-shot
backfill from property_details.listing_events for pre-trigger history.
Tax reassessment forecast PA · Partial reset (capped growth)
- Current annual tax
- $1,510 · $126/mo
- Projected year-2 tax
- $1,544 · $129/mo
- Expected delta
- +$34/yr (+$3/mo · 2.3%)
ⓘ Screening estimate from a state-policy table — verify with the county assessor before closing.
Climate risk First Street
- Flood 1/10 Low FEMA zone X (unshaded) · 0% chance over 30 yrs
- Wildfire 3/10 Moderate
- Heat 3/10 Moderate 7 d/yr ≥92°F today · 18 d/yr by 30 yrs out
- Wind 2/10 Low
- Air quality 2/10 Low 1 unhealthy d/yr today · 3 by 30 yrs out
Nearby sold comps map
Loading sold comps map…
Walkable amenities ~0.75 mi
Loading nearby amenities…
Taxation est. · year 1
- Rental income
- $13,081
- − Mortgage interest
- −$5,596
- − Property taxes
- −$1,510
- − Insurance
- −$500
- − Repairs & maintenance
- −$1,047
- − Management
- −$1,047
- − Depreciation
- −$2,906
- Taxable income
- $476
- Est. tax owed @ 24.0%
- −$114
- After-tax cash flow
- $1,924/yr
For passive investors: Depreciation is non-cash, so a rental often shows a tax loss while cash-flowing — sheltering income. Rental losses are passive: they offset passive income freely, and up to $25,000/yr can offset ordinary (W-2) income if you actively participate and your MAGI is under $100k (phasing out to $0 by $150k); unused losses carry forward. On sale, claimed depreciation is recaptured at up to 25%, and gains may owe capital-gains tax (a 1031 exchange can defer both). Figures are a year-1 estimate at your 24.0% rate — not tax advice; consult a CPA.
Schools (NCES district)
- District
- Bellwood-Antis SD
- NCES district ID
- 4203300
- Math proficiency
- 36% ▼ -11.00%
- Reading proficiency
- 58% ▼ -10.00%
- Median HH income
- $55,347
- Composite
- 40.72/100
- National rank
- #3663
- State rank
- #224 of 539 in PA
Livability — Bellwood
- Score
- 70/100
- State rank
- #737
- US rank
- #7382
Category grades
Schools grade is shown separately in the Schools card above.
Census & demographics
- Population (ZIP)
- 2,505
Population outlook (Blair County) Hauer SSP2
- Today (2025)
- 121,571 people
- By 2030
- 117,966 · -3.0%
- By 2040
- 109,174 · -10.2%
- By 2050
- 99,542 · -18.1%
- By 2075
- 76,775 · -36.8%
- By 2100
- 54,326 · -55.3%
Race, ethnicity, and origin ACS 2023
- Neighborhood character
- Predominantly White (95%)
- Race & ethnicity
- White 95% Two or more races 3% Hispanic / Latino 2%
- Common ancestry
- Romanian 5% Italian 4% Slovak 3%
- Foreign-born
- 0% · Canada
Political lean MEDSL · Blair
- 2024 margin
- Solid R (+43.5) · D 27.9% · R 71.4%
- 2008→2024 swing
- -19.2pp toward R · 2008: -24.3pp · 2024: -43.5pp
- All cycles
- 2024: R+43.5 2020: R+43.5 2016: R+46.4 2012: R+33.5 2008: R+24.3
Not yet ingested
- Civics
- —
Market trends
- HPI YoY
- ▼ -0.34%
- Current HPI
- 124.3707
- Rent YoY
- —
- Metro
- —
- State GDP YoY
- ▲ 1.68%
- F500 in state
- 34
Industry mix (Fortune 500 HQ in PA)
| Industry | F500 HQs | Revenue |
|---|---|---|
| Healthcare | 2 | $309B |
|
||
| Insurance | 2 | $27B |
|
||
| Telecommunications / Media | 1 | $124B |
|
||
| Industrial Distribution | 1 | $22B |
|
||
| Financial Services | 1 | $20B |
|
||
| Chemicals / Materials | 1 | $18B |
|
||
Price history
+234.1% since first listed14 events — show timeline
- 2026-04-30 Price Changed $99,900 AHARMLS
- 2026-04-11 Listed $105,000 AHARMLS
- 2025-11-17 Price Changed $109,900 AHARMLS
- 2025-10-13 Price Changed $114,900 AHARMLS
- 2023-06-08 Sold (MLS) $105,000 AHARMLS
- 2023-05-07 Pending — AHARMLS
- 2023-05-03 Price Changed $105,000 AHARMLS
- 2023-04-29 Listed $107,500 AHARMLS
- 2014-12-16 Sold (Public Records) $69,900 Public Records
- 2014-12-15 Sold (MLS) $69,900 AHARMLS
- 2014-10-16 Listed $69,900 AHARMLS
- 2007-09-06 Sold (Public Records) $30,000 Public Records
- 2007-08-20 Sold (MLS) $30,000 AHARMLS
- 2007-04-25 Listed $29,900 AHARMLS
Property tax history
+12.8%/yrLatest (2025): $1,510 · +8.7% YoY. Source: county tax records.
Cash-flow waterfall
monthlySold comps — $/sqft
last 12 mo · ≤1 miLoading sold comps…